. 2013 Jan 1;591(1):219-39.
doi: 10.1113/jphysiol.2012.241398. Epub 2012 Oct 15.

Evaluation of glutamate concentration transient in the synaptic cleft of the rat calyx of Held

Affiliations

Evaluation of glutamate concentration transient in the synaptic cleft of the rat calyx of Held

Timotheus Budisantoso et al. J Physiol. .

Abstract

Establishing the spatiotemporal concentration profile of neurotransmitter following synaptic vesicular release is essential for our understanding of inter-neuronal communication. Such profile is a determinant of synaptic strength, short-term plasticity and inter-synaptic crosstalk. Synaptically released glutamate has been suggested to reach a few millimolar in concentration and last for <1 ms. The synaptic cleft is often conceived as a single concentration compartment, whereas a huge gradient likely exists. Modelling studies have attempted to describe this gradient, but two key parameters, the number of glutamate in a vesicle (N(Glu)) and its diffusion coefficient (D(Glu)) in the extracellular space, remained unresolved. To determine this profile, the rat calyx of Held synapse at postnatal day 12-16 was studied where diffusion of glutamate occurs two-dimensionally and where quantification of AMPA receptor distribution on individual postsynaptic specialization on medial nucleus of the trapezoid body principal cells is possible using SDS-digested freeze-fracture replica labelling. To assess the performance of these receptors as glutamate sensors, a kinetic model of the receptors was constructed from outside-out patch recordings. From here, we simulated synaptic responses and compared them with the EPSC recordings. Combinations of N(Glu) and D(Glu) with an optimum of 7000 and 0.3 μm(2) ms(-1) reproduced the data, suggesting slow diffusion. Further simulations showed that a single vesicle does not saturate the synaptic receptors, and that glutamate spillover does not affect the conductance amplitude at this synapse. Using the estimated profile, we also evaluated how the number of multiple vesicle releases at individual active zones affects the amplitude of postsynaptic signals.


Figures
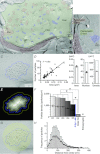
Figure 3
Figure 3. AMPAR number and distribution of the MNTB synapse
A, an SDS-FRL image of a large portion of the somatic membrane of the MNTB principal cell. The postsynaptic exoplasmic face (E-face) of the somatic membrane (green) contained multiple IMP clusters representing the glutamatergic postsynaptic densities (PSDs; blue). It also contained several ruptured spots where the corresponding presynaptic protoplasmic face (P-face) membrane was exposed (orange). A cross-fracture of the presynaptic structure indicates the cytoplasm (dark red). B, detailed image of the three highlighted areas. Multiple vesicles (SVs; black arrowheads) were identified in the cross-fractured presynaptic terminal. C, a characteristic IMP cluster on the postsynaptic E-face (demarcated with blue line) labelled for AMPARs (with 5 nm gold particles). D, AMPAR labelling positively correlated with the area of synapses (n= 59 complete synapses). The average synaptic area (CV = 0.60 and 0.78), and the average synaptic number (CV = 0.59 and 0.59) and density of the immunoparticles (with calibration: grey bars) from 2 animals. E, intrasynaptic distribution of AMPARs in a synapse area divided into 5 divisions of equal width using the distance map. An extra division with 30 nm width on the outer rim was added. F, particle density in each division was averaged across all synapses and also calibrated (grey bars). Very few particles were found in the extrasynaptic region (5.8 ± 0.6 particles μm−2). One-way repeated-measures ANOVA followed by pairwise comparisons were used. G, concentric rings of 10 nm bins from the centre of gravity of each synapse were defined. H, based on this map, the average AMPAR immunoparticle distribution (with calibration: grey bars) from the centre of gravity was tabulated (n= 65 synapses from one animal). *P < 0.05. Error bars indicate SEM.
Figure 2
Figure 2. AMPAR kinetic model simulating AMPAR currents in outside-out somatic patches from the MNTB principal cell
A, kinetic scheme of the AMPAR model. Rates were as follows (units are m−1 s−1 for k1, k2, k3, k11, k12, k13, k14, and s−1 for the rest): k1= 18.412 × 10⁶, k−1= 4.323 × 10³, k2= 4.000 × 10⁶, k−2= 17.201 × 10³, k3= 19.863 × 10⁶, k−3= 1.168 × 10³, β= 51.690 × 10³, α= 10.082 × 10³, k4= 885.990, k−4= 280.350, k5= 449.033, k−5= 1.944, k6= 2.797, k−6= 39.497 × 10⁻³, k7= 1.380 × 10³, k−7= 421.849, k8= 848.141, k−8= 538.920, k9= 51.700, k−9= 29.164, k10= 939.000, k−10= 24.463, k11= 105.000 × 10⁶, k−11= 14.400 × 10³, k12= 26.250 × 10⁶, k−12= 57.600 × 10³, k13= 92.007 × 10+3, k−13= 4.323, k14= 875.000 × 10+3, k−14= 24.000. B, AMPAR deactivation and desensitization kinetics of patch recordings (Patch) and simulations (Model) exposed to 10 mm glutamate. Deactivation time constant (τdeact) of Patch and Model is 0.41 ± 0.03 ms (n= 19) and 0.41 ms, respectively. Desensitization time constants and the relative portion of fast constants of Patch were: τfast= 0.65 ± 0.04 ms, τslow= 2.72 ± 0.28 ms, %fast = 69.2 ± 3.4, τweightedw) = 1.20 ± 0.06 ms (n= 30). Model: τfast= 0.71 ms, τslow= 2.14 ms, %fast = 62.1, τw= 1.25 ms. C, non-stationary noise analysis of the decaying phase during desensitization of the patch responses to 10 mm glutamate (open tip: top trace). Middle trace is the average AMPAR response (dark) of 49 sweeps (grey) with the corresponding ensemble variance shown below. The variance was plotted against the mean current from the same sample patch. A parabolic function was fitted from which the single channel conductance (γ), maximum open probability (POmax) and number of channels were deduced (for this patch: γ = 26.4 pS; POMax= 0.64; 38 channels). Summarized are the average γ and POMax (21.4 ± 1.1 pS (n= 19), POMax= 0.61 ± 0.02 (n= 13)). The model produced a POMax of 0.61. D, Patch and Model responses to paired 10 ms pulses of 10 mm glutamate with different intervals. Recovery from desensitization was plotted (n= 12). Double exponential curve fit to the PPR recovery with rates as follows: Patch, τfast= 20.1 ms, τslow= 58.7 ms, %fast = 62.3, τw= 34.7 ms; Model, τfast= 21.9 ms, τslow= 50.0 ms, %fast = 63.9, τw= 32.1 ms. E, Patch and Model responses to different concentrations of glutamate. Dose–response relationship of the normalized peak current was plotted. Hill coefficient and EC50 were, respectively, 1.20 and 1242 μm for the Patch (n= 5–12), and for the Model 1.37 and 1343 μm. F, recorded and simulated traces activated by two pulses (duration = 10 ms, interval = 20 ms) of 2 mm or 4 mm glutamate in the presence and absence of 2 mmγ-d-glutamylglycine (γDGG). Application of γDGG blocked the patch current of the first pulse by 71.4 ± 1.8% (n= 9; Model: 70.2%) when combined with 2 mm glutamate. When combined with 4 mm glutamate, the block became 52.6 ± 1.2% (n= 10; Model 54.0%). Errors bars indicate SEM.
Figure 1
Figure 1. Amplitude of AMPAR currents in the absence and presence of γ-d-glutamylglycine (γDGG)
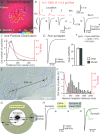
A, spontaneous AMPAR-mediated miniature (m)EPSCs in the presence of 50 μm d-AP5, 100 μm picrotoxin, 0.5 μm strychnine and 0.5 μm TTX in 2 mm[Ca2+]o. B, collected mEPSCs were aligned (grey) and averaged (black). mEPSC amplitude and baseline noise (open and grey bars, 2 pA and 0.2 pA bins, respectively) are plotted in histograms shown below. CV of the peak amplitude was 0.36 for this recording and 0.38 ± 0.02 for all recordings (n= 21). C, summary of average mEPSC amplitude (n= 21). D, recordings of evoked EPSCs normalized at different [Ca2+]o from four cells. Note that the y-axis scale bar is different for each recording. The amount of block after application of 2 mmγDGG varied depending on the Pr. E, the average block by γDGG was plotted against the [Ca2+]o (n= 7–11). *P < 0.05. Error bars indicate SEM.
Figure 4
Figure 4. Simulations of AMPA receptor (AMPAR) response to quantal release
A, glutamate concentration profile (red scale; NGlu= 7000, DGlu= 0.3 μm2 ms−1) and simulated AMPAR PO (pseudo-colour) at 0.05 ms after release at the centre of gravity of the sample synapse. B, glutamate concentration transients and corresponding AMPAR responses at location 1–3. The sum of the responses of all AMPARs present in the sample synapse is shown, after multiplication with calibration number (Cal). Conversion from open AMPAR to current was done with the formula shown below. C, average AMPAR immunoparticle distribution from the centre of gravity (grey) was plotted along with the simulated peak PO of AMPAR at each distance from the release site (red). D, simulation of the summed response of all receptors distributed on an average synapse. Summary of peak open AMPARs from simulation (Model) and recording (Data). E, an example of two neighbouring IMP clusters on the postsynaptic E-face with panAMPAR labelling (5 nm gold particles). F, histogram of nearest-neighbour distances (NNDs) of IMP clusters (50 nm bins, n= 177). Distance versus simulated peak PO is shown in red. G, illustration of the defined synaptic (centre) and extrasynaptic (yellow) area and the synapse at NND (grey; 780 nm). Extrasynaptic area was divided by 10 nm bins from the synaptic centre (grey lines; 50 nm bins = black lines). The extrasynaptic AMPAR distribution was assumed to be homogeneous. H, simulation of synaptic and extrasynaptic response, and synaptic response at mean NND after a quantal release at the centre of gravity of a synapse. The sum of all responses is shown in green. I, simulated response for an AMPAR located on (@ 0 nm) and at 400 nm (dotted traces) from the centre of release in the presence (blue) and absence (black) of 2 mmγ-d-glutamylglycine (γDGG). Simulated peak PO and γDGG block versus distance were plotted below. J, average quantal response was simulated in the absence (black) and presence (blue) of 2 mmγDGG. γDGG block from simulation (Model) and recording (Data) was summarized.
Figure 5
Figure 5. Simulations based on a range of NGlu and DGlu combinations
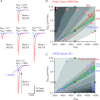
A, simulated synaptic responses at a synapse with an average AMPA receptor (AMPAR) distribution are shown in red. Simulated synaptic responses in the continued presence of 2 mmγ-d-glutamylglycine (γDGG) are shown in blue. γDGG block is calculated as the percentage reduction of the peak amplitude in γDGG (dotted arrow). Results from several NGlu and DGlu combinations are shown. B and C, grey scale contour plot of the peak open AMPARs (B) and γDGG block (C) within a range of NGlu and DGlu combinations. Black dots indicate the NGlu and DGlu combinations that were actually tested with the simulations, and the contour plots were made based on these values. The open circles indicate the NGlu and DGlu combinations used for generating the sample traces shown in A. The values of the contour lines are labelled with red and blue numbers in B and C, respectively. Contour lines that match the average values of the experimentally measured peak open AMPARs (24.9) and γDGG block (89.5%) are shown in red bold (B) and blue bold (C) diagonal lines, respectively. Contour lines representing the 25th, 50th and 75th percentile values of the experimentally measured peak open AMPARs and γDGG block are indicated by the dotted lines. The range of NGlu and DGlu combinations that lie within the 25th to 75th percentile range of both the peak open AMPAR and the γDGG block is highlighted in green.
Figure 6
Figure 6. Evaluation of MVR
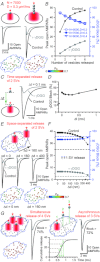
A, schema of release situation assumed is shown on top. Situations with a single vesicle (left) and 4 vesicles (right) simultaneously released at the centre of the synapse with an average AMPA receptor (AMPAR) distribution were simulated. The NGlu and DGlu were set to 7000 and 0.3 μm2 ms−1, respectively, for all the following simulations unless otherwise noted. Simulated traces of open AMPAR are shown in black (control) and grey (2 mmγ-d-glutamylglycine (γDGG)). PO of individual AMPAR (pseudo colour) on a sample synapse at 0.05 ms after release for each situation is shown below. B, the peak open AMPARs (left y-axis) in the absence (black) and presence of γDGG (grey) and the percentage γDGG block (blue, right y-axis) were plotted against the number of vesicles released. Simulations based on different NGlu and DGlu combinations that could reproduce the quantal response relatively well (Fig. 5) were tested, and the percentage γDGG block was plotted for these combinations as well. C, simulations of asynchronous release of 2 vesicles on an average synapse. Sample traces shown were based on simulations with the releases of 2 vesicles separated by Δt= 0.1 ms. D, percentage γDGG block was plotted against Δt. E, simulations of simultaneous release of 1 vesicle at the centre and the 2nd vesicle at varying distances from the centre (Δd) of a sample synapse. An ellipse was fitted to the demarcation and the 2nd release was assumed to occur along the major axis. PO of individual AMPAR is shown below for Δd= 0 nm and 160 nm. F, the peak open AMPARs in the absence and presence of γDGG and percentage γDGG block were plotted against Δd. The dotted lines in each colour indicate the expected values of the peak PO and the percentage γDGG block for single vesicular release. G, left, simultaneous release of 4 vesicles with Δd= 80 nm from the centre along the major axis and Δd= 50 nm from the centre along the minor axis of a sample synapse. PO of individual AMPAR is shown below and traces of open AMPARs are shown on the right. Right, asynchronous release of 3 vesicles with one in the centre and two at Δd= 80 nm along the major axis. Release rate was calculated by deconvolution of the evoked EPSC with the idealized mEPSC, from which the cumulative release was plotted below. Assuming release at the timing of 25%, 50% and 75% of the total release, the release intervals (green arrows) were calculated. The corresponding open AMPAR traces are shown on the right.

References

    1. Auger C, Kondo S, Marty A. Multivesicular release at single functional synaptic sites in cerebellar stellate and basket cells. J Neurosci. 1998;18:4532–4547. - PMC - PubMed
    1. Barbour B. An evaluation of synapse independence. J Neurosci. 2001;21:7969–7984. - PMC - PubMed
    1. Barbour B, Häusser M. Intersynaptic diffusion of neurotransmitter. Trends Neurosci. 1997;20:377–384. - PubMed
    1. Beato M. The time course of transmitter at glycinergic synapses onto motoneurons. J Neurosci. 2008;28:7412–7425. - PMC - PubMed
    1. Bekkers JM, Stevens CF. Cable properties of cultured hippocampal neurons determined from sucrose-evoked miniature EPSCs. J Neurophysiol. 1996;75:1250–1255. - PubMed

Publication types

LinkOut - more resources