. 2012 Oct 15;26(20):2271-85.
doi: 10.1101/gad.196451.112.

Regulated proteolysis of Trop2 drives epithelial hyperplasia and stem cell self-renewal via β-catenin signaling

Affiliations

Regulated proteolysis of Trop2 drives epithelial hyperplasia and stem cell self-renewal via β-catenin signaling

Tanya Stoyanova et al. Genes Dev. .

Abstract

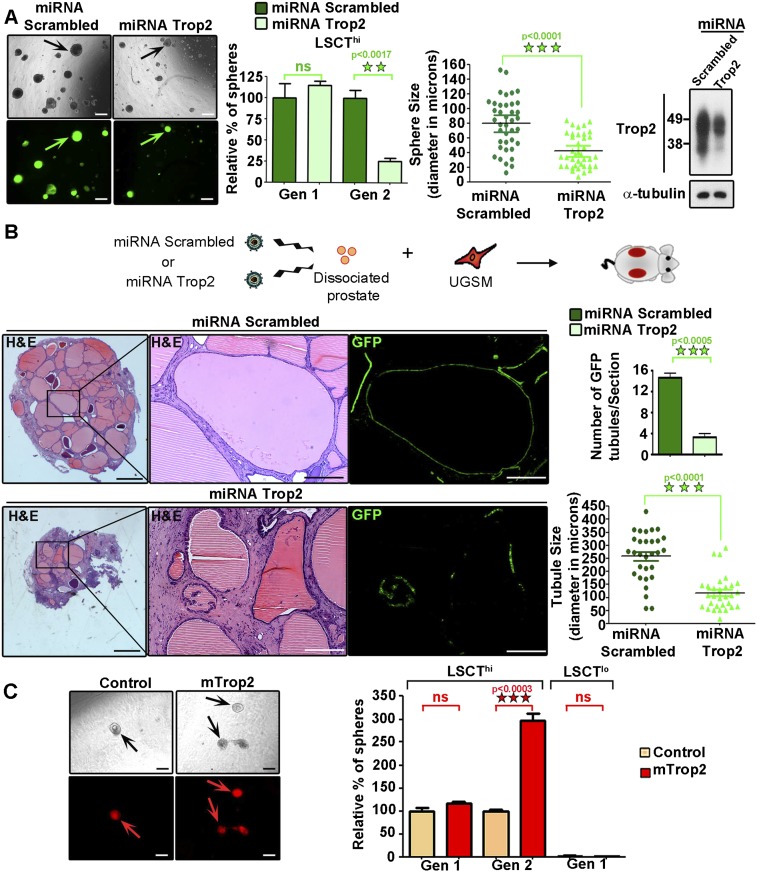
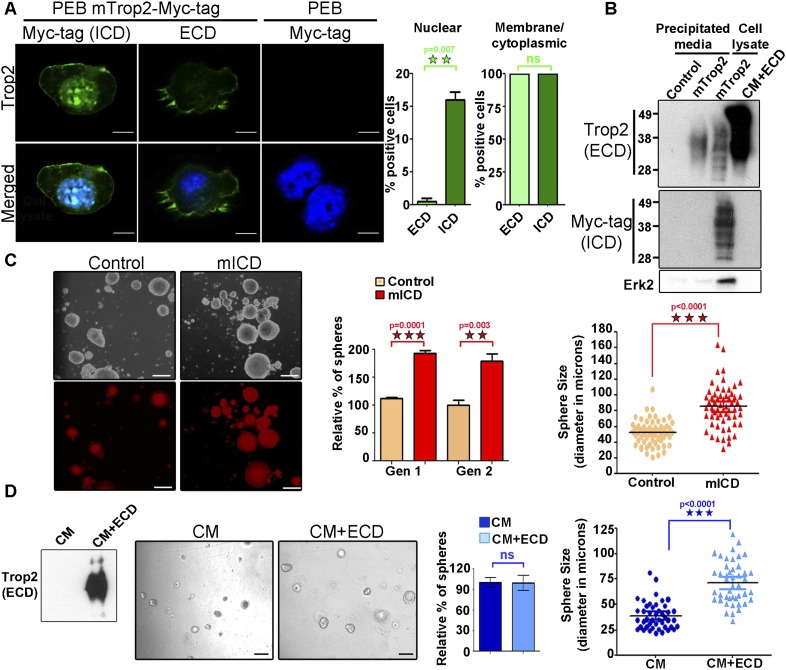
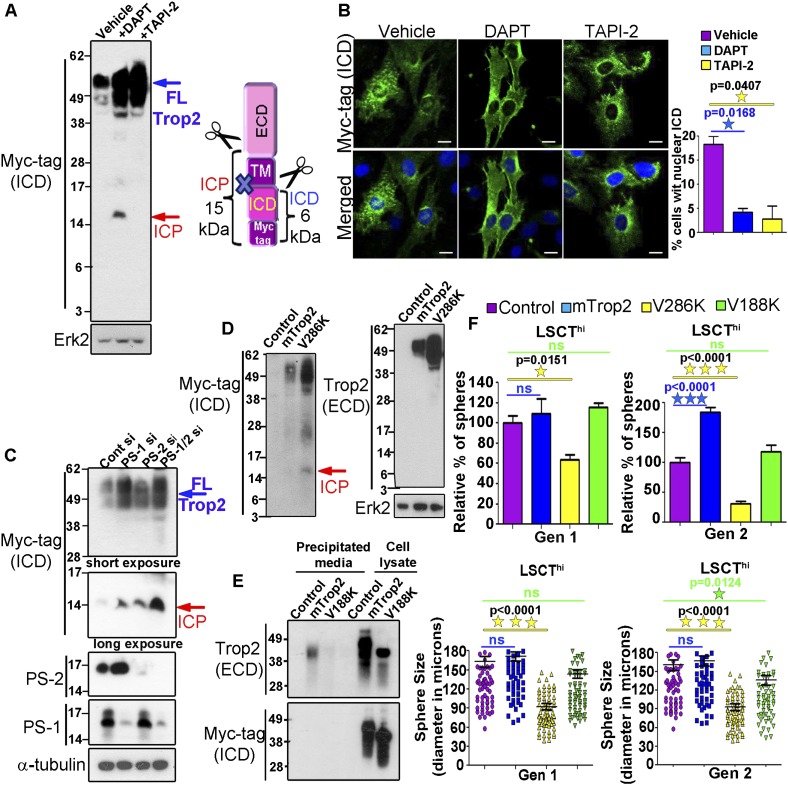
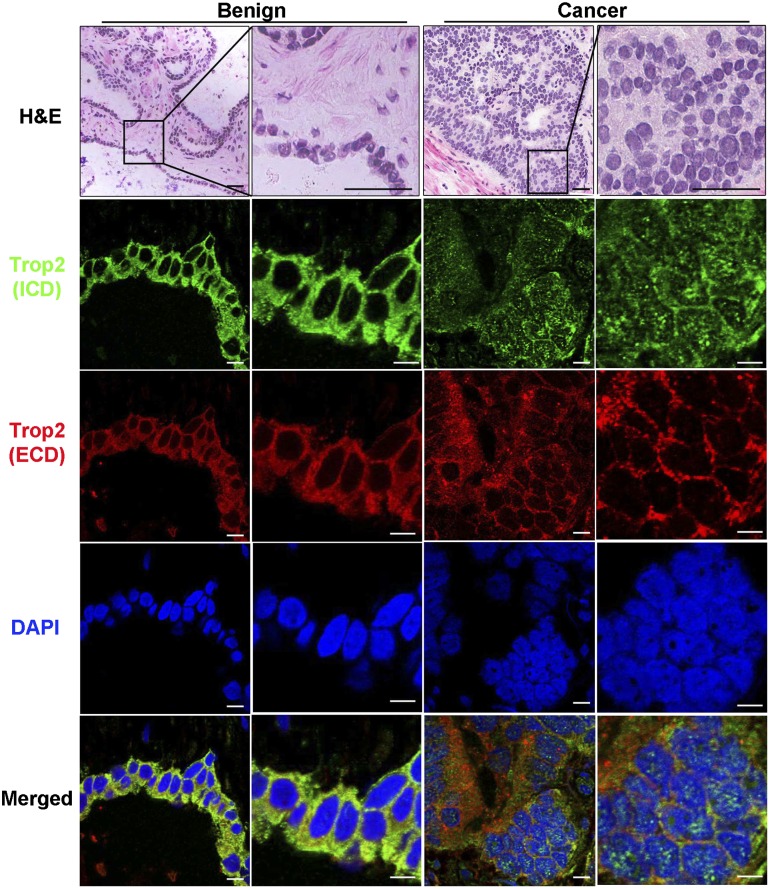
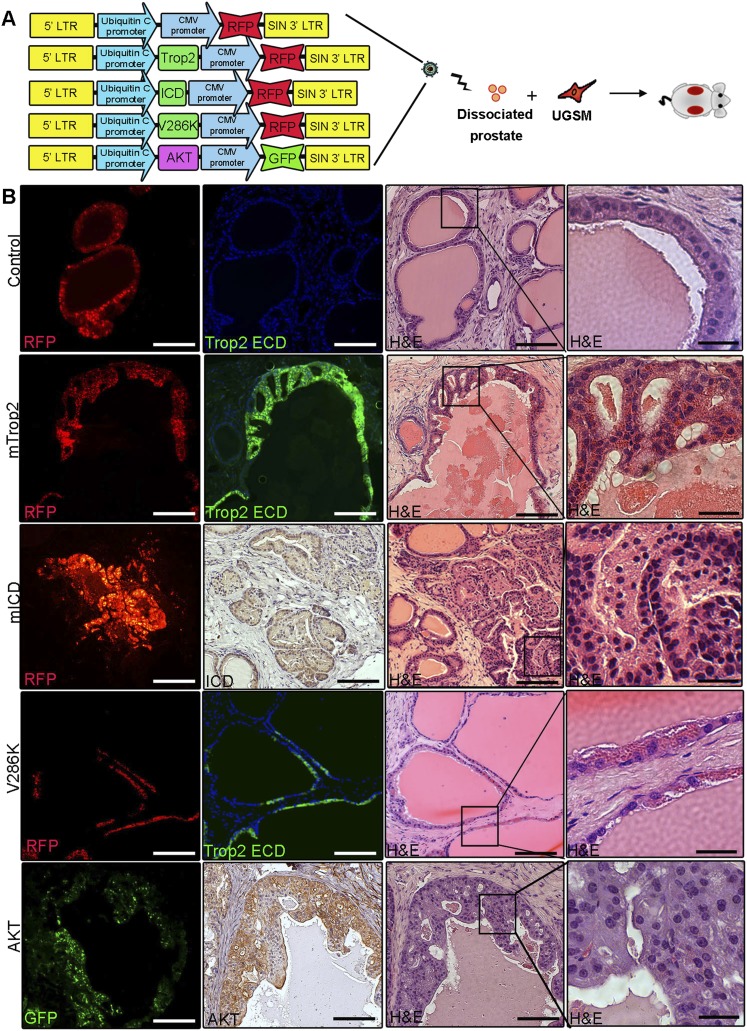
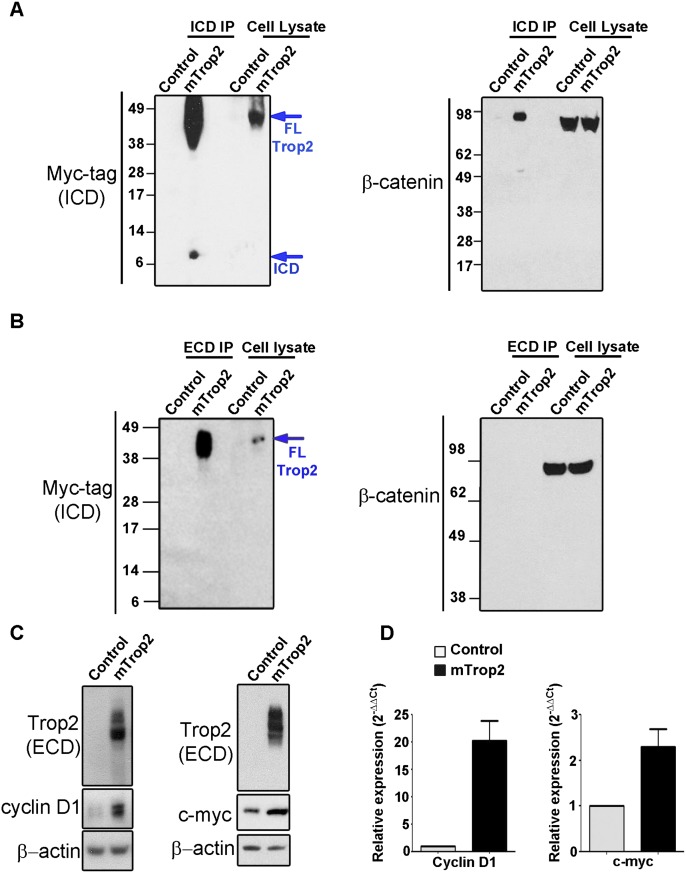
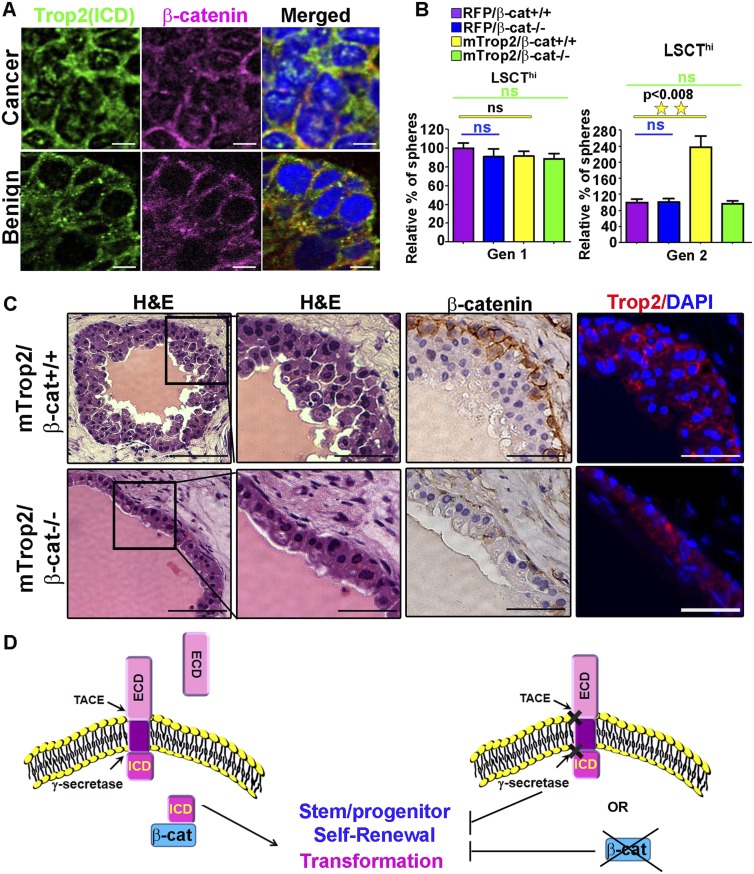
The cell surface protein Trop2 is expressed on immature stem/progenitor-like cells and is overexpressed in many epithelial cancers. However the biological function of Trop2 in tissue maintenance and tumorigenesis remains unclear. In this study, we demonstrate that Trop2 is a regulator of self-renewal, proliferation, and transformation. Trop2 controls these processes through a mechanism of regulated intramembrane proteolysis that leads to cleavage of Trop2, creating two products: the extracellular domain and the intracellular domain. The intracellular domain of Trop2 is released from the membrane and accumulates in the nucleus. Heightened expression of the Trop2 intracellular domain promotes stem/progenitor self-renewal through signaling via β-catenin and is sufficient to initiate precursor lesions to prostate cancer in vivo. Importantly, we demonstrate that loss of β-catenin or Trop2 loss-of-function cleavage mutants abrogates Trop2-driven self-renewal and hyperplasia in the prostate. These findings suggest that heightened expression of Trop2 is selected for in epithelial cancers to enhance the stem-like properties of self-renewal and proliferation. Defining the mechanism of Trop2 function in self-renewal and transformation is essential to identify new therapeutic strategies to block Trop2 activation in cancer.


Figures

Figure 1.
Figure 1.
Trop2 regulates self-renewal in the prostate. (A) Prostate progenitor cells (LSCThi) were isolated by fluorescence-activated cell sorting (FACS). An equal number of LSCThi cells was infected with a lentivirus expressing scrambled miRNA and GFP (miRNA Scrambled) or a lentivirus expressing Trop2 miRNA and GFP (miRNA Trop2), followed by the in vitro sphere assay. Each sample in the experiment was plated in triplicate. Three independent experiments were performed. The left panels show representative sphere pictures and nearly 100% infection efficiency, assessed by GFP-positive spheres. Bar, 100 μm. Sphere number and diameter, referred to as sphere size in microns, were counted at generation 1 (Gen 1). Spheres were dissociated into single cells, and an equal number of cells was plated for passaging to generation 2 (Gen 2). Sphere number is presented as percentage normalized to miRNA Scrambled. Data are represented as mean of the triplicates ± SEM. Statistical analysis is shown. (ns) Nonsignificant. The level of Trop2 knockdown is shown by Western blot in spheres at Gen 1 prior to replating for Gen 2. Trop2 is highly glycosylated and appears as an irregular band between 35 and 50 kD (Supplemental Fig. S1C). (B) Trop2 expression was down-regulated in dissociated primary prostate cells via transduction with miRNA Scrambled or miRNA Trop2 lentivirus expressing GFP followed by the in vivo regeneration assay. One out of three representative recovered grafts for each condition is shown. Bars: left panels, 800 μm; right panels, 100 μm. The number of GFP tubules per section for each graft was counted in miRNA Scrambled or miRNA Trop2 grafts and plotted as mean ± SEM. Diameter of 30 GFP-positive tubules was measured in microns. (C) An equal number of LSCThi or LSCTlo cells was transduced with a RFP-expressing (control) or mouse Trop2- and RFP-expressing (mTrop2) lentivirus and plated in triplicate for each sample in an in vitro sphere assay. Three independent experiments were performed. The left panels represent spheres from LSCThi transduced with either RFP (control) or mTrop2 and RFP (mTrop2). Bars, 100 μm. LSCThi sphere number was counted at Gen 1 and Gen 2, while LSCTlo sphere number was counted only at Gen 1, since no growth was observed. Sphere number is presented as percentage normalized to RFP transduced spheres and presented as mean of the triplicates ± SEM.
Figure 2.
Figure 2.
Trop2 ECD and ICD localize at distinct sites within the cell. Trop2 regulates stem/progenitor self-renewal through ICD and ECD cleavage products. (A) Confocal microscopy of PEB cells stained with anti-Myc tag or anti-ECD antibody and DAPI. The right two panels represent PEB cells infected with lentivirus expressing RFP (PEB) as a negative control to determine whether anti-Myc tag antibody recognizes any endogenous myc. Staining of PEB cells expressing mTrop2 with a C-terminal Myc tag to follow the ICD with the indicated antibodies is presented in the left four panels. Bar, 10 μm. One out of three independent experiments is shown. Graphs represent the percentage of cells with nuclear ICD or ECD (left graph) and cytoplasmic and membrane ICD or ECD (right graph). (B) Serum-free medium from TRAMP-C2 cells transduced with RFP lentivirus (control) or mTrop2-Myc tag (mTrop2) was precipitated (precipitated media), followed by Western blot using commercial anti-ECD antibody or anti-Myc tag recognizing the ICD or Erk2 as a marker for cell lysate. Cell lysates from TRAMP-C2 cells expressing mTrop2-Myc tag (mTrop2) and CM produced by 293T expressing secreted Trop2-ECD-Fc (CM+ECD) were used as positive controls. Only the ECD of Trop2 was detected in the precipitated media. Highly glycosylated Trop2 is shown between 35 and 50 kD. Four independent experiments were performed. (C) An equal number progenitor cells (LSCThi) was transduced with a control RFP-expressing (control) or Trop2 ICD-expressing (mICD) lentivirus and plated in triplicates in the sphere assay. Representative pictures are presented in the left panels. Bars, 100 μm. Seven days later, we observed an increase in sphere size and number as early as Gen 1 (graphs presented on the right). Orange panels represent RFP-infected spheres (control), and red panels show mICD-infected spheres. The ICD alone enhance self-renewal, as measured by sphere number in Gen 2. Sphere number in each sample is presented as the percentage normalized to the RFP-infected spheres (control). Data are represented as mean ± SEM. (Right graph) Sphere size is presented in diameter in microns. Three independent experiments were performed. (D) Generation of 293T cells line expressing secreted ECD. (Left) Conditioned medium produced by 293T expressing RFP (CM) or Trop2-ECD-Fc and RFP (CM+ECD) was subjected to Western blot analysis with anti-ECD antibody. Equal numbers of progenitor cells (LSCThi) were plated in triplicate and treated with conditioned medium from control 293T cells infected with RFP (CM) or 293T cells stably expressing and secreting Trop2-ECD-Fc and RFP (CM+ECD). Images show spheres grown in the presence of CM or CM+ECD. Bars, 100 μm. No difference in sphere number was observed (left graph), while there was a significant increase in sphere size upon treatment with CM+ECD at Gen 1 (right graph). Dark-blue bars represent spheres treated with CM, and light-blue bars represents spheres treated with CM+ECD. Three independent experiments were performed.
Figure 3.
Figure 3.
Trop2 is cleaved by RIP. Trop2 cleavage mutants are deficient in inducing self-renewal in vitro. (A) PEB-Trop2-Myc tag cells were treated with either DMSO (vehicle), DAPT, or TAPI-2, followed by Western blot. The red arrow indicates accumulated ICP. The ICD cannot be detected without immunoprecipitation (IP). The blue arrow indicates full-length mTrop2 (FLTrop2). Full-length Trop2 appears between 35 and 50 kD. One out of three independent experiments is shown. Schematic representation of the generation of 15-kD ICP upon treatment with DAPT is shown on the right. (B) TRAMP-C2 expressing mTrop2 with a C-terminal Myc tag to follow the ICD were treated with DMSO (vehicle), DAPT, or TAPI-2. Twenty-four hours post-treatment, cells were fixed and stained with anti-Myc tag or anti-ECD antibody and DAPI and subjected to confocal microscopy. Bar, 10 μm. One out of two independent experiments is shown. The graph represents the percentage of cells with nuclear ICD. (C) PEB expressing Trop2-Myc tag cells were transfected with nontargeting (Cont), PS-1, PS-2, or both PS-1 and PS-2 siRNA, followed by Western blot with the indicated antibodies. Similar to DAPT treatment, knockdown of presenilins caused ICP appearance, as indicated by the red arrow. The blue arrow shows full-length Trop2 (FLTrop2). One out of three independent experiments is shown. (D) PEB cells were infected with lentivirus expressing RFP (control), mTrop2-Myc tag and RFP (mTrop2), or V286K-Myc tag (V286) mutant. Cells were lysed and subjected to Western blot with antibodies against Myc tag or the ECD of Trop2. The red arrow shows ICP appearance in V286K, demonstrating not fully processed Trop2. One out of three independent experiments is shown. (E) Serum-free medium from TRAMP-C2 cells transduced with RFP lentivirus (control), mTrop2-Myc tag (mTrop2), or V188K-Myc tag (V188K) was precipitated, followed by Western blot using commercial anti-ECD antibody or anti-Myc tag recognizing the ICD. Only the ECD of Trop2 was detected in the precipitated media from cells expressing wild-type Trop2, but not from cells expressing V188K. Two independent experiments were performed. (F) LSCThi cells were isolated by FACS, and an equal number of cells was infected with RFP (control), mTrop2, V286K, or V188K mutants expressing lentivirus and plated in triplicate. Sphere number and diameter in microns were quantified after Gen 1 and Gen 2. (Left graphs) Sphere number in each sample is presented as the percentage normalized to the RFP-infected spheres (control). Data are represented as mean ± SEM. Sphere size measured by sphere diameter in microns is presented in the right graphs. Purple bars represent RFP (control), blue bars indicate mTrop2, yellow bars represent V286K mutant, and green bars indicate V188K mutant-infected spheres. Each sample in the experiment was plated in triplicate. Three independent experiments were performed.
Figure 4.
Figure 4.
Nuclear localization of the ICD is found in human prostate cancer. Immunofluorescence with anti-ECD and anti-ICD antibodies and DAPI of tissues from human prostate cancer patients. One out of 11 patient samples is shown. A benign region is presented in the left two columns, and a cancer region is shown in the right two columns. Histology is shown in the top two panels by H&E staining. Bars, 100 μm. ICD nuclear localization can be detected only in cancer but not in the benign prostate (green). The ECD is found in the cytoplasm and on the membrane in the benign and cancer regions (red). DAPI demonstrates nuclear staining (blue). Merged images are presented in the bottom panels. In the immunofluorescence images to visualize ICD and ECD localization, bars represent 10 μm.
Figure 5.
Figure 5.
Trop2 and the ICD alone drive hyperplasia in vivo. (A) Schematic representation of the in vivo regeneration assay and lentiviral construct used. (B) Dissociated primary prostate cells were transduced with lentivirus expressing RFP (control), Trop2, mICD, V286K, or AKT. Infected prostate cells were combined with UGSM and subjected to the in vivo regeneration assay. Eight weeks later, grafts were recovered, fixed in formalin, and sectioned for histological analysis. The left panels represent immunofluorescence (IF) showing infected tubules, and the middle panel shows immunofluorescence with anti-Trop2 ECD or immunohistochemistry (IHC) with anti-ICD or anti-AKT, respectively. The right two panels show the histology of the recovered grafts. One out of three independent experiments is shown. Bars: right panels, 200 or 50 μm.
Figure 6.
Figure 6.
Trop2 signals through β-catenin. (A) Trop2 ICD binds β-catenin. Cell lysates from TRAMP-C2 cells expressing either RFP (control) or the mTrop2-Myc tag and RFP (mTrop2) were subjected to immunoprecipitation using antibodies against the ICD raised in our laboratory (ICD immunoprecipitation), followed by Western blot with anti-Myc tag (ICD) (on the left) or anti-β-catenin (on the right) antibodies. Trop2 is shown between 35 and 50 kD due to high glycosylation. One out of three independent experiments is shown. (B) Lysates from TRAMP-C2 cells transduced with a RFP-expressing lentivirus (control) or mouse Trop2 and RFP lentivirus (mTrop2) were subjected to immunoprecipitation with polyclonal antibody against the ECD of Trop2, followed by Western blot with anti-Myc tag (ICD) or anti-β-catenin antibodies. No interaction between the ECD and β-catenin was observed. One out of three independent experiments is presented. (C) Overexpression of Trop2 increases β-catenin target genes. Lysates from PEB expressing RFP (control) or mouse Trop2 (Trop2) were subjected to SDS-PAGE followed by Western blot with anti-Trop2 ECD, anti-cyclin D1, anti-c-myc, or anti-β-actin antibodies. One out of three independent experiments is shown. (D) RNA isolated from PEB expressing RFP (control) or mouse Trop2 (Trop2) was subjected to cDNA synthesis, and quantitative PCR was performed in triplicate using mouse-specific cyclin D1 and c-myc primers. One out of three independent experiments is shown. Fold change of cyclin D1 and c-myc mRNA levels is normalized to GAPDH (internal control).
Figure 7.
Figure 7.
Trop2 regulates self-renewal and transformation though β-catenin. (A) Immunofluorescence of tissues from human prostate cancer patients with anti-ICD and anti-β-catenin antibodies and DAPI. One out of 11 patient samples is shown. A cancer region is presented in the top panels, and a benign region is shown in the bottom panels. The ICD (green) colocalizes with β-catenin (pink) in the nucleus only in cancer but not in the benign prostate. DAPI demonstrates nuclear staining (blue). Merged images are presented in the bottom panels. Bars, 10 μm. (B) Trop2-mediated enhanced self-renewal requires β-catenin. Isolated progenitor cells (LSCThi) from β-catenin conditional knockout mice (loxP/loxP) were infected with either mTrop2- and RFP-expressing lentivirus or control RFP (RFP) and either Cre recombinase- and GFP-expressing lentivirus (to drive excision of loxP sites, β-cat−/−) or control GFP-expressing lentivirus (β-cat+/+). Infected cells were plated in triplicate in the sphere-forming assay, and sphere numbers were quantified 7 d post-plating for Gen 1 and further passaged to Gen 2. (Left graphs) Sphere number in each sample is presented as the percentage normalized to the RFP control. Data are represented as mean ± SEM. One out of three independent experiments is shown. (C) Dissociated primary prostate cells from β-catenin conditional knockout mice were transduced with either mTrop2- and RFP-expressing lentivirus and either Cre recombinase (mTrop2/β-cat−/−) or GFP (mTrop2/β-cat+/+) and combined with UGSM and subjected to the in vivo regeneration assay. Eight weeks later, grafts were recovered, fixed in formalin, and sectioned for histological analysis. The left four panels represent histology (H&E staining). The right panels show immunohistochemistry (IHC) with anti-β-catenin or immunofluorescence with anti-Trop2 ECD and DAPI. Bars: right panels, 100 or 50 μm. (D) Trop2 is activated through RIP by the TACE and γ-secretase complex. RIP of Trop2 results in shedding of the ECD and release of the ICD to the nucleus. The ICD promotes self-renewal through β-catenin. The models suggest that the ICD promotes transformation through its self-renewal activity.

Similar articles

Cited by

References

    1. Alberti S. 2012 Anti-trop-2 monoclonal antibodies and uses thereof in the treatment and diagnosis of tumors. U.S. Patent US 20120052076.
    1. Basu A, Goldenberg DM, Stein R 1995. The epithelial/carcinoma antigen EGP-1, recognized by monoclonal antibody RS7-3G11, is phosphorylated on serine 303. Int J Cancer 62: 472–479 - PubMed
    1. Bigas A, Martin DI, Milner LA 1998. Notch1 and Notch2 inhibit myeloid differentiation in response to different cytokines. Mol Cell Biol 18: 2324–2333 - PMC - PubMed
    1. Bostwick DG, Montironi R 1995. Prostatic intraepithelial neoplasia and the origins of prostatic carcinoma. Pathol Res Pract 191: 828–832 - PubMed
    1. Brown MS, Ye J, Rawson RB, Goldstein JL 2000. Regulated intramembrane proteolysis: A control mechanism conserved from bacteria to humans. Cell 100: 391–398 - PubMed

Publication types

MeSH terms