. 2012 Nov 30;287(49):41481-98.
doi: 10.1074/jbc.M112.361782. Epub 2012 Oct 15.

HIV-1 Nef impairs heterotrimeric G-protein signaling by targeting Gα(i2) for degradation through ubiquitination

Affiliations

HIV-1 Nef impairs heterotrimeric G-protein signaling by targeting Gα(i2) for degradation through ubiquitination

Prabha Chandrasekaran et al. J Biol Chem. .

Abstract

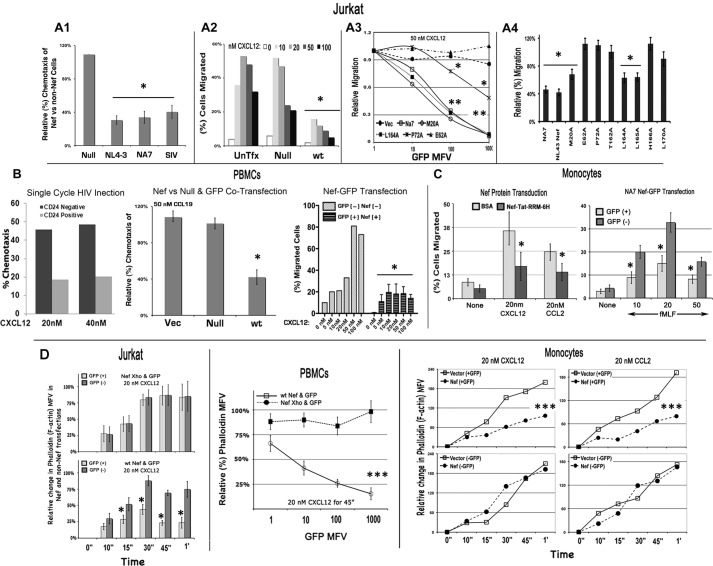
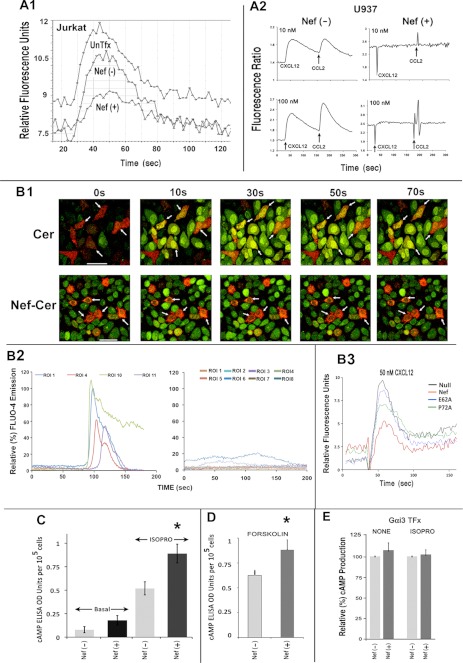
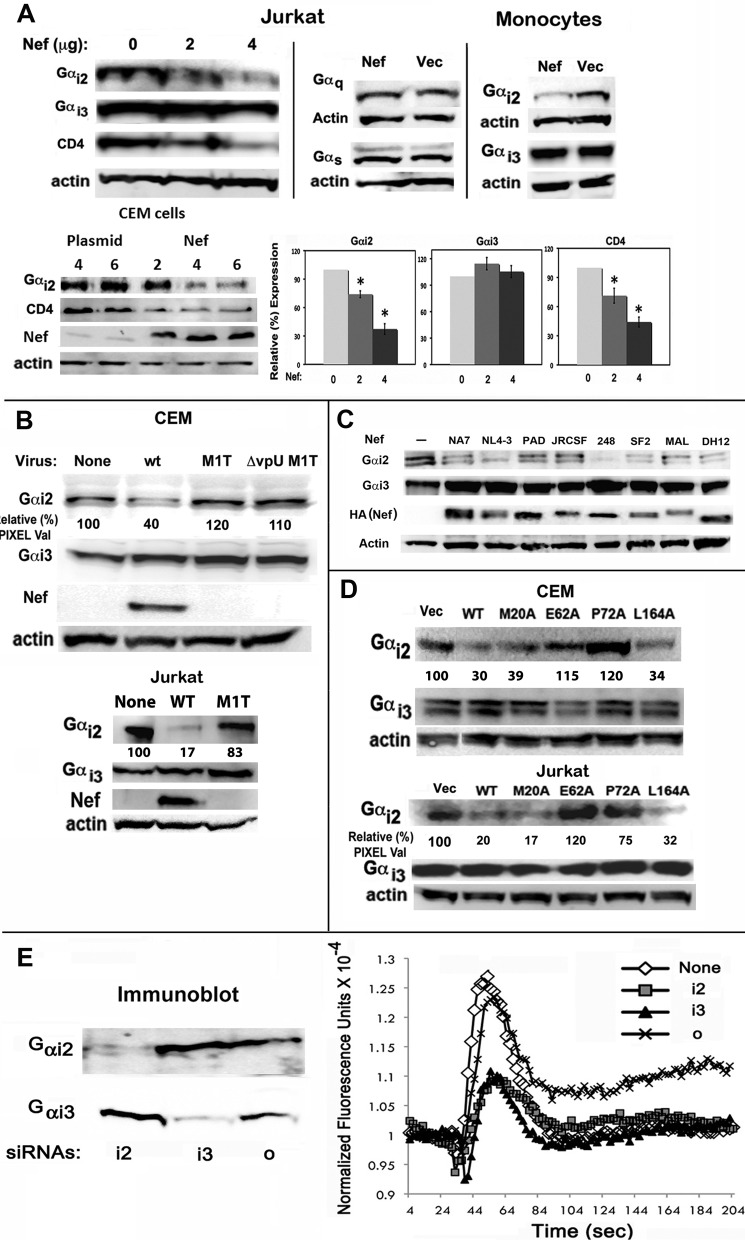
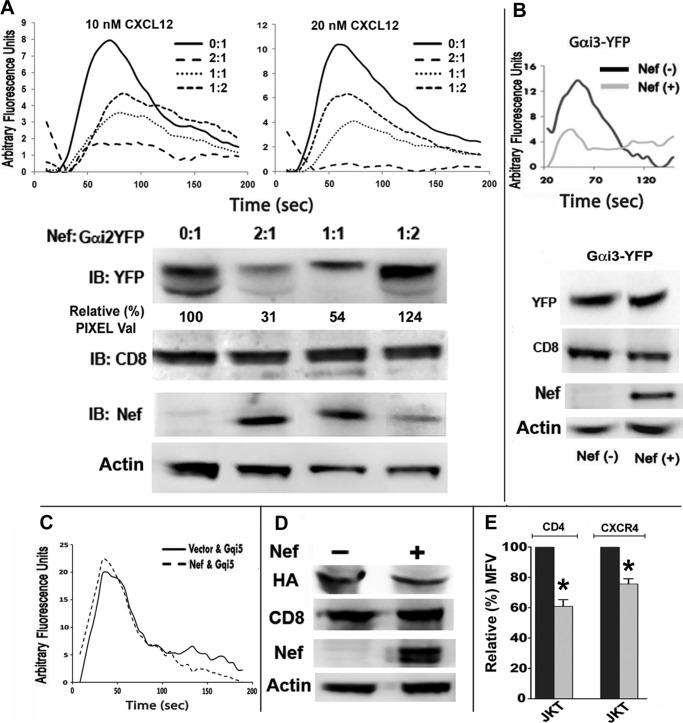
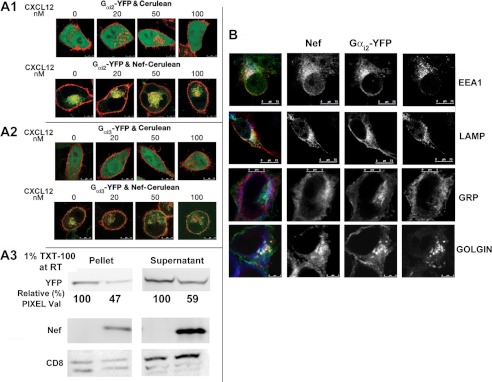
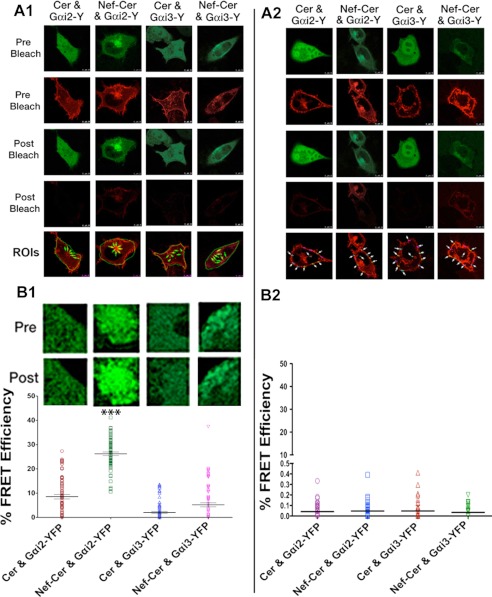
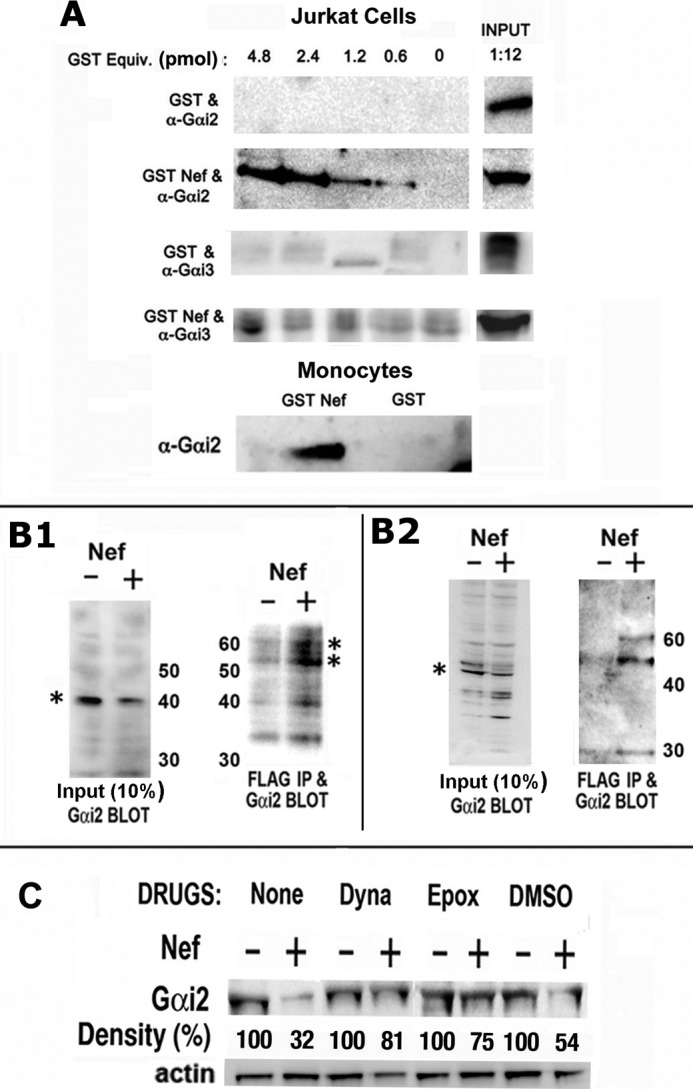
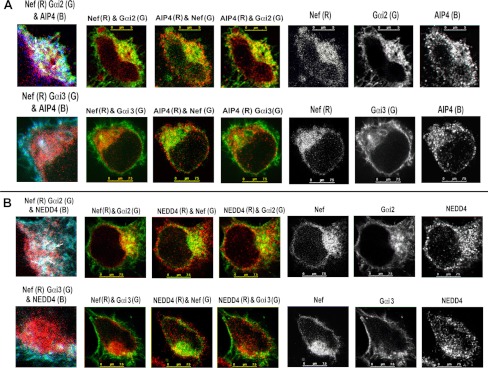
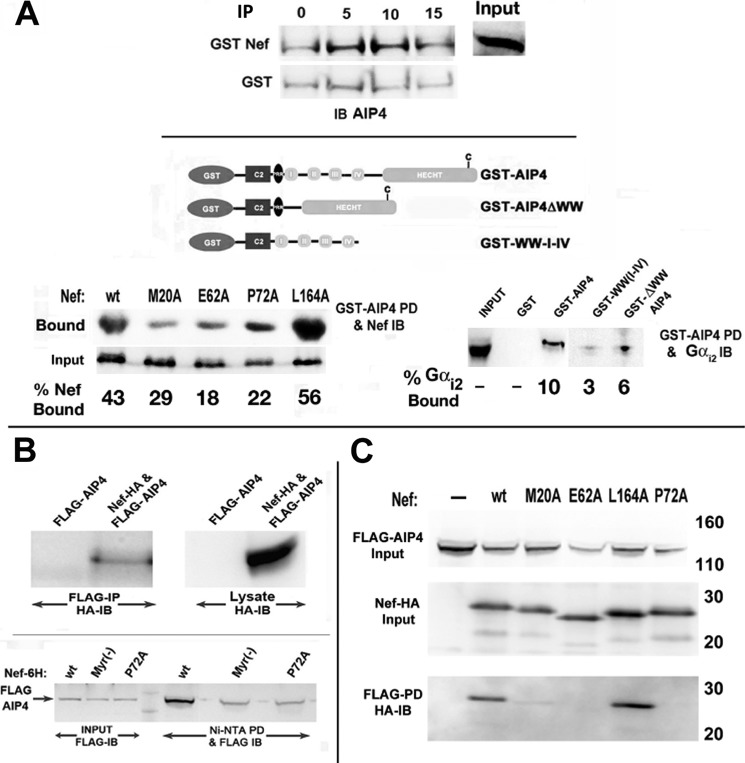
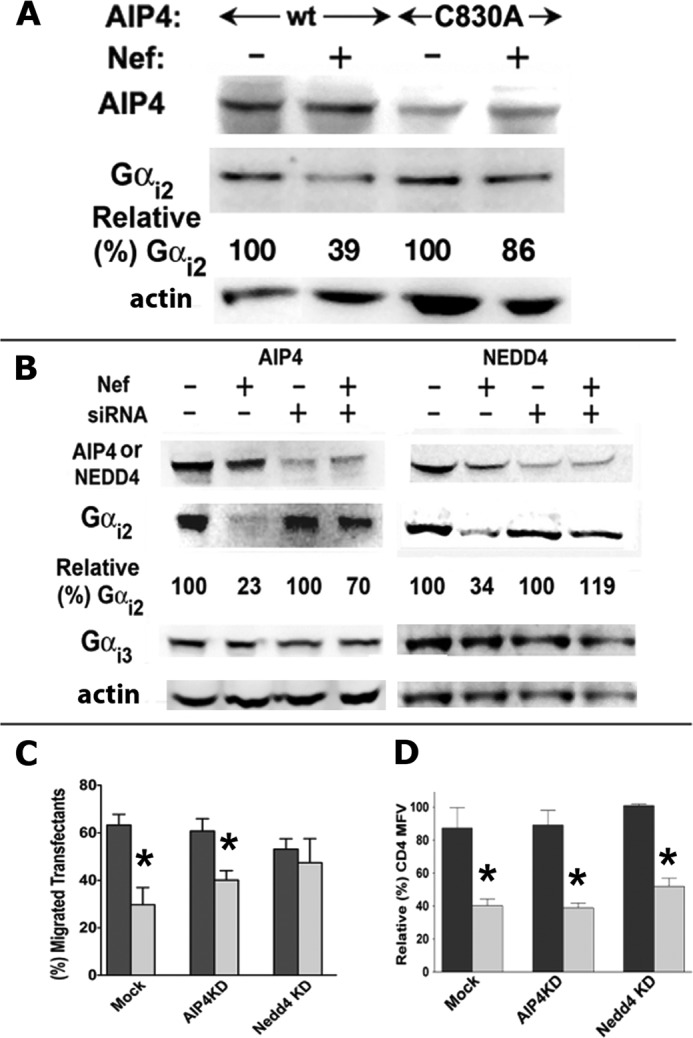
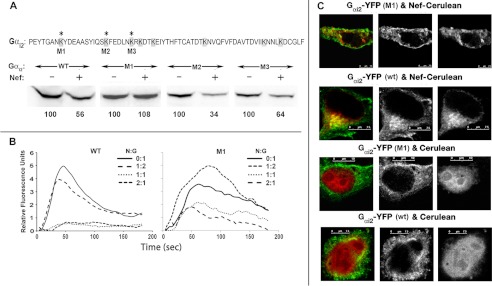
The HIV Nef protein is an important pathogenic factor that modulates cell surface receptor trafficking and impairs cell motility, presumably by interfering at multiple steps with chemotactic receptor signaling. Here, we report that a dominant effect of Nef is to trigger AIP4 E3 ligase-mediated Gα(i2) ubiquitination, which leads to Gα(i2) endolysosomal sequestration and destruction. The loss of the Gα(i2) subunit was demonstrable in many cell types in the context of gene transfection, HIV infection, or Nef protein transduction. Nef directly interacts with Gα(i2) and ternary complexes containing AIP4, Nef, and Gα(i2) form. A substantial reversal of Gα(i2) loss and a partial recovery of impaired chemotaxis occurred following siRNA knockdown of AIP4 or NEDD4 or by inhibiting dynamin. The N-terminal myristoyl group, (62)EEEE(65) motif, and (72)PXXP(75) motif of Nef are critical for this effect to occur. Nef expression does not affect a Gq(i5) chimera where the five C-terminal residues of Gq are replaced with those of Gα(i2). Lysine at position 296 of Gα(i2) was identified as the critical determinant of Nef-induced degradation. By specifically degrading Gα(i2), Nef directly subverts leukocyte migration and homing. Impaired trafficking and homing of HIV Nef-expressing lymphocytes probably contributes to early immune dysfunction following HIV infection.


Figures

FIGURE 1.
FIGURE 1.
Nef inhibits migration of Jurkat T cells (A1–A4), fresh PBMCs (B), and monocytes (C) toward CXCL12 in a transwell assay and F-actin accumulation in response to CXCL12 or CCL2 (D). Relative (%) chemotaxis of Jurkat cells expressing different Nef alleles (and gated for GFP co-expression) at the optimal peak levels of CXCL12 for cells is illustrated by the histogram (mean with S.E., n = 3; *, p < 0.01) in A1, and a representative CXCL12 dose-response profile of chemotaxis of Nef(−) or Nef(+) cells (n = 3) is illustrated in A2. Relative migration potential of Jurkat cells expressing GFP alone (Vec) or with WT NA7, M20A, P72A, E62A, or L164A mutant from Nef-GFP IRES vector toward CXCR4 is shown as a function of GFP expression in A3 (n = 3). *, p < 0.05; **, p < 0.01, when compared with plasmid-transfected cells. A4, relative (%) chemotaxis of Jurkat cells transfected with CD8 alone or with WT NA7 or NL4–3 Nef allele or M20A, P72A, E62A, or L164A NL4–3 Nef mutant. Chemotaxis data are shown for CD8(+) cells (n = 3). *, p < 0.01 compared with respect to null controls. B, the histogram on the left shows chemotaxis potential of single-cycle Nef(+) HIV-infected (CD24-positive) and uninfected (CD24-negative) CEM cells toward CXCL12. Relative (%) migration potential of CEM cells in WT infected (CD24+) and non-infected (CD24) population to different concentrations of CXCL12 was assessed by a transwell migration assay. The next histogram (with error bars (S.E.)) shows relative (%) chemotaxis toward CCL19 of PBMCs cotransfected with GFP and WT Nef, null mutant, or empty vector (n = 3, p < 0.02). CXCL12 dose response of chemotaxis (in absolute terms) for Nef(+) GFP(+) versus Nef(−) GFP(+) transfectants is illustrated on the right (n = 3). *, p < 0.05 compared with respective nanomolar concentration. C, histograms with S.E. (n = 3) show the chemotaxis potential toward CXCL12 or CCL2 (left) and formylmethionylleucylphenylalanine (right) of monocytes, transduced for 2 h with BSA or purified Nef fusion protein tagged C-terminally with the arginine-rich motif (RRM) of HIV-1 Tat followed by His6 residues (n = 3). *, p < 0.05. D, time course of F-actin accumulation in Jurkat cells or fresh PBMCs nucleofected with bicistronic (IRES) plasmids encoding WT or null (Nef Xho) Nef and GFP. Histograms (with S.E.) on the left illustrate the F-actin accumulation in GFP(+) versus GFP(−) gated Jurkat cells nucleofected with Nef-Xho-IRES-GFP (top) or Nef-IRES-GFP (bottom) (n = 3). *, p < 0.02. PBMCs nucleofected with Nef-IRES-GFP or NefXho-IRES-GFP were treated with 20 nm CXCL12 for 45 min. Relative (%) F-actin levels (phalloidin mean fluorescence value (MFV)) are plotted as a function of GFP (Nef or NefXho) expression (n = 3). Bars, S.E.; ***, p < 0.01. Alternatively, monocytes were nucleofected with GFP and Nef or an empty vector, and the time course of F-actin accumulation in response to 20 nm CXCL12 or CCL2 was monitored in GFP(−) versus GFP(+) cells (n = 3). ***, p < 0.05.
FIGURE 2.
FIGURE 2.
Nef markedly inhibited biochemical readouts of Gαi2 activation. Nef inhibits chemoattractant-mediated calcium flux in Jurkat cells (A1) and the U937 cell line (A2). Cells were co-transfected with CD8 and Nef, co-expressers were purified by CD8-positive selection (Stem Cell Technologies), and Nef effect in Jurkat cells was evaluated by measuring cell surface CD4 expression. The time course of CXCL12 (10 nm)-initiated calcium flux profiles was obtained using FlexStation III and the recommended assay. Results are representative of four experiments. Agonist (CXCL12 followed by CCL2) dose (10 or 100 nm)-response profiles of intracellular calcium flux in U937 transfectants were analyzed by fluorescence ratiometry in a PTI fluorimeter (33). B1, time course of CXCL12-initiated Ca2+ flux in HeLa cells expressing CerFP or Nef-CerFP (red) was monitored by video capture at 30 frames/s of Fluo-4 emission (green) up to 150 s after CXCL12 addition. The arrows denote CerFP or Nef-CerFP cells (expressed at ∼10–15% efficiency around 12–16 h post-transfection) to highlight their difference in Fluo-4 intensity. Fluorescent data were collected from ∼10 ROIs for each field, the calcium flux was measured in >5 fields for each condition in an experiment, and the experiments were repeated three times (n = 50–60). The change in the intensities was analyzed using the Leica software followed by graphing using EXCEL. Ca2+ flux profiles of a few (to avoid clutter) representative cells (ROIs) expressing CerFP (left) or Nef-CerFP (right) are shown in B2, with the ordinate showing relative intensity of Fluo-4 emission. CXCL12-initiated Ca2+ flux is profiled in purified CEM cells co-transfected with CD8 and WT, null, or other Nef mutants. CEM cells were transfected with CD8, WT, null, or the indicated Nef mutants, and CD8(+) cells were purified prior to measurement of Ca2+ flux (as described above) (B3). Nef expression enhanced cAMP levels under basal conditions or after Gαs activation by isoproterenol (C) or by forskolin stimulation of adenylyl cyclase (D). However, Nef did not further enhance the cAMP levels after isoproterenol treatment with transfectants overexpressing Gαi3 (E). Jurkat cells were cotransfected with CD8 and Nef or vector (for C–E) and with a Gαi3 expression plasmid (only for E). Transfected cells were purified by CD8 selection and assayed for cAMP production as described under “Experimental Procedures” (n = 4; error bars represent S.E.; *, p < 0.05).
FIGURE 3.
FIGURE 3.
Biochemical and genetic analysis of Nef induced loss of steady-state levels of Gαi2 subunit in Jurkat and CEM cell lines and primary human monocytes in the context of DNA transfection or single cycle HIV infection. A, cellular extracts were immunoblotted for Gαi2, Gαi3, Gαq, Gαs, CD4, or actin. Protein bands were scanned for pixel density, and results are plotted as histograms with error bars representing S.E. (n = 3; *, p < 0.03). B, loss of Gαi2 in single cycle infections of CEM/Jurkat cells with identical reverse transcriptase unit equivalents of VSV-G pseudotyped Nef+ (wt), but not Nef (M1T) or NefvpUvpU M1T) NL4-3 HIVs expressing murine CD4 antigen in place of vpR. Gαi2, Gαi3, and Nef were detected by immunoblotting cellular extracts. C, HIV-1 Nef alleles induced a specific loss of Gαi2 of comparable magnitude. Jurkat cells were transfected with various Nef alleles, and the levels of Gαi2 down-regulation were assessed. Cellular extracts were immunoblotted for Gαi2, Gαi3, HA (Nef), or actin. D, certain Nef mutants had lost the ability to induce loss of Gαi2. Extracts of CEM/Jurkat cells transfected with the indicated Nef derivatives were analyzed by SDS-PAGE followed by immunoblotting for actin, Gαi2, and Gαi3. Relative pixel values in B and C represent averages from two experiments for each case. E, knockdown of Gαi2 or Gαi2 by cognate siRNAs partially inhibited CXCL12-dependent calcium flux. Jurkat cells were co-transfected with CD8 and Nef or an empty vector following siRNA nucleofection and expression for 48 h. ∼2 × 10² transfectants were adjusted to reflect constant levels of CD8 and analyzed for CXCL12-initiated intracellular calcium flux. Gαi2 and Gαi2 in the respective siRNA transfectants were detected by immunoblotting as described above.
FIGURE 4.
FIGURE 4.
Nef-induced inhibition of G-protein signaling and Gαi2 degradation were partially rectified by overexpression of recombinant Gαi2, and a Gqi5 chimera replacing the C-terminal five residues with those of GαI was resistant to Nef effect. CEM cells were nucleofected with CD8 and YFP-tagged Gαi2 (A) or Gαi3 (B) subunits with or without a molar excess of Nef. Purified CD8 transfectants were analyzed for CXCL12-driven intracellular Ca2+ flux. Nef-induced loss of Ca2+ flux in response to CXCL12 was partially reversed in cells expressing a 2-fold molar excess of Gαi2 over Nef (A), but Gαi3 co-expression did not ameliorate Ca2+ flux deficit (B). At a 2-fold molar excess of Gαi2 over Nef, there was much less relative loss in the steady-state levels of Gαi2-YFP (A, bottom). There was no loss of Gαi3-YFP with or without of Nef (B, bottom). Relative Gαi2-YFP pixel values shown in the immunoblot are averages from three experiments. C, Nef did not inhibit CXCL12-initiated calcium flux in cells expressing Gqi5 chimera replacing the C-terminal five residues with those of Gαi2, (36). Jurkat transfectants co-expressing CD8 and Gqi5 chimera with or without Nef were purified and analyzed as described above. D, Nef did not alter the stability of co-expressed Gqi5 chimera. Cell extracts of Jurkat transfectants were analyzed for expression of HA-tagged Gqi5, co-expressed CD8, Nef, and actin. E, Gqi5 expression did not alter Nef-induced down-regulation of CD4 or CXCR4 at the PM. Black and gray histograms (with error bars (S.E.)) represent normalized data for CD8(−) and CD8(+) gated cells (n = 3; *, p < 0.05). IB, immunoblot.
FIGURE 5.
FIGURE 5.
Nef co-localized with and promoted endolysosomal sequestration of Gαi2 but not Gαi3. HeLa cells in coverglass chambers were co-transfected with YFP-tagged Gαi2 (A1) or Gαi3 (A2) with CerFP or Nef-CerFP (top or bottom row in A1 and A2) and treated for 10 min at 37 °C with increasing concentrations of CXCL12 or not before processing for live microscopy. Cerulean is green, and YFP is red. A3, Nef-induced loss of YFP-tagged Gαi2 occurred irrespective of whether or not the G-protein was membrane-associated. Cells were extracted in a buffer containing 1% (w/v) Triton X-100 (TXT-100) at 25 °C (room temperature (RT)), conditions that are known to strip most if not all membrane-associated proteins. Membrane (pellet) and cytoplasmic (supernatant) extracts were resolved by SDS-PAGE followed by immunoblot detection of YFP, Nef, and CD8. Relative Gαi2-YFP pixel values are averages from three experiments. B, in Nef-expressing cells, YFP-tagged Gαi2 (red) co-localized with Nef-CerFP (green) and endolysosomal markers, EEA1 and LAMP (blue) proteins, but not with markers (blue) for ER (GRP) or Golgi (GOLGIN).
FIGURE 6.
FIGURE 6.
Nef associated with Gαi2 but not Gαi3in vivo. Acceptor photobleaching FRET assay of HeLa cells co-expressing CerFP or Nef-CerFP with YFP-tagged Gαi2 or Gαi3. FRET assay was limited to Gαi2 or Gαi3 with CerFP or Nef-CerFP in the perinuclear area (A1) or at the PM (A2). Photomicrographs are representative of 10 fields (cells). Fluorescence intensities of 10 ROIs (arrows) corresponding to Gαi2 or Gαi3 in the perinuclear regions (B1) or at the PM (B2) in each cell were examined before (Pre) and after (Post) photobleaching, and calculated FRET efficiencies for all ROIs (∼100) from three independent experiments are shown as scatter plots with error bars. Donor emission of representative ROIs pre- and postphotobleaching is shown in the inset above the graph. The calculated statistical significance is represented (*, p < 01).
FIGURE 7.
FIGURE 7.
Nef interacted with Gαi2in vitro and induced Gαi2 ubiquitination. A, varying amounts of purified GST or GST Nef were incubated with cellular extracts of Jurkat cells or human monocytes. Bound proteins were resolved by SDS-PAGE, and Gαi species were detected by immunoblotting. B, Nef-induced ubiquitination of native Gαi2 in Nef-expressing CEM cells. CEM cells were co-transfected with FLAG-tagged ubiquitin and Nef or null plasmid. Cellular extracts were directly immunoblotted for Gαi2 (B1 and B2, left panels) or immunoprecipitated first with anti-FLAG polyclonal antibody (B1) or mAb (B2) followed by immunoblotting for Gαi2. Asterisks denote Gαi2 (left) and mono- and diubiquitinated Gαi2 (right). Numbers (kDa) refer to molecular mass markers. Data are representative of three experiments. C, Nef-mediated Gαi2 breakdown was partially rectified by Dynasore, a small molecular weight inhibitor of dynamin, or the proteosome inhibitor epoxomycin. Cellular extracts were analyzed by immunoblotting for Gαi2. Gαi2 bands are shown pairwise for Nef(+) versus Nef(−) for each treatment with relative (%) density (average values from three experiments) denoted below.
FIGURE 8.
FIGURE 8.
Nef recruits HECT domain E3 ligases, AIP4, or NEDD4 and facilitates Gαi2 ubiquitination, presumably as a ternary complex. A, Nef co-localized with Gαi2 but not with Gαi3 in the AIP4-enriched perinuclear region. HeLa cells co-transfected with Nef-CerFP and YFP-tagged Gαi2 or Gαi3 were fixed, permeabilized, and stained with murine mAb against AIP4 followed by Alexa 647-conjugated anti-mouse IgG. B, Nef co-localizes with Gαi2 but not Gαi3 in NEDD4-positive regions in HeLa cells. Experimental details are as above except for the use of rabbit polyclonal antibody against NEDD4. Monochromatic images on the right in each row correspond to Nef-CerFP, YFP-tagged Gαi2 or Gαi3, and anti-AIP4 or -NEDD4 fluorescence with two-channel (like AIP4/NEDD4 and Gαi2 or AIP4/NEDD4 and Nef, etc.) composite images shown on the left. 4× cropped RGB images (Nef-CerFP (R), Gαi2- or Gαi3-YFP (G), and AIP4/NEDD4 (B)) with arrows denoting vesicles showing maximal co-localization are shown on the far left in each row.
FIGURE 9.
FIGURE 9.
Biochemical and genetic analysis of Nef interaction in vivo with Gαi2 and E3 ligases. A, Nef and Gαi2 interacted with AIP4 in vitro. Shown is a schematic illustration (top) of GST-tagged WT AIP4 and mutants deleted for the WW or HECT domains (44). Jurkat cells were transfected with WT, M20A, E62A, P72A, or L164A Nef mutant, and cellular extracts were incubated with ∼22 pmol of GST or GST-AIP4 immobilized on agarose beads. GST-bound fractions and unselected lysate (2%) were analyzed for Nef by immunoblotting (left). Cellular extracts of Jurkat cells were reacted with equimolar amounts (∼22 pm) of GST-AIP4, GST-AIP4 ΔWW, GST-WW-I-IV, or GST alone. Bound fractions were analyzed by immunoblotting with anti-Gαi2 mAb (right). Input, an aliquot of extract immunoblotted without selection. Numbers in both cases refer to bound fraction (%) averaged from two experiments. B, in vivo interaction of Nef with AIP4. Extracts of Jurkat cells cotransfected with FLAG-AIP4 and HA-tagged Nef or empty HA vector and immunoprecipitated with FLAG-mAb and Nef were identified by immunoblotting with rabbit anti-HA (top). Relative binding affinity of Nef mutants for AIP4 was evaluated in Jurkat cells cotransfected with GFP, FLAG-AIP4, and His6-tagged WT or mutant Nef (bottom). Cellular extracts were bound to Ni2+-nitrilotriacetic acid beads, and the bound FLAG-AIP4 was detected by immunoblotting with anti-FLAG mAb. C, alternatively, Jurkat cells were cotransfected with GFP, FLAG-AIP4, and HA-tagged WT or mutant Nef. Extracts were immunoprecipitated with FLAG mAb, followed by immunoblotting with HA antibody. Data represent results from three experiments.
FIGURE 10.
FIGURE 10.
Nef-induced loss of Gαi2 was partially reversed by enzymatically defective AIP4 or by siRNA knockdown of AIP4 or NEDD4. A, the HECT domain mutant of AIP4 (C830A) reversed Nef-induced degradation of Gαi2. Jurkat cells were nucleofected with CD8, FLAG-tagged WT, or C830A AIP4 mutant and HA-tagged Nef or empty HA vector. Extracts from cells adjusted for equivalent CD8 expression were analyzed by immunoblotting using mAb against Gαi2 and anti-FLAG antibody for detecting AIP4. Numbers refer to relative (%) Gαi2 amounts for the respective transfectants adjusted for equivalent CD8 expression. B, Nef-induced loss of Gαi2 was partially reversed by siRNA knockdown of AIP4 or NEDD4. Transfected Jurkat cells were disrupted in 0.5 ml of lysis buffer, and extracts were resolved by SDS-PAGE followed by immunoblotting for actin, NEDD4, AIP4, Gαi2, or Gαi3. Numbers denote relative (%) pixel densities of Gαi2 averaged from three experiments. C, siRNA knockdown of AIP4 or NEDD4 partially reversed Nef-induced inhibition of chemotaxis toward CXCL12. After a 48-h treatment with the respective siRNAs, Jurkat cells were cotransfected with GFP and Nef(−) or Nef(+) plasmid. Cells were evaluated for chemotaxis toward 20 nm CXCL12. Histograms represent pairwise comparison of relative (%) chemotaxis efficiency of GFP(+) Nef(−) versus Nef(+) (n = 3). D, siRNA knockdown of AIP4 or NEDD4 did not interfere with Nef-mediated CD4 down-regulation. Jurkat cell transfectants were analyzed for CD4 expression by flow cytometry. Relative (%) CD4 mean fluorescence values for Nef(+) and Nef(−) transfectants are plotted pairwise for each condition as histograms (with error bars). The mean fluorescence value for Nef(−) cells in each case was arbitrarily assigned as 100 (n = 3); *, p < 0.05 when compared with their respective plasmid (mock)-transfected controls.
FIGURE 11.
FIGURE 11.
Lysine at position 296 of Gαi2 is the critical determinant of Nef-induced degradation. A, the C-terminal 66 residues of Gαi2 are shown at the top, with all lysines shaded and the three lysines unique to Gαi2 denoted by asterisks. M1–M3, the respective lysine to arginine mutations engineered into the YFP-tagged Gαi2. CEM cells were transfected with CD8, WT, or the indicated Gαi2 mutant and HA-tagged Nef or empty HA vector. Extracts of transfected cells were adjusted for equivalent CD8 expression and analyzed by immunoblotting using mAb against YFP for detecting Gαi2. Numbers at the bottom are relative (%) pixel densities of Gαi2 averaged from two experiments. B, M1 mutant is more efficient than the WT Gαi2-YFP in rectifying Nef-induced G-protein signaling (by intracellular Ca2+ flux) defect. CEM cells were nucleofected with CD8, and YFP-tagged WT or M1 Gαi2 CD8 transfectants were analyzed for CXCL12-driven intracellular Ca2+ flux as described in the legend to Fig. 3. C, YFP-tagged WT, but not the M1 Gαi2, was internalized and co-localized with Nef-enriched vesicular structures. HeLa cells in coverglass chambers were co-transfected with YFP-tagged WT or M1 Gαi2 mutant with Nef-CerFP or CerFP and processed for live microscopy. Cerulean is green, and YFP is red.

Similar articles

Cited by

References

    1. Rossi D., Zlotnik A. (2000) The biology of chemokines and their receptors. Annu. Rev. Immunol. 18, 217–242 - PubMed
    1. Wurbel M. A. (2000) The chemokine TECK is expressed by thymic and intestinal epithelial cells and attracts double- and single-positive thymocytes expressing the TECK receptor CCR9. Eur. J. Immunol. 30, 262–271 - PubMed
    1. Kwan J., Killeen N. (2004) CCR7 directs the migration of thymocytes into the thymic medulla. J. Immunol. 172, 3999–4007 - PubMed
    1. Trampont P. C., Tosello-Trampont A.-C., Shen Y., Duley A. K., Sutherland A. E., Bender T. P., Littman D. R., Ravichandran K. S. (2010) CXCR4 acts as a costimulator during thymic β-selection. Nat. Immunol. 11, 162–170 - PMC - PubMed
    1. Bromley S. K., Thomas S. Y., Luster A. D. (2005) Chemokine receptor CCR7 guides T cell exit from peripheral tissues and entry into afferent lymphatics. Nat. Immunol. 6, 895–901 - PubMed

Publication types

MeSH terms

Substances