. 2012 Dec 7;287(50):42407-16.
doi: 10.1074/jbc.M112.414854. Epub 2012 Oct 15.

αA-crystallin and αB-crystallin reside in separate subcellular compartments in the developing ocular lens

Affiliations

αA-crystallin and αB-crystallin reside in separate subcellular compartments in the developing ocular lens

Rajendra K Gangalum et al. J Biol Chem. .

Abstract

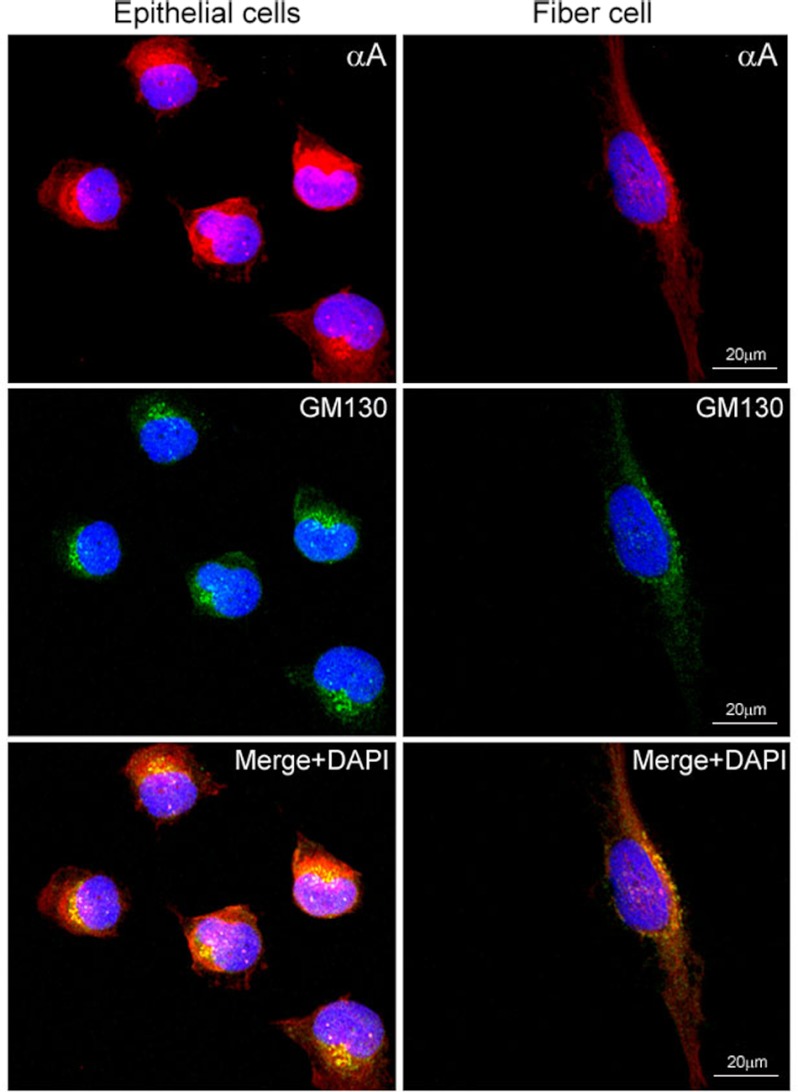
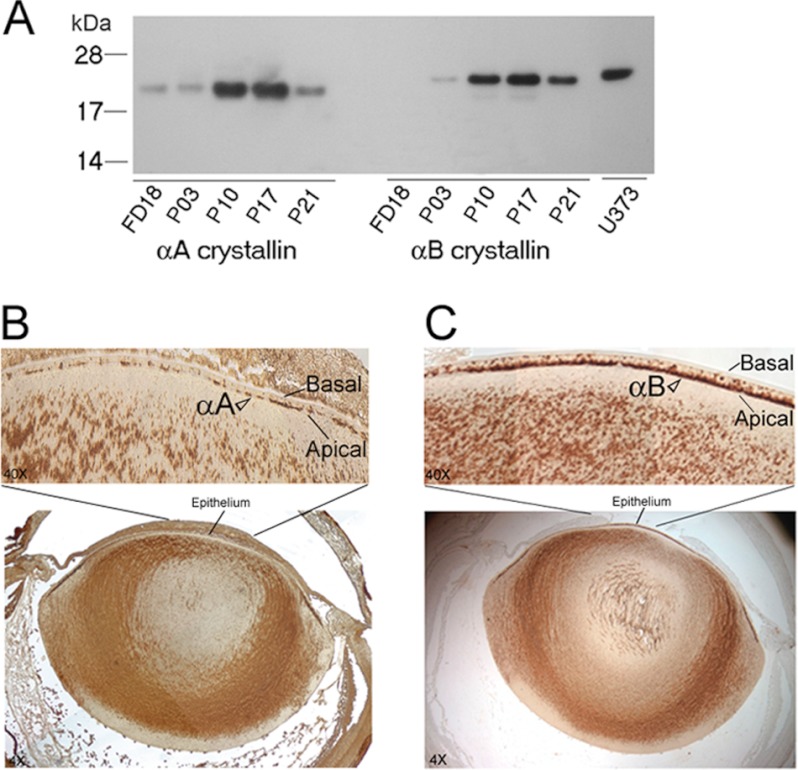
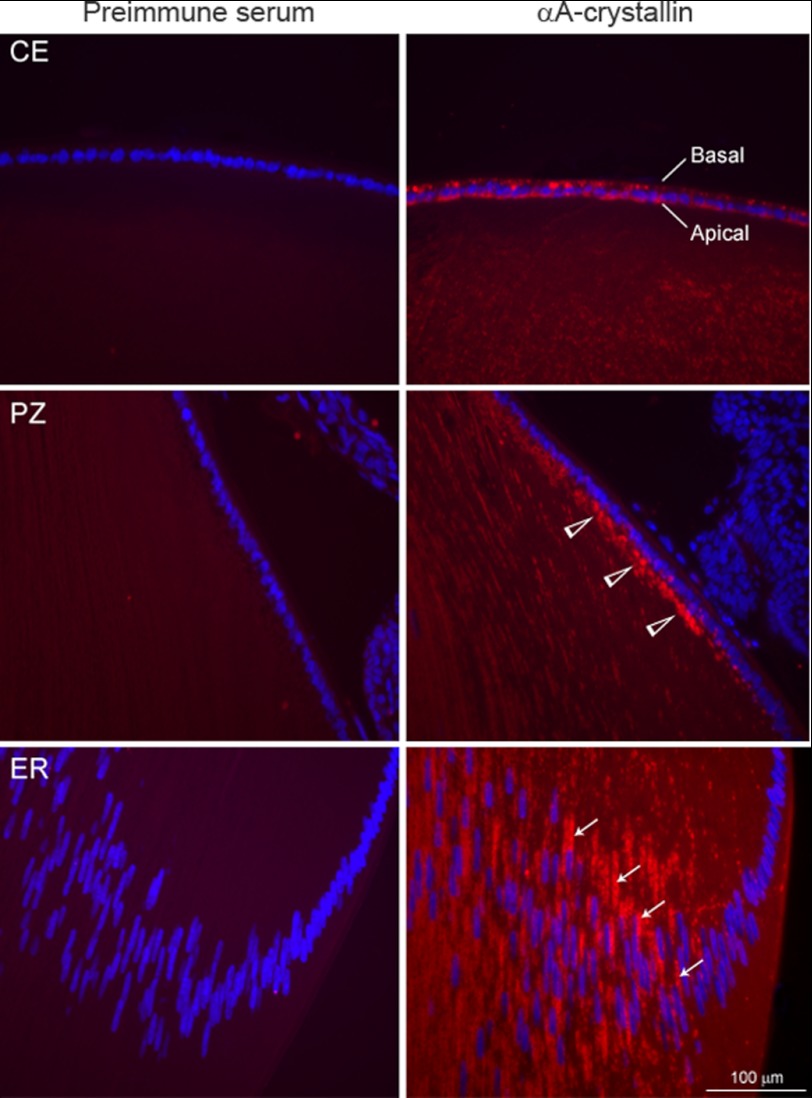
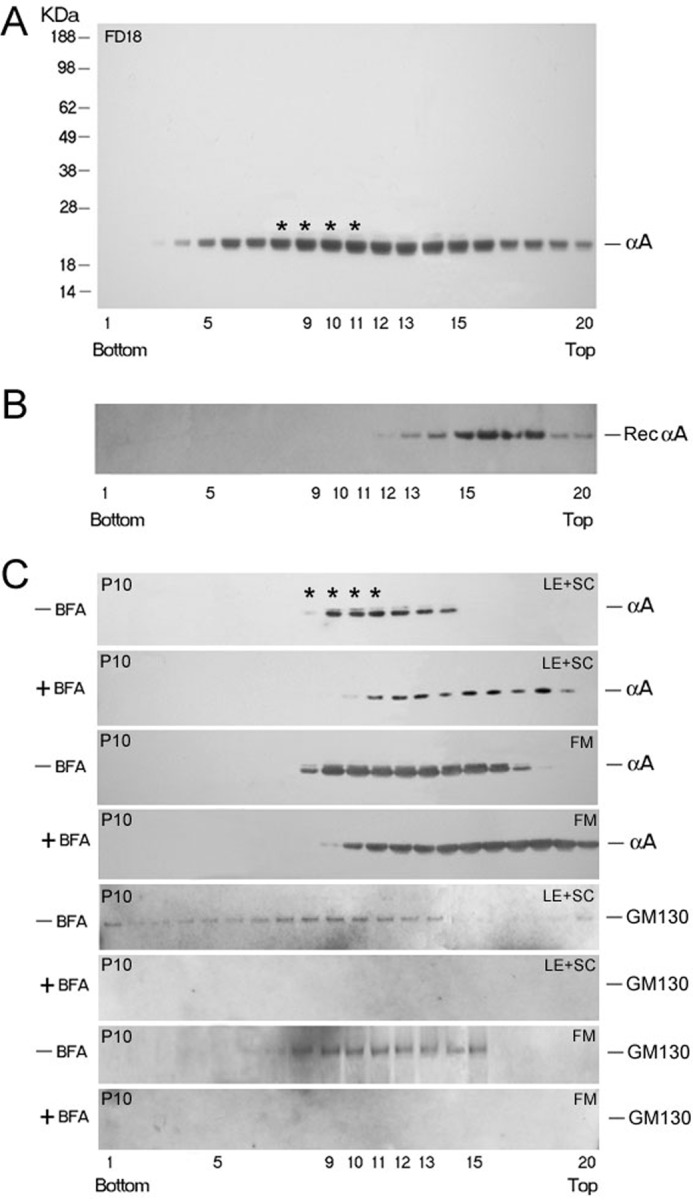
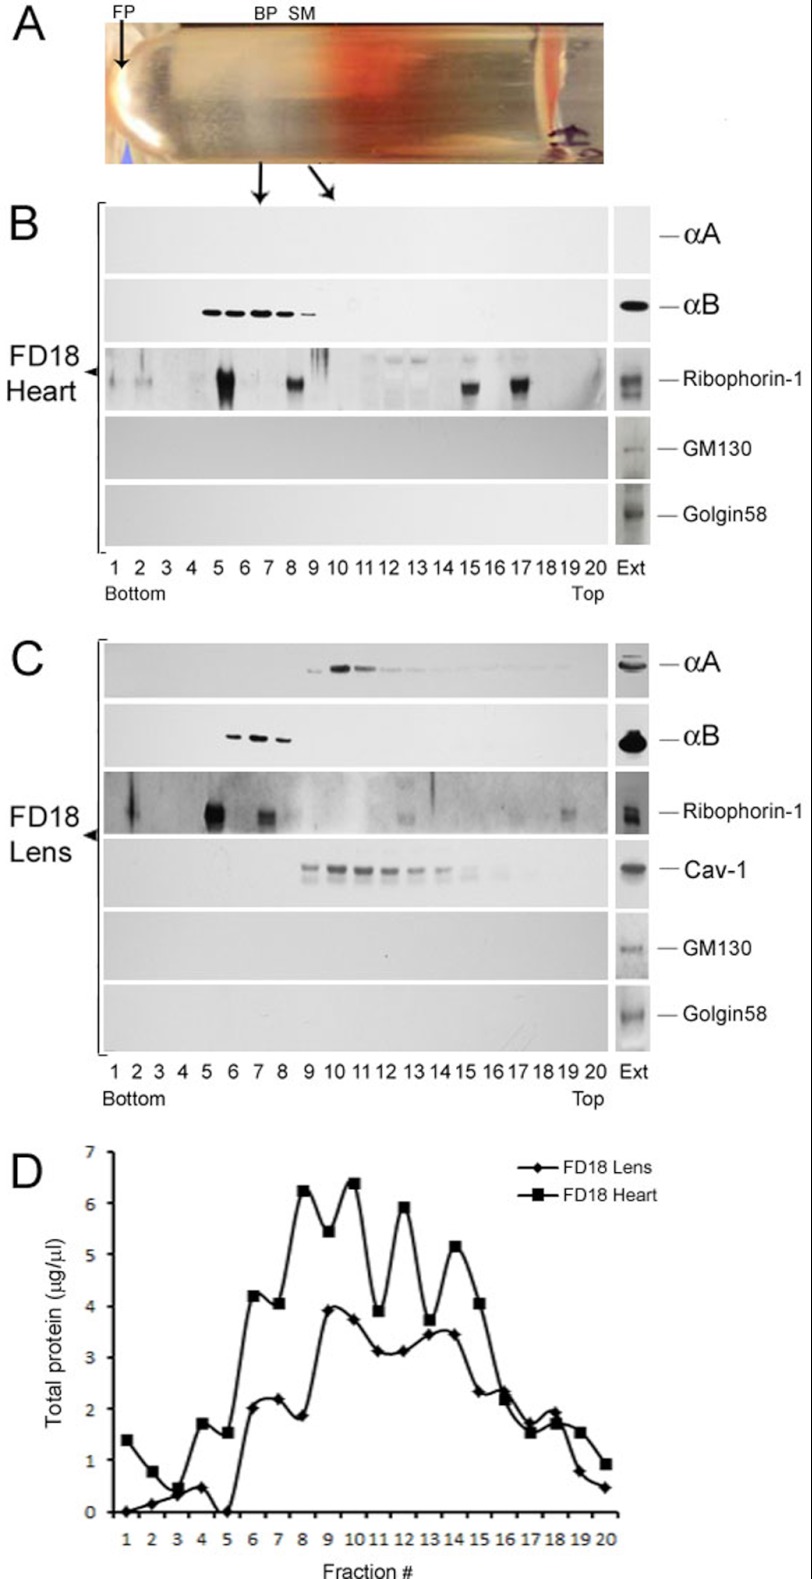
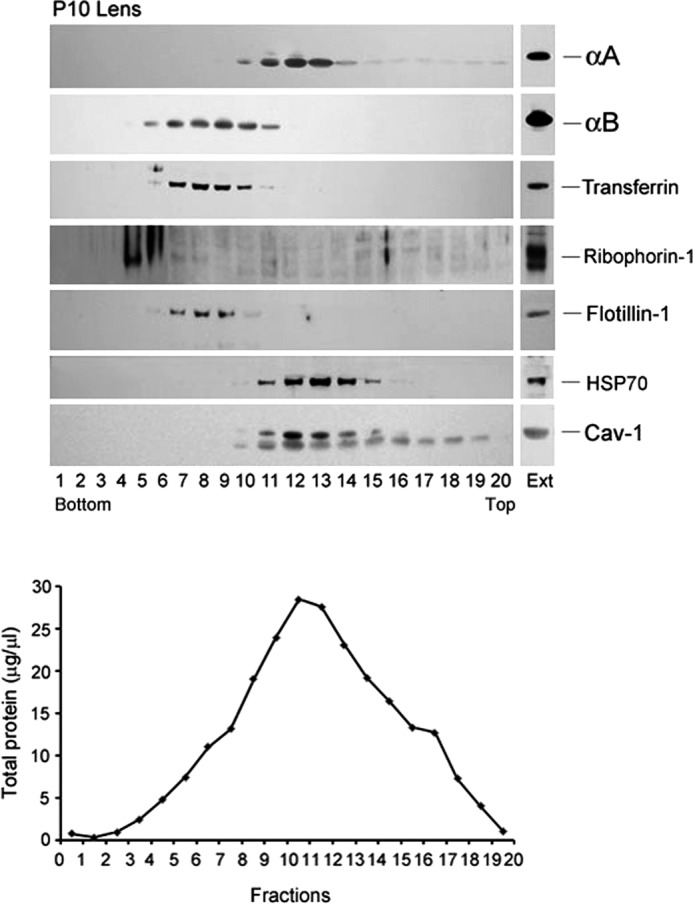
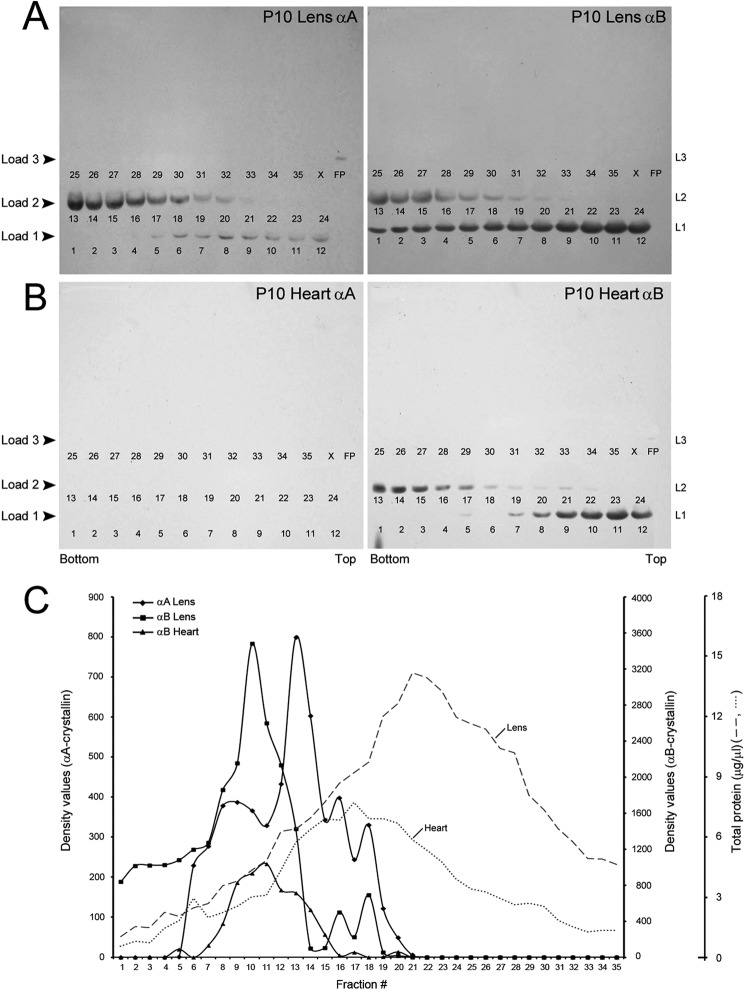
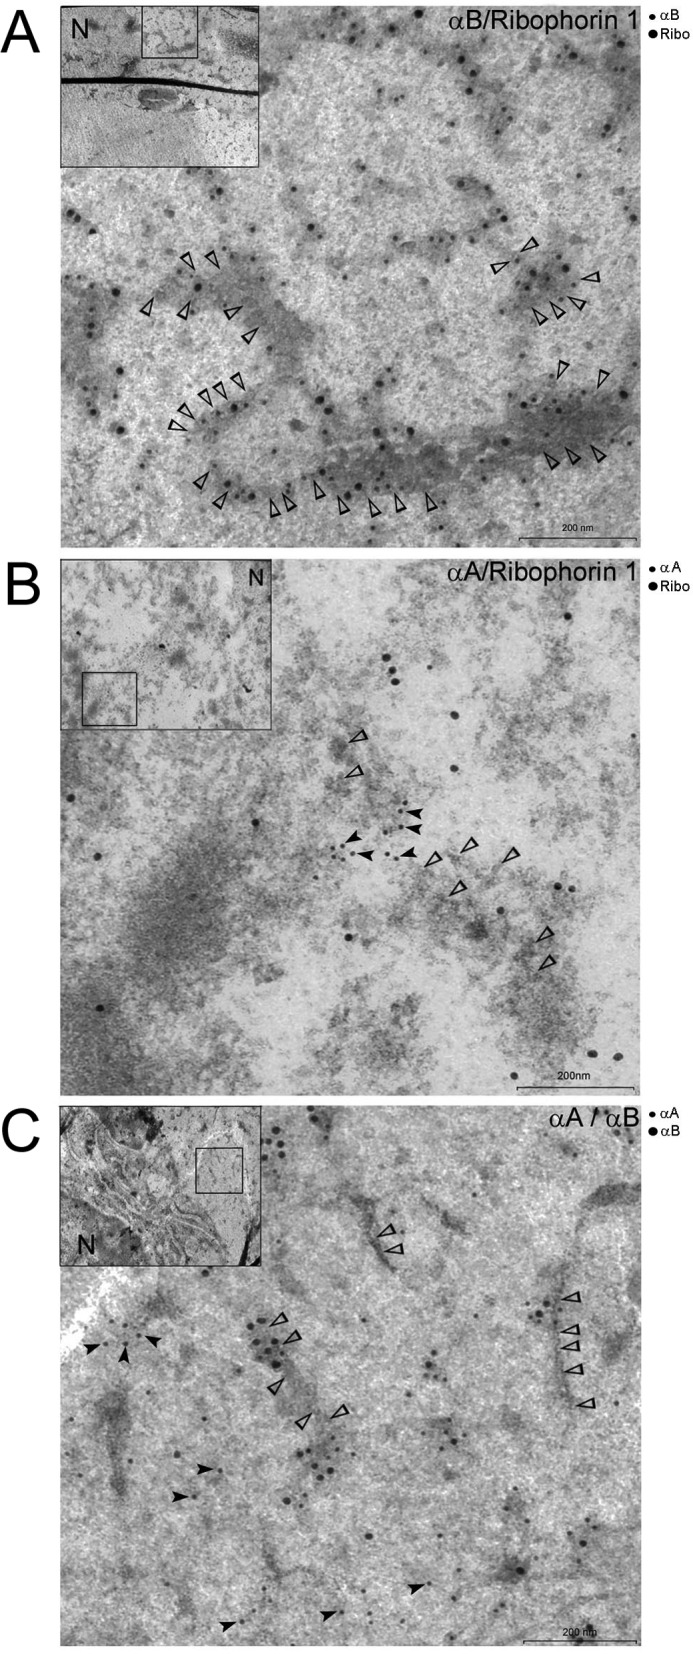
αA-Crystallin (αA) and αB-crystallin (αB), the two prominent members of the small heat shock family of proteins are considered to be two subunits of one multimeric protein, α-crystallin, within the ocular lens. Outside of the ocular lens, however, αA and αB are known to be two independent proteins, with mutually exclusive expression in many tissues. This dichotomous view is buoyed by the high expression of αA and αB in the lens and their co-fractionation from lens extracts as one multimeric entity, α-crystallin. To understand the biological function(s) of each of these two proteins, it is important to investigate the biological basis of this perceived dichotomy; in this report, we address the question whether αA and αB exist as independent proteins in the ocular lens. Discontinuous sucrose density gradient fractionation and immunoconfocal localization reveal that in early developing rat lens αA is a membrane-associated small heat shock protein similar to αB but with remarkable differences. Employing an established protocol, we demonstrate that αB predominantly sediments with rough endoplasmic reticulum, whereas αA fractionates with smooth membranes. These biochemical observations were corroborated with immunogold labeling and transmission electron microscopy. Importantly, in the rat heart also, which does not contain αA, αB fractionates with rough endoplasmic reticulum, suggesting that αA has no influence on the distribution of αB. These data demonstrate presence of αA and αB in two separate subcellular membrane compartments, pointing to their independent existence in the developing ocular lens.


Figures

FIGURE 1.
FIGURE 1.
Confocal images of αA localization in primary cultures of rat lens epithelial explants. The P10 rat lens epithelial explants in culture invariably contain nascent (differentiating) fiber cells (14). Perinuclear colocalization of αA (anti-αA, red, top panel) and GM130 (anti-mouse GM130; FITC, green, middle panel) is observed in lens epithelial cells (left column) as well as in the differentiating fiber cell (right column). The αA label (red) is predominantly outside of the Golgi (compare the colocalized yellow granules with the red stain in the bottom panel). Note the granular appearance of the colocalized proteins (bottom panel, yellow, Merge + DAPI) and as yet unrecognized presence of αA (red streaks), prominent in the nucleus in the fiber cell (right bottom panel). Nuclei are stained with DAPI (blue). Scale bar, 20 μm.
FIGURE 2.
FIGURE 2.
Developmental expression and immunohistochemistry of αA and αB in the native ocular lens. A, immunoblot showing temporal expression pattern of αA and αB during lens development in the rat. Total protein extracts (0.2 μg/lane) from fetal day 18 (FD18) and postnatal days (P3, P10, P17, P21) were analyzed on two immunoblots. αA is expressed early in the FD18 rat lens, when there is no detectable αB. Human glioblastoma cell U373 MG total cell extract (20 μg), which only expresses αB, is shown in the last lane. Protein standards (kDa) are shown on the left. B and C, immunohistochemistry of αA and αB localization, respectively. Immunoperoxidase-diaminobenzidine-stained 4× image of the whole ocular lens is shown in the bottom panels and the central epithelium of this image is magnified (40×) and shown in the upper panels. Note that αA is apical in its location, which suggest its association with the apical Golgi, but there are discontinuities in its staining. The data shown in C confirm previously reported (14) colocalization of αB in the apical Golgi. Note definitive αB staining (C) in the apical epithelium in comparison with anti-αA staining in B (open arrowheads).
FIGURE 3.
FIGURE 3.
Immunofluorescence of the native P10 lens with anti-αA. Different regions of the lens are shown. Central epithelium (CE) is shown in the top panel. Immunofluorescence (red) is seen in the cytoplasm of the lens epithelium without specific definition of immunofluorescence in the apical regions of the epithelium. The difference between immunoperoxidase staining (Fig. 2B) and immunofluorescence shown here may be because of the differential sensitivity of the two techniques, suggesting that there is αA in these cells that is not associated with the apical Golgi. In the proliferative zone (PZ, middle panel); however, the label is predominantly apical (open arrowheads). In the equatorial region (ER, bottom panel), streaks of αA are seen along the elongated nuclei (perinuclear location, thin arrows) in the differentiated fiber cells. The left column shows respective pre-immune controls. Nuclei are stained with DAPI (blue). Scale bar = 100 μm.
FIGURE 4.
FIGURE 4.
Discontinuous sucrose density gradient fractionation for analyses of Golgi-enriched membranes. A, distribution of αA (as detected by immunoblotting) in the gradient run with post-nuclear homogenate of whole FD18 rat lens (5.36 mg total protein). αA is distributed broadly, from the bottom (fraction 3) all through to the top of the gradient. Asterisks indicate the position of the Golgi enriched membrane fraction as determined by Golgi intrinsic membrane protein GM130 location (14, 15). The presence of αA in fractions 3–5, close to bottom (1.3 m sucrose) and in fractions 5–12 suggest that αA is associated with heterogeneous membrane components. B, purified recombinant αA (50 μg) was run in a separate gradient under similar conditions (Rec αA panel) as a control. C, sucrose gradient fractionation of post nuclear homogenates made from dissected lens epithelium + superficial cortex (LE+SC) and FM of P10 rat lenses. Lenses were incubated with +BFA for 90 min before fractionation. Note that αA associated with the Golgi in fractions 8–11 is susceptible to BFA treatment. The pattern shifts toward the top of the gradient (C, +BFA panels) because of the disorganization of the Golgi. Note that we could not detect any GM130 reactivity in the lens epithelium + superficial cortex (LE+SC) and FM in + BFA panels (bottom panel and third panel from bottom).
FIGURE 5.
FIGURE 5.
Fractionation of smooth membranes and rough ER in FD18 rat lens and heart. A, picture (shown horizontally) of the fractionated gradient obtained with post mitochondrial supernatant of FD18 heart. The arrows indicate the positions of the bound polysomes (BP, also known as rough ER), the SM and free polysomes (FP). B, immunoblots of the gradient shown in A with anti-αA, anti-αB, anti-Ribophorin-1, anti-GM130, and anti-Golgin 58. Equal volumes (2.5 μl) from each fraction were used for immunoblotting. Note the absence of αA reactivity because there is no αA expressed in the heart (top panel). αB is seen in fractions 5–9 as is Ribophorin-1, which seems to associate with two discrete fractions of the bound polysomes (rough ER). It is also detected in the top half of the gradient in fractions 15 and 17). C, fractionation of FD18 lens post-mitochondrial supernatants. Note that αA (fractions 9–15) fractionates away from αB (fractions 6–8). Caveolin-1 (Cav-1) fractionates with SM in the same location where αA is seen. Note that Ribophorin-1 is mostly seen here with the RER. Transferrin, one more BP/RER marker, could not be detected in this gradient, although it is seen in P10 lens gradients (see Fig. 6). EXT, immune reactivities in aliquots of total cell extracts before fractionation. D, the distribution of total protein in FD18 lens and FD18 heart gradients. Note that the immune reactions seen for αA and αB do not correspond with this distribution pattern.
FIGURE 6.
FIGURE 6.
Fractionation of smooth membranes and rough ER from P10 rat lens. A similar gradient as in Fig. 5 was run. αA (top panel) fractionates with smooth membrane fractions 10–15 in which Caveolin-1 and HSP70 are detected (bottom two panels). αB is detected in fractions 5–11 (second panel) distinct from αA, in the rough ER, which is characterized by the presence of the marker Transferrin (third panel), Ribophorin-1 (in heavier polysomes, fourth panel), and Flotillin-1 (fifth panel). There is an overlap of αA and αB patterns in fractions 10 and 11. A light reaction for both αA as well as Caveolin-1 (Cav-1) is seen in the top fractions (15 onwards) in the gradient possibly because of the presence of high concentrations of αA in the ocular lens. EXT, immune reactivities in aliquots of total cell extracts before fractionation. The total protein in each fraction (μg/μl) is plotted in the lower panel. Note that there is no strict correspondence between immune reactions (particularly with αB) and the protein concentration profile.
FIGURE 7.
FIGURE 7.
αA and αB fractionate with smooth membranes and rough endoplasmic reticulum, respectively. Sucrose gradients similar to that shown in Fig. 6 were run with P10 heart and P10 lens post mitochondrial homogenates. Smaller volume fractions (35 fractions as opposed to 20 in Figs. 5 and 6) were collected from the bottom of the gradient. All 35 fractions were electrophoresed on a single SDS-PAGE gel and immunoblotted (see “Experimental Procedures”). We did this by multiple loadings into each well (thus each lane was loaded three times, 8–12 min apart); first, fractions 1–12, then 13–24, and finally 25–35 on the same gel. Four such gels were run (two from the heart and two from the lens) and immunoblotted. The numbers in each panel (1–35) represent the gradient fractions on each gel. These numbers are underneath the immunoreaction in each lane. Note that no reactions are seen in fractions 22–35 in all immunoblots. A, P10 lens immunoblots are shown (P10 lens αA and P10 lens αB). B, P10 heart immunoblots are shown (P10 heart αA and P10 heart αB). C, plots of the densitometer scans (arbitrary units) of the immunoblots obtained with anti-αA and anti-αB in the lens and in the heart shown in B. Dotted and dashed gray lines show total protein distribution in the heart and lens gradients. αB in the lens (panel P10 lens αB) and the heart (panel P10 heart αB) fractionates with rough ER. There is no αA in the heart (panel P10 heart αA), and therefore, there are no bands in this immunoblot. In the lens, αA fractionates with smooth membranes. X, blank lane; FP, free polysome pellet. L1, L2, and L3 refer to three loads (L1–L3, see “Experimental Procedures”).
FIGURE 8.
FIGURE 8.
Localization of αB and Ribophorin-1 in native lens fiber cells. Shown above are three representative transmission electron microscopy images of the data obtained with immunogold labeling of αA, αB, and Ribophorin-1 (Ribo) in rat lens fiber cell ultrathin sections. Two antibodies were used for generating each picture as indicated in the top righthand corner of each micrograph. A, localization of αB (12-nm gold) and Ribophorin-1 (18-nm gold). Note that both the proteins are associated with membrane decorated with ribosomes (open arrowheads). B, micrograph showing labeling with anti-αA (12-nm gold, black arrowheads) and anti-Ribophorin-1 (18 nm gold). Note that there are very few 18-nm particles (Ribophorin-1) in the vicinity of 12-nm particles (αA); open arrowheads point to membrane-bound ribosomes. The two proteins do not seem to localize within the same membrane domains. C, micrograph showing labeling with anti-αA (12-nm gold) and anti-αB (18 nm). Open arrowheads point to membrane-bound ribosomes. This micrograph is similar to localization of αA and Ribophorin-1 shown in B. The two proteins do not share the same membrane domains. Low magnification images (insets) are shown in the top left corner of each micrograph. The square box in the inset shows the area magnified. Similar electron micrographs acquired from different regions of fiber cells are presented in supplemental Fig. S2, A–D. Scale bar, 200 nm. N, nucleus. Preimmune serum controls are presented in supplemental Fig. S2D.

Similar articles

Cited by

References

    1. Andley U. P. (2007) Crystallins in the eye: Function and pathology. Prog. Retin. Eye Res. 26, 78–98 - PubMed
    1. Bhat S. P. (2003) Crystallins, genes, and cataract. Prog. Drug. Res. 60, 205–262 - PubMed
    1. Groenen P. J., Merck K. B., de Jong W. W., Bloemendal H. (1994) Structure and modifications of the junior chaperone α-crystallin. From lens transparency to molecular pathology. Eur. J. Biochem. 225, 1–19 - PubMed
    1. Horwitz J. (2000) The function of α-crystallin in vision. Semin. Cell Dev. Biol. 11, 53–60 - PubMed
    1. Bhat S. P., Nagineni C. N. (1989) αB subunit of lens-specific protein α-crystallin is present in other ocular and non-ocular tissues. Biochem. Biophys. Res. Commun. 158, 319–325 - PubMed

Publication types

MeSH terms

Substances

LinkOut - more resources