

Within-subject blood pressure level--not variability--predicts fatal and nonfatal outcomes in a general population
- PMID: 23071126
- PMCID: PMC3607229
- DOI: 10.1161/HYPERTENSIONAHA.112.202143
Within-subject blood pressure level--not variability--predicts fatal and nonfatal outcomes in a general population
Abstract
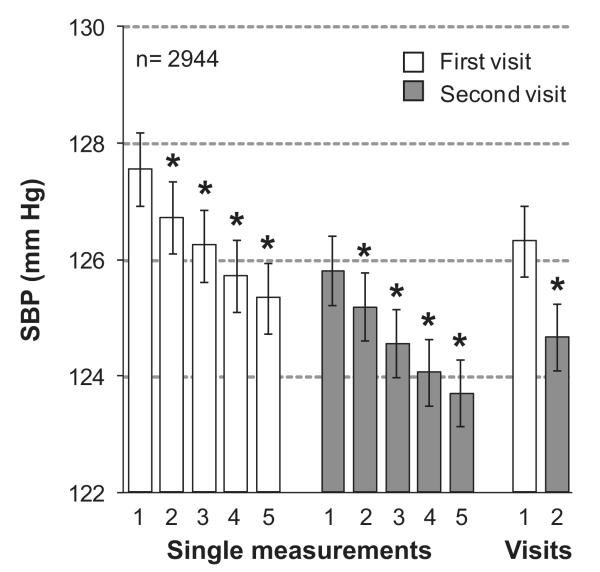
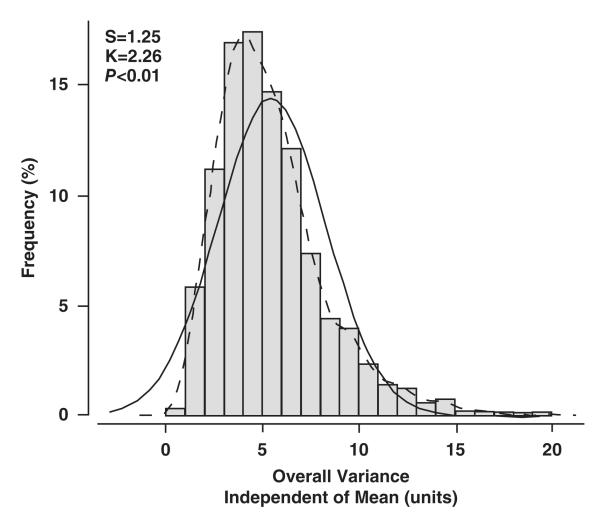
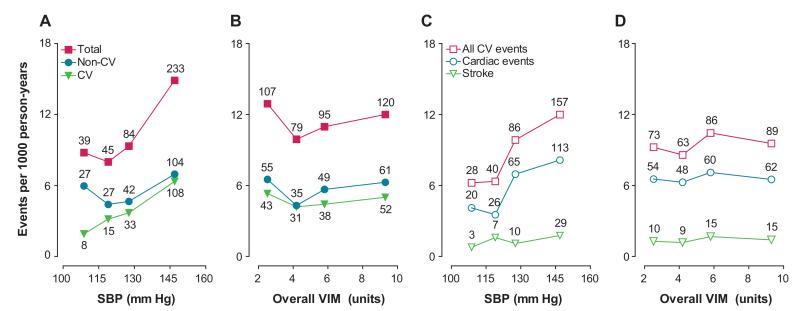
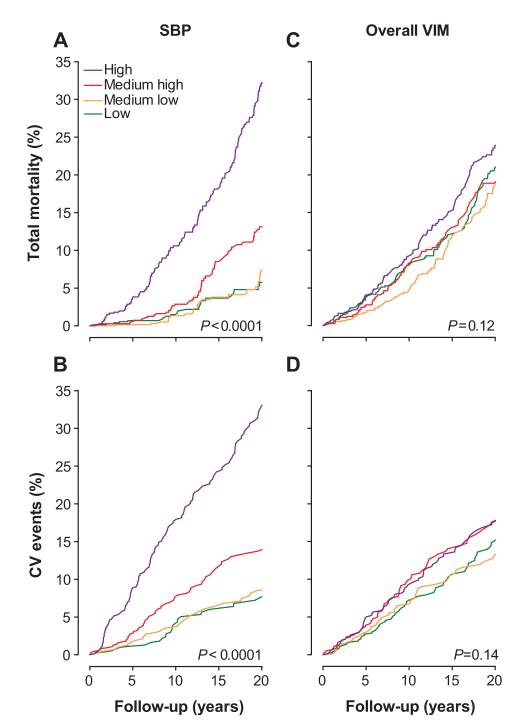
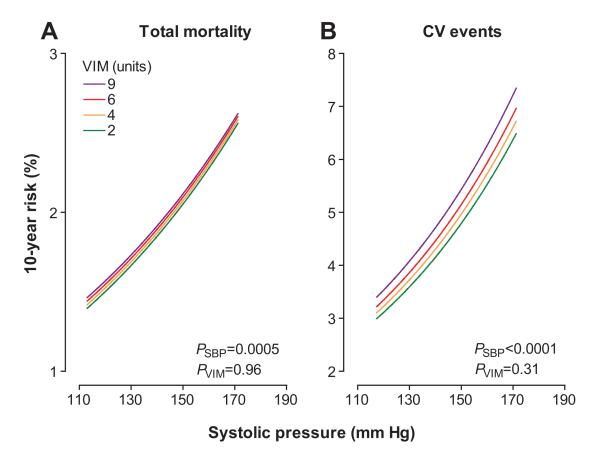
To assess the prognostic significance of blood pressure (BP) variability, we followed health outcomes in a family-based random population sample representative of the general population (n=2944; mean age: 44.9 years; 50.7% women). At baseline, BP was measured 5 times consecutively at each of 2 home visits 2 to 4 weeks apart. We assessed within-subject overall (10 readings), within- and between-visit systolic BP variability from variability independent of the mean, the difference between maximum and minimum BP, and average real variability. Over a median follow-up of 12 years, 401 deaths occurred and 311 participants experienced a fatal or nonfatal cardiovascular event. Overall systolic BP variability averaged (SD) 5.45 (2.82) units, 15.87 (8.36) mmHg, and 4.08 (2.05) mmHg for variability independent of the mean, difference between maximum and minimum BP, and average real variability, respectively. Female sex, older age, higher-mean systolic BP, lower body mass index, a history of peripheral arterial disease, and use of β-blockers were the main correlates of systolic BP variability. In multivariable-adjusted analyses, overall and within- and between-visit BP variability did not predict total or cardiovascular mortality or the composite of any fatal plus nonfatal cardiovascular end point. For instance, the hazard ratios for all cardiovascular events combined in relation to overall variability independent of the mean, difference between maximum and minimum BP, and average real variability were 1.05 (0.96-1.15), 1.06 (0.96-1.16), and 1.08 (0.98-1.19), respectively. By contrast, mean systolic BP was a significant predictor of all end points under study, independent of BP variability. In conclusion, in an unbiased population sample, BP variability did not contribute to risk stratification over and beyond mean systolic BP.
Figures
References
-
- Parati G, Pomidossi G, Albini F, Malaspina D, Mancia G. Relationship of 24-hour blood pressure mean and variability to severity of target-organ damage in hypertension. J Hypertens. 1987;5:93–98. - PubMed
-
- Tatasciore A, Renda G, Zimarino M, Soccio M, Bilo G, Parati G, Schillaci G, De Caterina R. Awake systolic blood pressure variability correlates with target-organ damage in hypertensive subjects. Hypertension. 2007;50:325–332. - PubMed
-
- Kawai T, Ohishi M, Kamide K, Onishi M, Takeya Y, Tatara Y, Oguro R, Yamamoto K, Sugimoto K, Rakugi H. The impact of visit-to-visit variability in blood pressure on renal function. Hypertens Res. 2012;35:239–243. - PubMed
-
- Matsui Y, Ishikawa J, Eguchi K, Shibasaki S, Shimada K, Kario K. Maximum value of home blood pressure: a novel indicator of target organ damage in hypertension. Hypertension. 2011;57:1087–1093. - PubMed
-
- Kikuya M, Hozawa A, Ohokubo T, Tsuji I, Michimata M, Matsubara M, Ota M, Nagai K, Araki T, Satoh H, Ito S, Hisamichi S, Imai Y. Prognostic significance of blood pressure and heart rate variabilities: the Ohasama study. Hypertension. 2000;36:901–906. - PubMed
Publication types
MeSH terms
Substances
Grants and funding
LinkOut - more resources
Full Text Sources
