. 2012 Oct 15;199(2):331-45.
doi: 10.1083/jcb.201202041.

Tiam1 interaction with the PAR complex promotes talin-mediated Rac1 activation during polarized cell migration

Affiliations

Tiam1 interaction with the PAR complex promotes talin-mediated Rac1 activation during polarized cell migration

Shujie Wang et al. J Cell Biol. .

Abstract

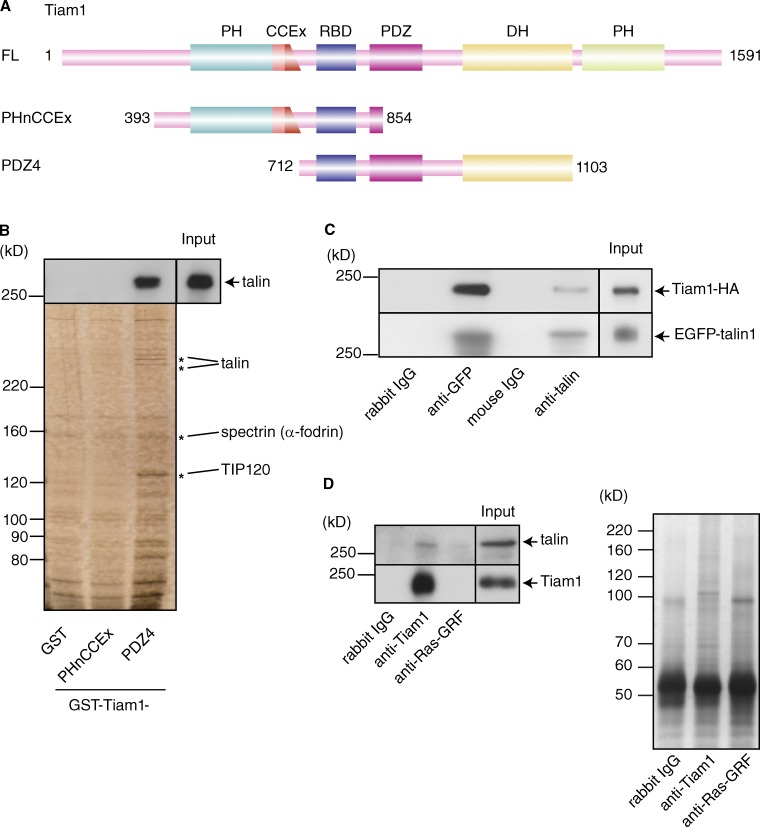
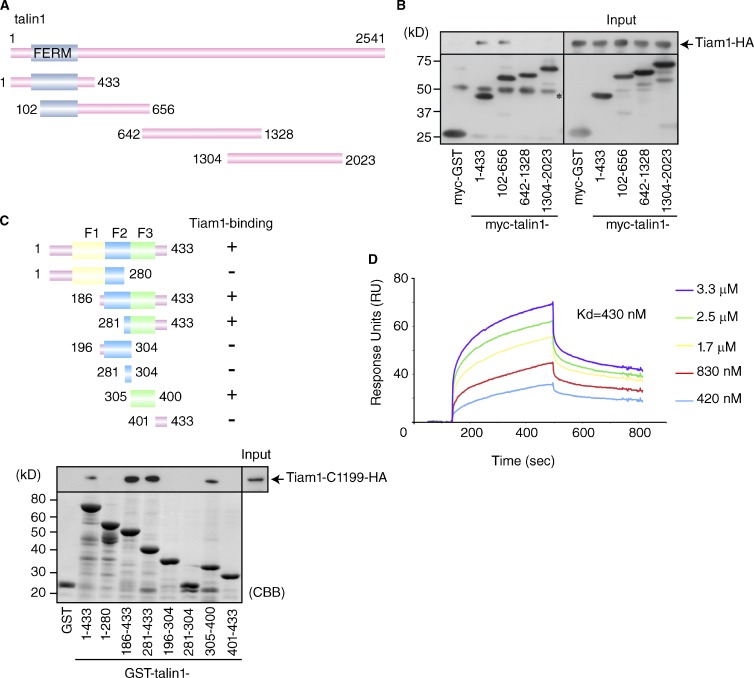
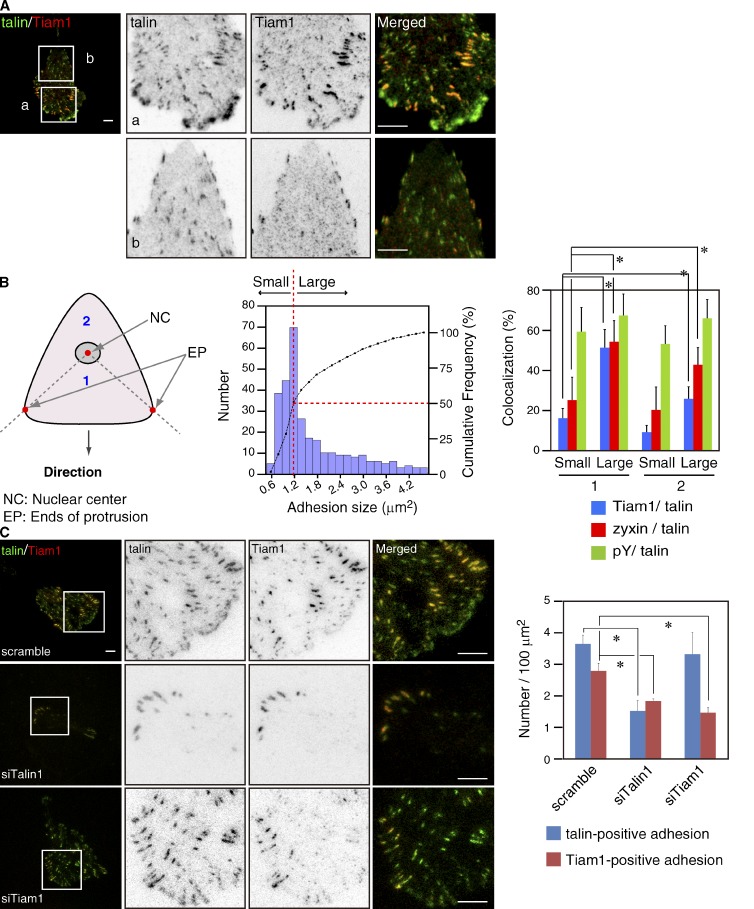
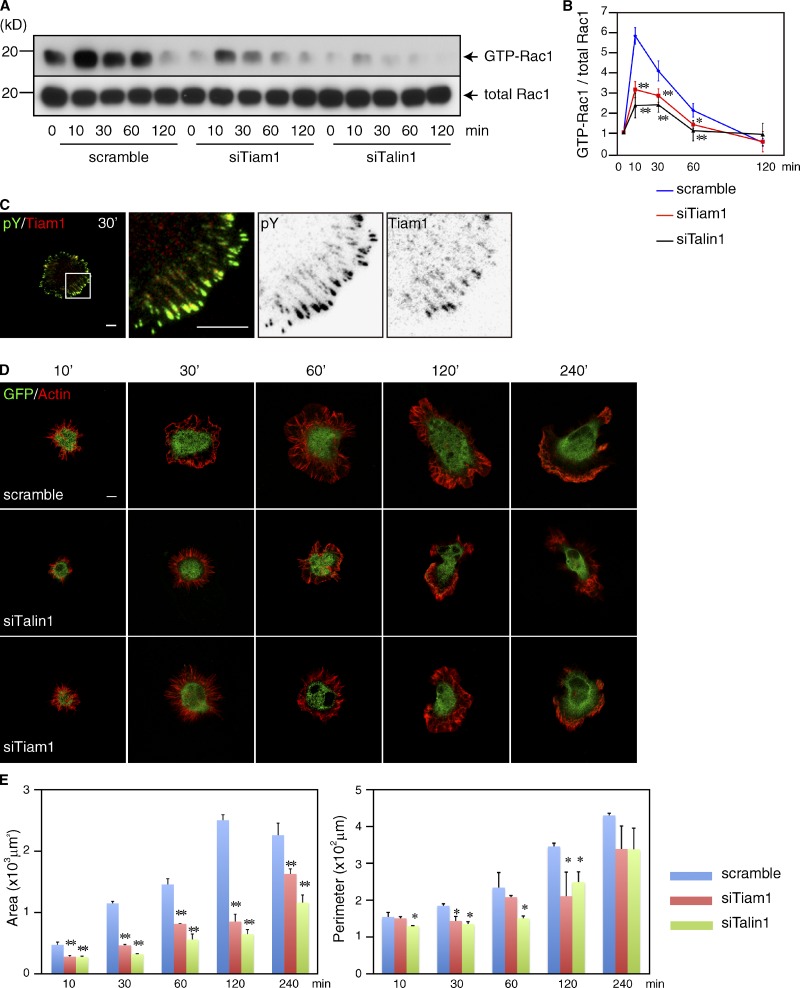
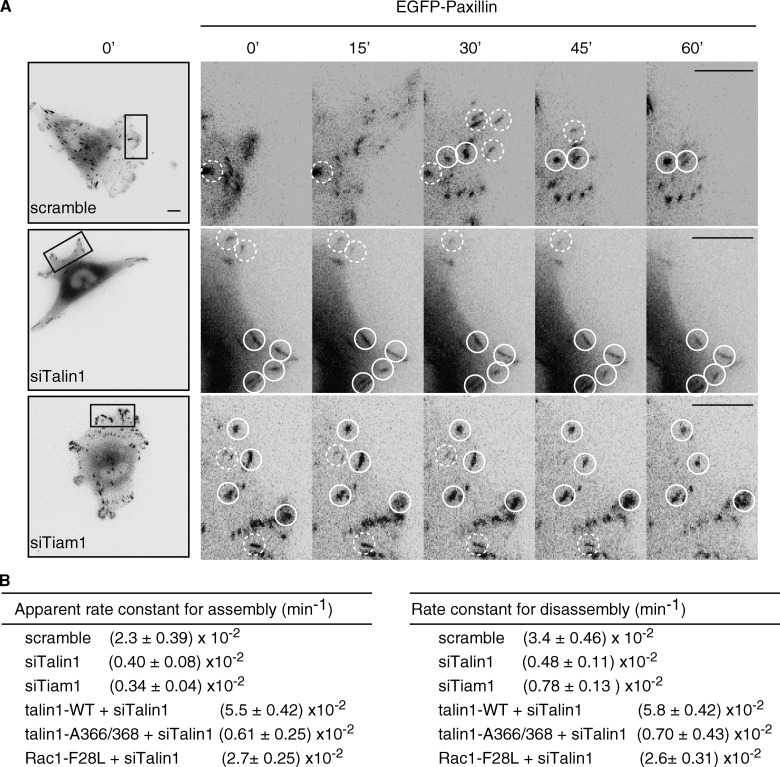
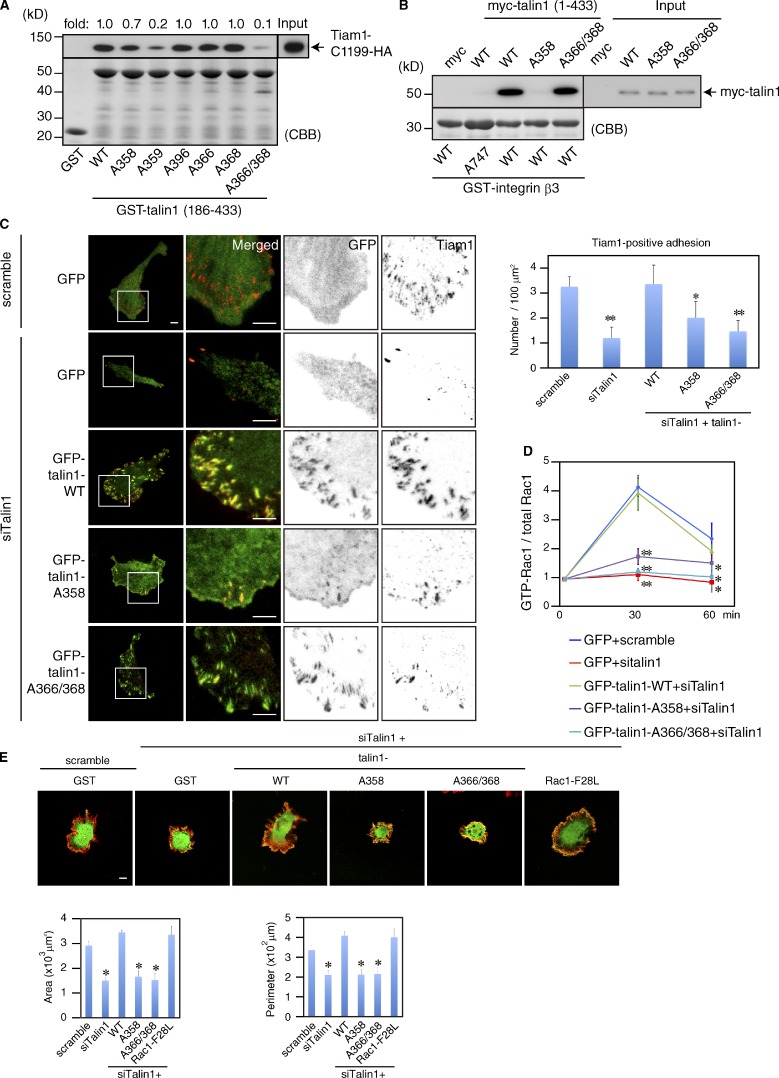
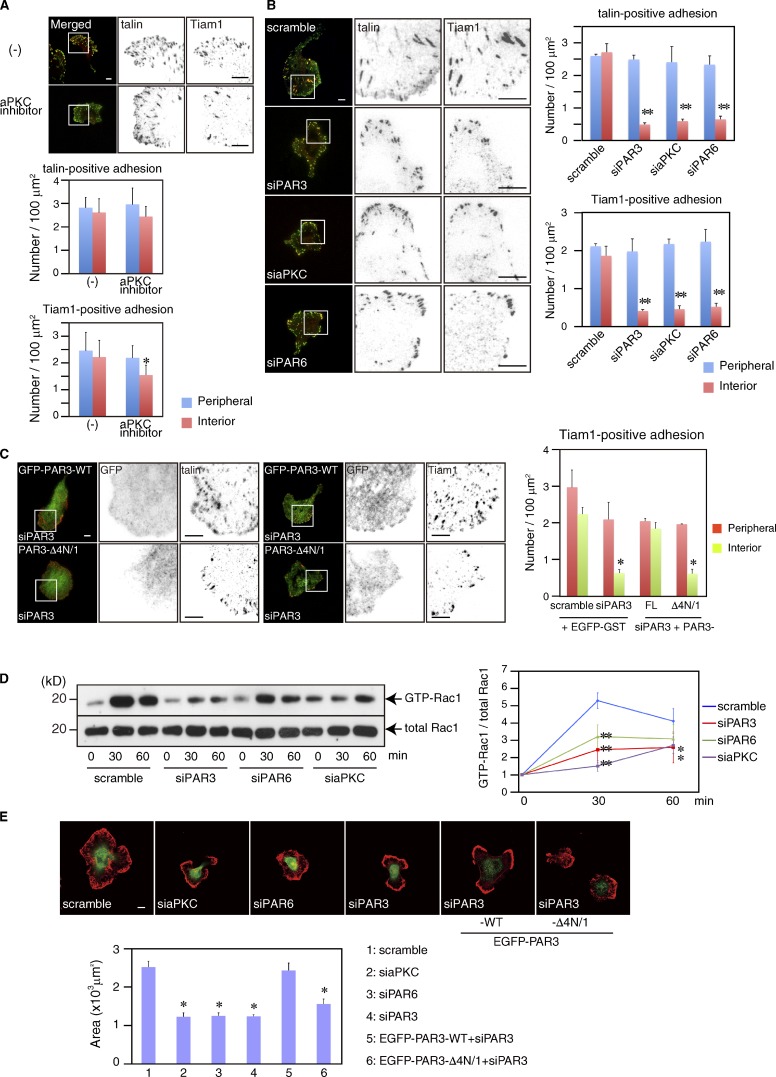
Migrating cells acquire front-rear polarity with a leading edge and a trailing tail for directional movement. The Rac exchange factor Tiam1 participates in polarized cell migration with the PAR complex of PAR3, PAR6, and atypical protein kinase C. However, it remains largely unknown how Tiam1 is regulated and contributes to the establishment of polarity in migrating cells. We show here that Tiam1 interacts directly with talin, which binds and activates integrins to mediate their signaling. Tiam1 accumulated at adhesions in a manner dependent on talin and the PAR complex. The interactions of talin with Tiam1 and the PAR complex were required for adhesion-induced Rac1 activation, cell spreading, and migration toward integrin substrates. Furthermore, Tiam1 acted with talin to regulate adhesion turnover. Thus, we propose that Tiam1, with the PAR complex, binds to integrins through talin and, together with the PAR complex, thereby regulates Rac1 activity and adhesion turnover for polarized migration.


Figures

Figure 1.
Figure 1.
Talin is a novel Tiam1-interacting protein. (A) Schematic diagram of Tiam1. The domain organization of Tiam1 and its fragments is represented. (B) The cytoplasmic fraction of a porcine brain homogenate was loaded onto beads coated with GST, GST-Tiam1-PHnCCEX, or GST-Tiam1-PDZ4. Aliquots of the eluate were resolved by SDS-PAGE, followed by silver staining (bottom) or immunoblotting with anti-talin antibody (top). (C) Lysates of COS7 cells expressing both EGFP-talin1 and Tiam1-HA were precipitated with anti-GFP or anti-talin antibody. Tiam1 was coprecipitated with talin by both antibodies. (D) The lysates of U251 cells were precipitated with indicated antibodies, followed by silver staining (right) and immunoblotting (left). Silver staining revealed a specific band pattern in each antibody. Endogenous talin was specifically coprecipitated with Tiam1. Results are representative of more than three experiments.
Figure 2.
Figure 2.
Talin binds directly to Tiam1. (A) Schematic diagram of the domain organization of talin1 and its fragments. (B) Lysates of COS7 cells expressing Tiam1-HA and the indicated myc-talin1 fragments were immunoprecipitated with anti-myc antibody. Tiam1 was detected only in the eluates of talin1 1–433 aa and 102–656 aa. Top and bottom panels show immunoblots with anti-HA and anti-myc antibody, respectively. Asterisk indicates immunoglobulin heavy chain. (C) Delineation of the Tiam1-binding region within the talin1 head domain. The fragments used and results are indicated on the top. Tiam1 was most abundant in the eluates of beads coated with talin1 fragments that possessed the F3 subdomain. (D) Sensorgrams of the association and dissociation phases for binding of GST-Tiam1-PDZ4 and His-talin1 1–433 aa. Talin1 (1–433 aa; 0.42–3.3 µM) was injected onto a surface coated with GST-Tiam1-PDZ4. Results are representative of more than three experiments.
Figure 3.
Figure 3.
Tiam1 accumulates at adhesions with talin. (A) Migrating U251 cells were stained with talin (green) and Tiam1 (red). The images were taken under TIRFM. Insets (a, front region; b, rest) in the left panel are magnified in the right panels. Bars, 10 µm. (B) Size distribution of adhesions and quantification of Tiam1/talin colocalization in migrating U251 cells. Each migrating cell is divided into two regions as indicated diagramatically on the left: front region (1) and rest (2). Small and large adhesions were defined by the distribution of adhesion sizes (histogram, middle). (C) U251 cells transfected with siRNAs indicated in the leftmost images were stained with talin and Tiam1 antibodies. Insets in the leftmost images (merged) are magnified in the panels to the right. Bars, 10 µm. Bar graph on right represents the number of talin- or Tiam1-containing adhesion per 100 µm2. Data represent the means ± SD of five independent experiments. n > 50. *, P < 0.05 versus respective control (Tukey’s HSD). Results are representative of more than three experiments.
Figure 4.
Figure 4.
Tiam1 and talin are required for adhesion-induced Rac1 activation and cell spreading. (A) U251 cells transfected with the indicated siRNAs were seeded onto FN under serum-free conditions. Rac1 activity was measured by pull-down with PAK-CRIB. Depletion of either talin or Tiam1 impaired transient Rac1 activation upon adhesion. (B) Plots of the quantified data from A. (C) Non-transfected U251 cells were stained at 30 min after seeding with anti-phosphotyrosine (pY) and anti-Tiam1 antibodies. Bars, 10 µm. (D) Images of Tiam1- or talin1-depleted cell spreading on FN. The cells were stained with anti-GFP antibody (green) and phalloidin (red). Bar, 10 µm. (E) Quantification of spreading area and perimeter length during spreading of U251 cells. Results are representative of at least four experiments. Data represent the means ± SD of three independent experiments. n > 100. *, P < 0.05; **, P < 0.01 versus control cells in each time point (B, Student’s t test; E, Tukey’s HSD).
Figure 5.
Figure 5.
Tiam1 and talin together control adhesion turnover for polarized cell migration. (A) U251 cells were transfected with the indicated siRNAs and EGFP-paxillin. 18 h after seeding onto FN, EGFP-paxillin dynamics was monitored at 5-min intervals for 5 h. Broken and white circles indicate dynamic and static adhesions, respectively. Bars, 10 µm. (B) Apparent rate constants for assembly (left) and rate constant for disassembly (right). Results are representative of more than three independent experiments.
Figure 6.
Figure 6.
Cell spreading requires the interaction of talin with Tiam1 and integrin. (A) Lysates of COS7 cells expressing Tiam1-C1199-HA were subjected to pull-down assay with GST-fused talin1 mutants. Tiam1 was barely detected in the eluates of beads containing talin1 A366/368. (B) GST-tagged integrin β3 cytoplasmic region (wild type or Y747A) was subjected to pull-down with lysates of COS7 cells expressing myc-talin1 (1–433 aa). Talin1 A366/368 bound to integrin β3, but talin1 A358 did not. (C) U251 cells transfected with talin1 siRNA and the indicated plasmids were stained with anti-GFP and anti-Tiam1 antibodies. Bars, 10 µm. Insets in the leftmost images (merged) are magnified in the panels to the right. The bar graph on the right represents the number of Tiam1-containing adhesions per 100 µm2. Wild-type talin1 restored the inhibitory effect of talin1 knockdown on Tiam1, but the talin1 mutant A366/368 did not. (D) U251 cells transfected with the siRNA against talin1 and indicated plasmids were seeded onto FN under serum-free conditions. Rac1 activity was measured by pull-down with PAK-CRIB. Expression of wild-type talin1 rescued Rac1 activation, but that of the talin1 mutants failed to do so. Data represent the means ± SD of three independent experiments. (E) Transfected cells were seeded onto FN-coated dishes and immunostained 2 h later with anti-GFP antibody (green) and phalloidin (red). Bar, 10 µm. The bar graphs below represent quantifications of spread area and cell perimeter. *, P < 0.05; **, P < 0.01 versus respective control cells (Student’s t test). Results are representative of more than three experiments.
Figure 7.
Figure 7.
The PAR complex is involved in Tiam1 targeting to adhesions and in signaling from integrin. (A) Cells were treated with 40 µM aPKC inhibitor for 1 h before fixation and stained with talin (green) and Tiam1 (red) antibodies. The insets in the left panels are magnified in the right panels. Bars, 10 µm. (B) Cells transfected with the indicated siRNAs were stained with talin (green) and Tiam1 (red) antibodies. Bars, 10 µm. (C) Cells transfected with PAR3 siRNAs and the indicated plasmids were stained with GFP (green) and Tiam1 or talin (red) antibodies. Bars, 10 µm. Bar graphs below (A) or to the right (B and C) of the corresponding images represent the number of talin- or Tiam1-containing adhesions per 100 µm2. (D) Adhesion-induced Rac1 activation in PAR complex–depleted cells. Depletion of the PAR complex attenuated Rac1 activation. The graph to the right quantifies Rac1 activation in these cells. Bars in the graph represent means ± SD. (E) Images of PAR complex–depleted cells at 2 h after spreading on FN. The cells were stained with anti-GFP antibody (green) and phalloidin (red). Bar, 10 µm. The bottom graph quantifies cell area after spreading. Data represent the means ± SD of at least three independent experiments. n > 50. *, P < 0.05; **, P < 0.01 versus respective control cells (A, B, and C, Tukey’s HSD; D and E, Student’s t test). Results are representative of more than three experiments.

Similar articles

Cited by

References

    1. Bolte S., Cordelières F.P. 2006. A guided tour into subcellular colocalization analysis in light microscopy. J. Microsc. 224:213–232 10.1111/j.1365-2818.2006.01706.x - DOI - PubMed
    1. Bos J.L., Rehmann H., Wittinghofer A. 2007. GEFs and GAPs: critical elements in the control of small G proteins. Cell. 129:865–877 10.1016/j.cell.2007.05.018 - DOI - PubMed
    1. Critchley D.R. 2009. Biochemical and structural properties of the integrin-associated cytoskeletal protein talin. Annu Rev Biophys. 38:235–254 10.1146/annurev.biophys.050708.133744 - DOI - PubMed
    1. del Pozo M.A., Price L.S., Alderson N.B., Ren X.D., Schwartz M.A. 2000. Adhesion to the extracellular matrix regulates the coupling of the small GTPase Rac to its effector PAK. EMBO J. 19:2008–2014 10.1093/emboj/19.9.2008 - DOI - PMC - PubMed
    1. Etienne-Manneville S. 2008. Polarity proteins in migration and invasion. Oncogene. 27:6970–6980 10.1038/onc.2008.347 - DOI - PubMed

Publication types

MeSH terms