. 2012 Oct 22;209(11):2033-47.
doi: 10.1084/jem.20120493. Epub 2012 Oct 15.

Identification of Axl as a downstream effector of TGF-β1 during Langerhans cell differentiation and epidermal homeostasis

Affiliations

Identification of Axl as a downstream effector of TGF-β1 during Langerhans cell differentiation and epidermal homeostasis

Thomas Bauer et al. J Exp Med. .

Abstract

Transforming growth factor-β1 (TGF-β1) is a fundamental regulator of immune cell development and function. In this study, we investigated the effects of TGF-β1 on the differentiation of human Langerhans cells (LCs) and identified Axl as a key TGF-β1 effector. Axl belongs to the TAM (Tyro3, Axl, and Mer) receptor tyrosine kinase family, whose members function as inhibitors of innate inflammatory responses in dendritic cells and are essential to the prevention of lupus-like autoimmunity. We found that Axl expression is induced by TGF-β1 during LC differentiation and that LC precursors acquire Axl early during differentiation. We also describe prominent steady-state expression as well as inflammation-induced activation of Axl in human epidermal keratinocytes and LCs. TGF-β1-induced Axl enhances apoptotic cell (AC) uptake and blocks proinflammatory cytokine production. The antiinflammatory role of Axl in the skin is reflected in a marked impairment of the LC network preceding spontaneous skin inflammation in mutant mice that lack all three TAM receptors. Our findings highlight the importance of constitutive Axl expression to tolerogenic barrier immunity in the epidermis and define a mechanism by which TGF-β1 enables silent homeostatic clearing of ACs to maintain long-term self-tolerance.


Figures
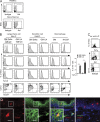
Figure 1.
Figure 1.
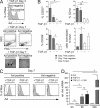
Axl is specifically expressed on human LCs and epidermal keratinocytes. (A) Human PBMCs and BM cells were stained for Axl or isotype control. Data are representative of three different donors and experiments. (B) Human peripheral blood monocytes were differentiated for 5 d with the indicated cytokines and ligands (GM, GM-CSF; Delta, Delta-like-1) and were then analyzed for the expression of the TAM receptors and surface markers. Data are representative of at least three donor experiments. Open histograms represent isotype control, and filled histograms represent specific staining. Bars represent mean (±SEM) percentage of Axl-positive cells. Replicate number (n) is indicated in the bars. *, P < 0.05; **, P < 0.01. (C) FACS analyses of human epidermal single cell suspensions stained for Axl or isotype control. LCs were identified as CD1a+ cells. The filled histogram represents specific staining, and the open histogram represents isotype control. One representative experiment out of three different donors and experiments is shown. (D) Immunohistochemistry of human adult skin cryosections for Axl and CD207. Nuclei were visualized with DAPI. Colors are as indicated. Data are representative of at least three different donors and experiments. The insets show an enlarged view of the framed areas. Section thickness was 5 µm. Bars, 10 µm.
Figure 2.
Figure 2.
TAM receptor ligands Gas6 and Protein S are expressed in the human epidermis. (A and B) Immunohistochemistry of human adult skin cryosections for Gas6 (A) and Protein S (B). Pictures are representative of at least three different donors and experiments. LCs were visualized with Abs against CD207, and nuclei with DAPI. Colors are as indicated. The insets show an enlarged view of the framed areas. Section thickness was 5 µm. Bars, 10 µm.
Figure 3.
Figure 3.
Axl is rapidly induced during early LC commitment. (A) CD34+ cells were cultured using a two-step DC-promoting culture system containing GM-CSF and IL-4 in the final step. Gated CD1a+CD11b+ cells were analyzed for the expression of the TAM receptors. Data are representative of three independent experiments. (B) CD34+ cells were cultured for 7 d in serum-free medium containing LC-promoting cytokine cocktail (GM-CSF, SCF, FLT3L, TNF, and TGF-β1). Parallel cultures were initiated without TGF-β1. Data are representative of at least three independent experiments. Bars represent the mean of percentages (±SEM) of cells Axl positive observed at days 3–4 from the total cell population (n = 6 donors). *, P < 0.05. (C) TAM surface expression on fresh CD34+ cells as well as by cells undergoing TGF-β1–dependent LC differentiation (days 4 and 7). Parallel cultures were initiated without TGF-β1. One representative out of three independent experiments is shown. Open histograms represent isotype control, and filled histograms represent specific staining as indicated.
Figure 4.
Figure 4.
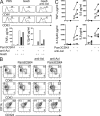
Axl is expressed early during LC differentiation downstream of TGF-β1 signaling. (A) CD34+ cells were cultured for 3 d in serum-free medium containing an LC-promoting cytokine cocktail (GM-CSF, SCF, FLT3L, TNF, and TGF-β1). FACS sort windows of Axl positive/negative (+/−) cells on day 3 are indicated. The open histogram represents isotype control. Lower plots and bright field microscope pictures represent size properties (SSC and FSC) and cluster formation of sorted Axl+/− cells after 4 d of reculture. Representative data from six different experiments and donors are shown. Arrowheads (bottom left bright field picture) indicate representative cell clusters. Bar, 50 μm. (B) Surface marker expression and normalized cell counts of 4-d-recultured Axl+/− cells ± TGF-β1. Bars represent the mean (±SEM) of three (bottom) to six (top) different reculture experiments with different donors. (C) Representative FACS histograms of 4-d-recultured Axl+/− cells ± TGF-β1 stained for Axl surface expression. Data are representative of three independent experiments. Open histograms represent isotype control, and filled histograms represent specific staining. (D) Axl mRNA expression after 6 and 24 h of culture ± TGF-β1, relative to 0 h measured by quantitative real-time RT-PCR. Values were normalized to HPRT. Cycloheximide (CHX) was added 1 h before TGF-β1 in parallel cultures for 6 h. Bars represent mean (±SEM). Data represent four different donor experiments. *, P < 0.05; **, P < 0.01.
Figure 5.
Figure 5.
TGF-β1–induced Axl impairs TLR-mediated LC activation. (A) MoLCs were incubated with an anti-Axl blocking Ab or isotope control for 1 h, then stimulated with 400 ng/ml Gas6 or PBS for 3 h, and activated with PAM3CSK4 for another 20 h. Thin lines represent control, and thick lines represent activated cells. FACS analysis for the indicated surface markers is shown in the top plots. Bottom bars represent cytokine concentrations measured in the supernatants by LUMINEX. A representative experiment from two different donors and experiments is shown. (B and C) MoLCs were differentiated in the presence GM-CSF, IL-4, TGF-β1, and 5 µg/ml anti-Axl blocking Ab or isotype control for 5 d and subsequently activated with PAM3CSK4 for 20 h. A representative experiment out of four different donor experiments is shown. (C) Cytokine levels in the supernatants were measured by LUMINEX. Dots represent the four different donor experiments performed. Open dots indicate isotype control; closed dots indicate blocking anti-Axl Ab.
Figure 6.
Figure 6.
TGF-β1–induced Axl confers enhanced capability for uptake of ACs. (A) Cluster-purified CD34+ derived LCs were incubated for 90 min with PKH26-labeled ACs at 37°C before FACS analysis. LCs were incubated with 5 µg/ml anti-Axl blocking Ab or isotype control 30 min before AC exposure. CD1a+ cells were analyzed for PKH26. PKH26-positive LCs are depicted as a percentage (FACS histograms). Data are representative of three independent experiments performed with different donors. (B) Graph represents data analyzed as described in A from three different experiments with different donors. (C) BM from WT and TAM KO mice was cultured in the presence of M-CSF ± 0.25 ng/ml TGF-β1 for 7 d and analyzed for Axl and Mer expression by Western blot. One representative out of six independent experiments is shown. (D) BM was treated as described in C, and Axl and Mertk mRNA levels were analyzed by quantitative RT-PCR. Bars represent mean (±SD). One representative out of two independent experiments is shown. (E) Representative confocal images of BMDMs from WT and TAM KO mice differentiated ± TGF-β1 and exposed to fluorescently labeled apoptotic thymocytes (AC). Cells were counterstained with rhodamine-phalloidin (actin cytoskeleton) and Hoechst (nuclei). Arrowheads indicate examples of AC uptake. Data are representative of three independent experiments. Bar, 50 µm. (F) Quantification of phagocytosis. Graphs show the mean (±SEM) normalized phagocytic index (number of engulfed ACs per number of macrophages). Data are representative of three independent experiments. T, Tyro3; A, Axl; and M, Mer; the combination represents the triple KO mouse. *, P < 0.05; ***, P < 0.001.
Figure 7.
Figure 7.
TGF-β1 signaling regulates TAM expression pattern by mouse BMDCs. (A) BM was cultured in the presence of GM-CSF ± TGF-β1 ± TGF-β receptor I/II kinase inhibitor (LY2109761) for 7 d and analyzed for TAM receptor expression by Western blot. (B) BM was cultured in the presence of GM-CSF and increasing concentrations of TGF-β receptor I kinase inhibitor (SB431542; 0.01, 0.1, 1, and 10 µM) for 7 d and analyzed for TAM receptor expression by Western blot. (C) BM from Axl, Mer, and Tyro3 single and Axl/Mer double KO mice was cultured in the presence of GM-CSF for 7 d and analyzed for TAM receptor expression by Western blot. (D) BMDMs were activated for 18 h with LPS in the presence or absence of LY2109761 and analyzed for Axl and Mer expression. (A, C, and D) Duplicate lanes represent separate differentiations. (A–D) Data are representative of two (B–D) or three (A) independent experiments.
Figure 8.
Figure 8.
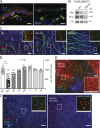
Loss of LC network integrity in TAM-deficient mice precedes skin inflammation. (A) Immunofluorescence staining of Axl in ear sections from WT and AM KO mice. Images are representative of three independent experiments. (B) Western blot analysis of epidermal protein lysates from two WT and one TAM KO mouse for Mer and Tyro3. Data are representative of two independent experiments. (C) Representative immunofluorescence staining of epidermal ear sheets from WT and two different TAM KO mice. LCs were visualized with Abs against I-A/I-E and CD207, and nuclei were stained with Hoechst. Colors are as indicated. Data are representative of more than three independent experiments. (D) I-A/I-E–positive cells from WT and TAM receptor KO mice were enumerated and shown in I-A/I-E+ cells/mm2. Each dot represents one mouse. Bars indicate the mean ± SEM. ***, P < 0.001. (E) Representative image from an I-A/I-E–high region of a 10-mo-old TAM KO mouse. (F) Representative image of a 10-mo-old WT and TAM KO mouse. Dendritic epidermal T cells were visualized with Abs against the γδ-TCR. Colors are as indicated. T, Tyro3; A, Axl; and M, Mer; any combination represents the respective double or triple KO mouse. (C, E, and F) Insets represent higher magnifications of the framed areas. Bars: (A) 10 µm; (C, E, and F) 100 µm.
Figure 9.
Figure 9.
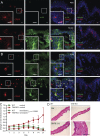
Effects of contact sensitizers on TAM receptors and their role during skin inflammation. (A and B) Human adult skin was cultured for 5 h at 37°C after the topical application of PBS or NiSO4. Representative immunofluorescence stainings of cryosections for phospho-Axl (p-Axl; A) and Mer (B) are shown. LCs were visualized with Abs against CD207, and nuclei with DAPI. Pictures are representative of three different experiments performed with different donors. Colors are as indicated. The insets show an enlarged view of the framed areas. Section thickness was 5 µm. (C) TAM KO and WT mice were sensitized on the shaved abdomen with 0.5% DNFB. 5 d later, mice were challenged on one ear with 0.3% DNFB. Nonsensitized mice were challenged on one ear with 0.3% DNFB as control. The diagram shows the change in ear thickness at the indicated time points. Data are shown as mean ± SEM per time point (n = 5 mice per group). Data are pooled from two independent experiments. Statistical analysis for the whole dataset was performed using the two-way analysis of variance test. P-value is indicated. (D) Challenged mice from C were sacrificed 21 d after treatment, and ear sections were stained with hematoxylin and eosin. Data are representative of three mice per group. Section thickness was 11 µm. Bars: (A and B) 10 µm; (D) 1 mm.

References

    1. Anderson H.A., Maylock C.A., Williams J.A., Paweletz C.P., Shu H., Shacter E. 2003. Serum-derived protein S binds to phosphatidylserine and stimulates the phagocytosis of apoptotic cells. Nat. Immunol. 4:87–91 10.1038/ni871 - DOI - PubMed
    1. Borkowski T.A., Letterio J.J., Farr A.G., Udey M.C. 1996. A role for endogenous transforming growth factor β 1 in Langerhans cell biology: the skin of transforming growth factor β 1 null mice is devoid of epidermal Langerhans cells. J. Exp. Med. 184:2417–2422 10.1084/jem.184.6.2417 - DOI - PMC - PubMed
    1. Dang H., Geiser A.G., Letterio J.J., Nakabayashi T., Kong L., Fernandes G., Talal N. 1995. SLE-like autoantibodies and Sjögren’s syndrome-like lymphoproliferation in TGF-beta knockout mice. J. Immunol. 155:3205–3212 - PubMed
    1. Eisenwort G., Jurkin J., Yasmin N., Bauer T., Gesslbauer B., Strobl H. 2011. Identification of TROP2 (TACSTD2), an EpCAM-like molecule, as a specific marker for TGF-β1-dependent human epidermal Langerhans cells. J. Invest. Dermatol. 131:2049–2057 10.1038/jid.2011.164 - DOI - PubMed
    1. Ekman C., Jönsen A., Sturfelt G., Bengtsson A.A., Dahlbäck B. 2011. Plasma concentrations of Gas6 and sAxl correlate with disease activity in systemic lupus erythematosus. Rheumatology (Oxford). 50:1064–1069 10.1093/rheumatology/keq459 - DOI - PMC - PubMed

Publication types

MeSH terms

Substances