. 2012;8(10):e1002988.
doi: 10.1371/journal.pgen.1002988. Epub 2012 Oct 11.

Deposition of histone variant H2A.Z within gene bodies regulates responsive genes

Affiliations

Deposition of histone variant H2A.Z within gene bodies regulates responsive genes

Devin Coleman-Derr et al. PLoS Genet. 2012.

Abstract

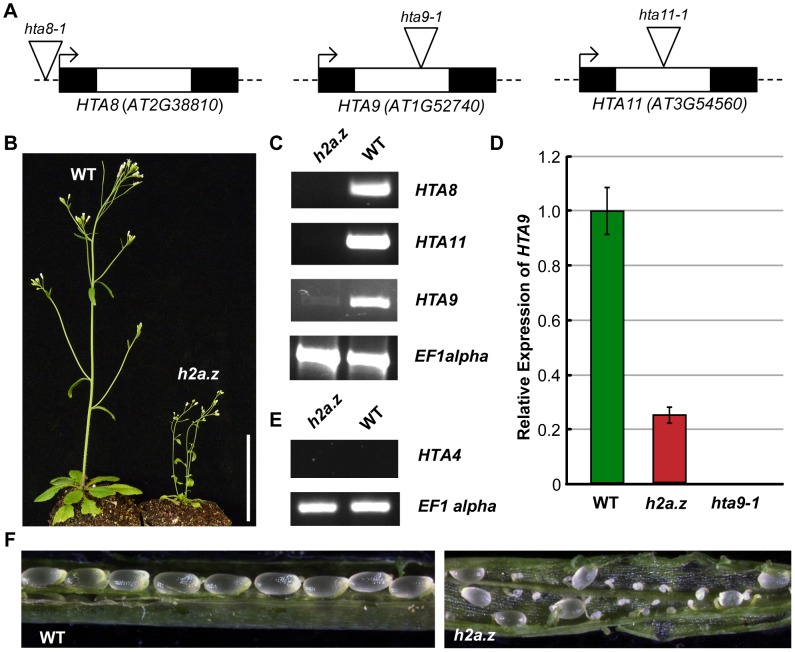
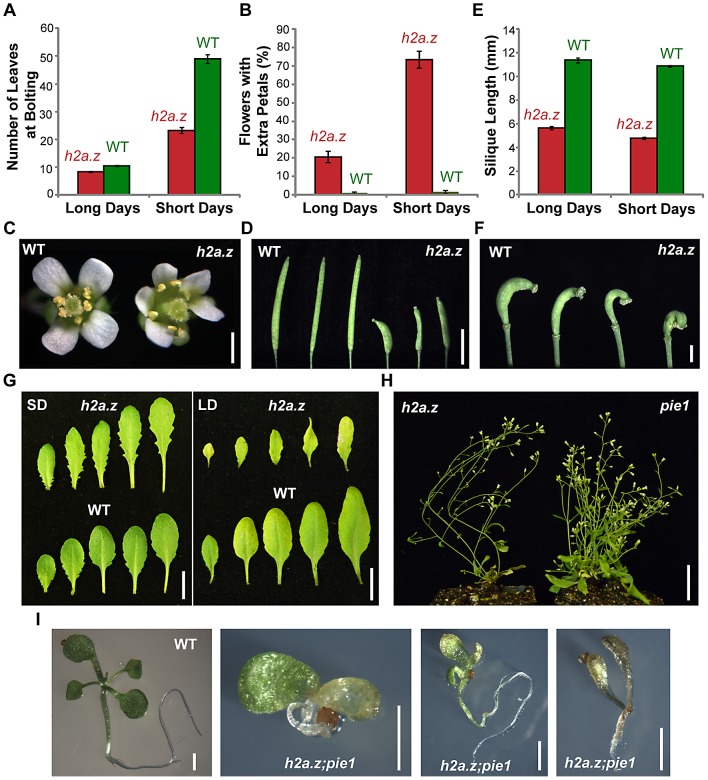
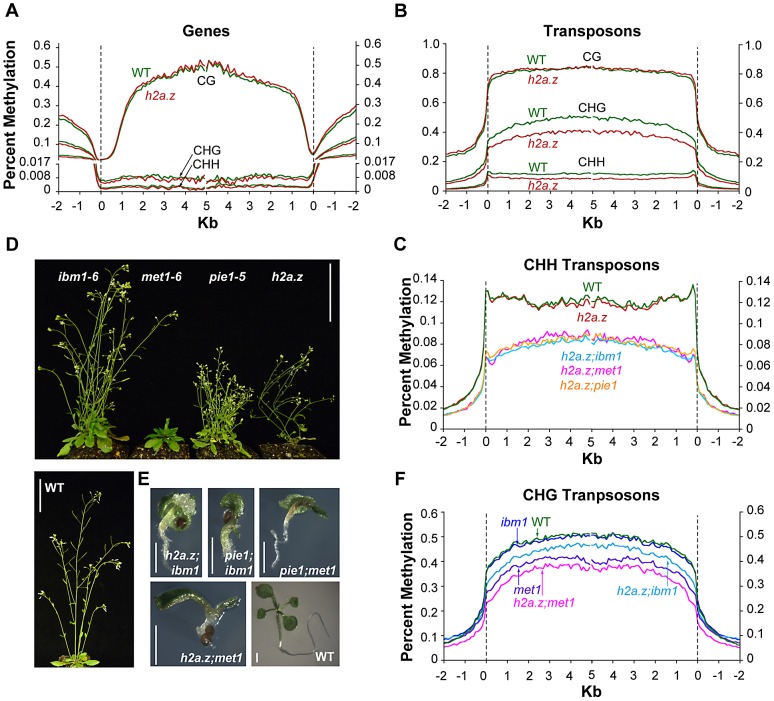
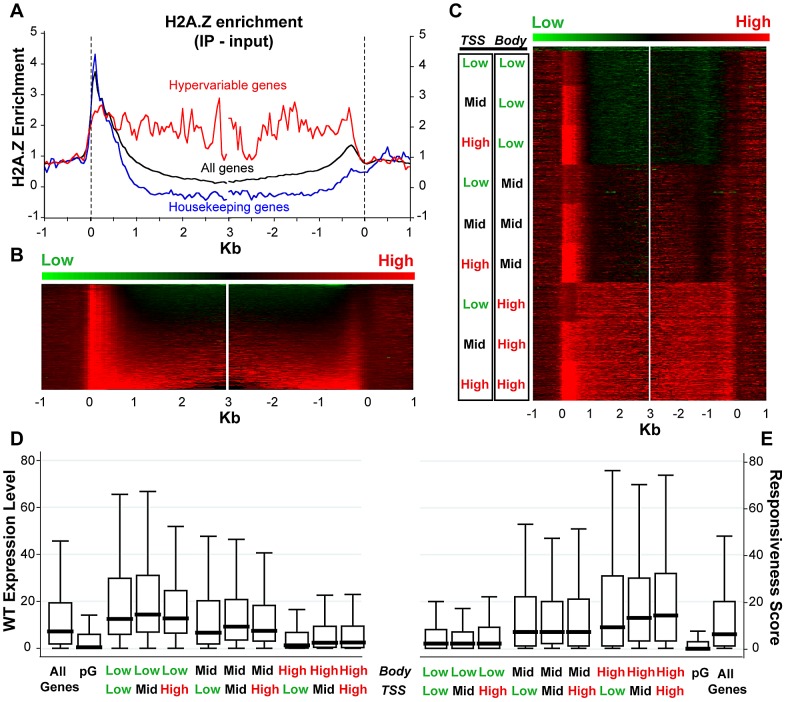
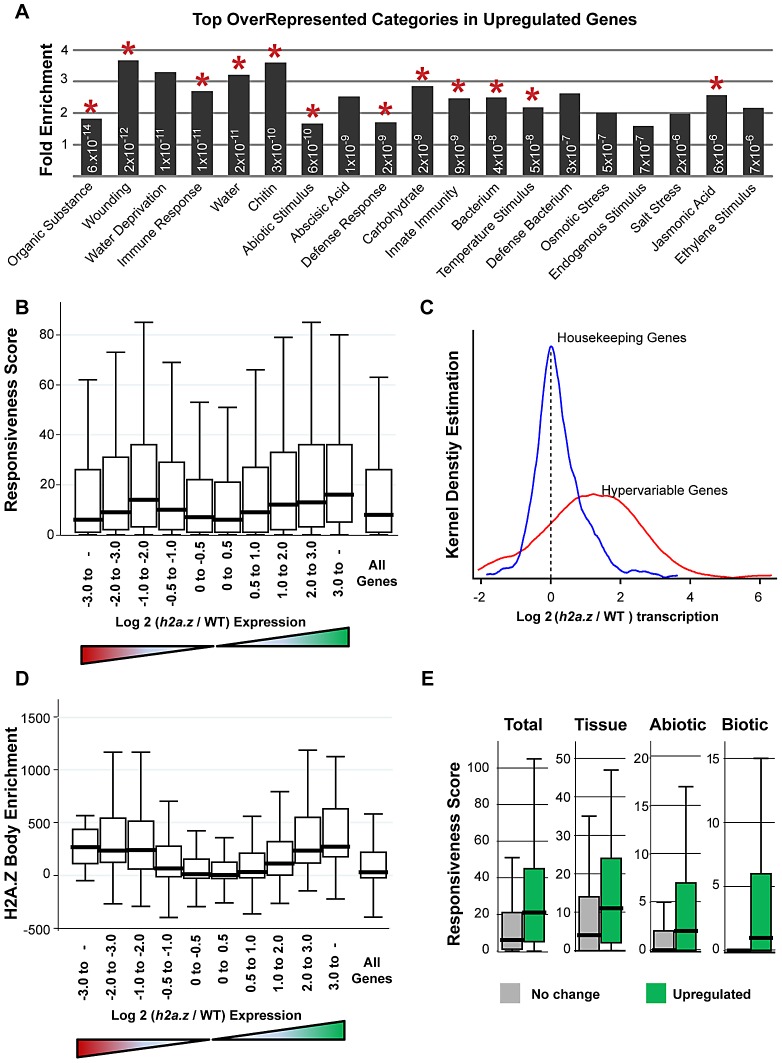
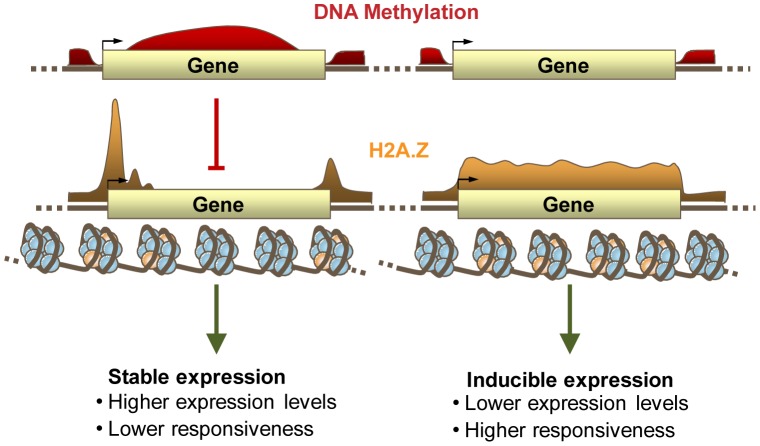
The regulation of eukaryotic chromatin relies on interactions between many epigenetic factors, including histone modifications, DNA methylation, and the incorporation of histone variants. H2A.Z, one of the most conserved but enigmatic histone variants that is enriched at the transcriptional start sites of genes, has been implicated in a variety of chromosomal processes. Recently, we reported a genome-wide anticorrelation between H2A.Z and DNA methylation, an epigenetic hallmark of heterochromatin that has also been found in the bodies of active genes in plants and animals. Here, we investigate the basis of this anticorrelation using a novel h2a.z loss-of-function line in Arabidopsis thaliana. Through genome-wide bisulfite sequencing, we demonstrate that loss of H2A.Z in Arabidopsis has only a minor effect on the level or profile of DNA methylation in genes, and we propose that the global anticorrelation between DNA methylation and H2A.Z is primarily caused by the exclusion of H2A.Z from methylated DNA. RNA sequencing and genomic mapping of H2A.Z show that H2A.Z enrichment across gene bodies, rather than at the TSS, is correlated with lower transcription levels and higher measures of gene responsiveness. Loss of H2A.Z causes misregulation of many genes that are disproportionately associated with response to environmental and developmental stimuli. We propose that H2A.Z deposition in gene bodies promotes variability in levels and patterns of gene expression, and that a major function of genic DNA methylation is to exclude H2A.Z from constitutively expressed genes.


Conflict of interest statement

The authors have declared that no competing interests exist.

Figures

Figure 1
Figure 1. Construction of an h2a.z mutant line.
(A) The three T-DNA insertions in HTA8, HTA9, and HTA11. Exons are represented by dark boxes, introns by unfilled boxes. Triangles represent the T-DNA insertion points. hta9-1 and hta11-1 are intronic insertions, while hta8-1 is an insertion in the 5′ UTR. (B) WT and h2a.z plants at 21 days post germination. Scale bar = 3 cm. (C) RT-PCR of HTA8, HTA9, and HTA11 in the h2a.z mutant line and WT control line. RT-PCR of EF1alpha was used as a loading control. (D) qPCR results for HTA9 transcripts in the h2a.z and hta9-1 mutants. Expression is normalized to WT levels; WT is shown in green, and h2a.z in red. Note that the level of HTA9 in the hta9-1 mutant is 0.040 percent of WT. (E) RT-PCR of HTA4 in the h2a.z mutant line and a WT control. RT-PCR of EF1alpha was used as a loading control. (F) Ovule development in h2a.z mutant and WT siliques grown in LD conditions.
Figure 2
Figure 2. Characterization of the h2a.z mutant phenotype.
(A) Average flowering time of the h2a.z mutant and WT control, as measured by the average number of rosette leaves at the time of bolting (cotyledons not included). Measurements were taken for 50 h2a.z and WT plants in both long day (LD, 16 h light/8 h dark) and short day (SD, 8 h light/16 h dark) conditions. (B) Average percentage of early flowers with extra petals, as measured in the first ten flowers of h2a.z mutant and WT plants. Measurements were averaged for 50 h2a.z and WT plants in both LD (16 h light/8 h dark) and SD (8 h light/16 h dark) conditions. (C) h2a.z mutant (right) and WT (left) flowers grown in SD. Scale bar = 2 mm. (D) h2a.z mutant (right) and WT (left) siliques. Scale bar = 4 mm. (E) Average mature silique length in h2a.z mutant and WT plants. Measurements were averaged for 10 mature siliques from each of 50 h2a.z and WT plants in both LD (16 h light/8 h dark) and SD (8 h light/16 h dark) conditions. (F) Strong curvature of developing h2a.z mutant siliques. Scale bar = 1 mm. (G) Rosette leaf morphology in h2a.z mutant and WT plants grown in SD (40 days; left panel) and in LD (28 days; right panel). Scale bar = 1 cm. (H) Phenotypes of h2a.z and pie1–5 mutants grown in LD at 6 weeks post germination. Scale bar = 1 cm. (I) Phenotypes of WT and h2a.z;pie1 double mutants at 14 days post germination. Scale bar = 1 mm.
Figure 3
Figure 3. DNA methylation profiles of h2a.z-related mutants.
(A) Profiles of CG, CHG, and CHH DNA methylation in two replicates each of cauline leaf h2a.z and WT. Genes were aligned at the 5′ end (left half of panel) and the 3′ end (right half of panel) and average methylation levels for each 100-bp interval are plotted from 2 kb away from the gene (negative numbers) to 5 kb into the gene (positive numbers). WT methylation is represented by the green traces, while h2a.z methylation is represented by red traces. The dashed lines at zero represents the point of alignment. The Y-axis was partitioned at 0.017 and the lower portion expanded to aid in the visibility of CHG and CHH traces. (B) Profiles of CG, CHG, and CHH DNA methylation in transposons in h2a.z and WT, aligned as genes were in (A). WT methylation is represented by the green traces, while h2a.z methylation is represented by red traces. (C) Profiles of average CHH DNA methylation in TEs. TEs were aligned and average methylation levels determined as in (B). WT methylation is represented by the green trace, h2a.z by the red trace, h2a.z;met1 by the pink trace, h2a.z;ibm1 by the light blue trace, and h2a.z;pie1 by the orange trace. (D) Phenotypes of ibm1–6, met1–6, pie1–5, h2a.z and WT plants grown in LD conditions at 6 weeks post germination. Scale bars = 3 cm. (E) Phenotypes of h2a.z;ibm1, h2a.z;met1, pie1;ibm1, pie1;met1 double mutants and WT seedling at 14 days post germination grown in LD conditions. Scale bars = 1 mm. (F) Profiles of average CHG DNA methylation in TEs, as in (C). WT methylation is represented by the green trace, met1 by the purple trace, h2a.z;met1 by the pink trace, and h2a.z;ibm1 by the light blue trace, and ibm1 by the dark blue trace.
Figure 4
Figure 4. H2A.Z enrichment in gene bodies is associated with lower expression and higher responsiveness.
(A) Average profile of H2A.Z enrichment (IP - input) across gene bodies for all genes (black trace, n = 21,675), housekeeping genes (blue trace, n = 371) and hypervariable genes (red trace, n = 117), as defined in Aceituno et. al. 2009 . Genes were aligned at the 5′ end (left half of panel) and the 3′ end (right half of panel) and average H2A.Z enrichment levels for each 50-bp interval are plotted from 1 kb away from the gene (negative numbers) to 3 kb into the gene (positive numbers). To avoid averaging H2A.Z enrichment at the 5′ and 3′ ends of short genes into the H2A.Z body distribution, we do not use data within 1 kb of the opposite end of the gene for “all” and “housekeeping” genes. For “hypervariable” genes, we do not use data within 500 bp of the opposite end of the gene – analysis excluding 1 kb produces a very similar but much noisier trace due to fewer data points. (B) A heat map of H2A.Z enrichment (IP - input) for the genes represented by the “all” black trace in panel (A), aligned exactly as in panel (A). Genes were sorted (top to bottom) from lowest to highest H2A.Z enrichment across their bodies (from 500 bp after the TSS to 500 bp before the 3′ end). (C) The H2A.Z enrichment data were clustered into nine approximately equal sized groups based on three tiers (low, mid, high) of H2A.Z enrichment at the TSS (0 to 500 bp from the TSS) and across the body (from 1 kb after the TSS to 1 kb before the 3′ end to avoid contamination from the 5′ and 3′ H2A.Z peaks; genes under 2.1 kb were discarded); 158 pseudogenes, with very low levels of H2A.Z enrichment, were removed from the category representing lowest enrichment and clustered together at the top of the heat map. 12,237 genes are shown. (D) and (E) Box plots of WT expression levels (D) and responsiveness scores (E) for all genes partitioned into the nine H2A.Z-enrichment clusters in (C), as well as for all genes and for 158 pseudogenes (pG). Each box represents the middle 50% of the distribution, with the horizontal black lines marking the medians. The lines extending vertically from each box represent values that fall within 1.5 times the height of the box.
Figure 5
Figure 5. Genes with H2A.Z gene body enrichment are misregulated in h2a.z.
(A) Fold enrichment of the top 19 over-represented GO categories in the 1,800 upregulated genes in the h2a.z mutant, all of which are response-related. For simplicity, all categories have had “Response to” removed from their names, with the exception of “Immune response” and “Defense response”. All categories have P-values for over-representation less than 1×10⁻⁵, and each P-value is indicated within the respective bar. GO terms that also appear as overrepresented in similar analyses done with genes upregulated in at least two of the three h2a.z, pie1, and hta9;hta11 mutant datasets are marked with a red asterisk. (B) Box plots of Responsiveness Score for all genes partitioned by the degree of up and downregulation in the h2a.z mutant. Genes are grouped into bins based on increasing log2 (h2a.z/WT) expression level, ranging from −8.6 to 9.8; a separate bin shows the Responsiveness Score for all genes. The red and green triangles below the X-axis respectively represent decreased and increased expression in the mutant over WT. (C) Kernel density plots for transcriptional changes in the h2a.z mutant (log2 (h2a.z/WT) transcription) for housekeeping genes (blue, n = 384) and hypervariable genes (red, n = 123). (D) Box plots of H2A.Z body-enrichment (IP - input) for all genes with H2A.Z body enrichment scores (n = 12,237) partitioned by degree of up and downregulation. Genes are grouped as in (B). (E) Box plots for responsiveness, broken down by subcategory, in the 2-fold upregulated genes (n = 1,800, shown in green) and the least misregulated genes (less than 1.4-fold up or down regulated, n = 9,300, shown in grey and labeled “No change”). Subcategories and associated responsiveness scores are from , and represent the three major types of stimuli: developmental (tissue), abiotic, and biotic.
Figure 6
Figure 6. DNA Methylation, H2A.Z, and expression patterning.
A proposed model for the relationship between DNA methylation (shown in red) and H2A.Z (shown in yellow) within genes, and their relationship with gene responsiveness and transcript level. Gene body methylation prevents the incorporation of H2A.Z within the bodies of highly and constitutively expressed genes. H2A.Z within unmethylated gene bodies regulates the expression of inducible genes.

References

    1. Talbert PB, Henikoff S (2010) Histone variants–ancient wrap artists of the epigenome. Nat Rev Mol Cell Biol 11: 264–275. - PubMed
    1. Henikoff S, Ahmad K (2005) Assembly of variant histones into chromatin. Annu Rev Cell Dev Biol 21: 133–153. - PubMed
    1. Sarma K, Reinberg D (2005) Histone variants meet their match. Nat Rev Mol Cell Biol 6: 139–149. - PubMed
    1. Barzily-Rokni M, Friedman N, Ron-Bigger S, Isaac S, Michlin D, et al. (2011) Synergism between DNA methylation and macroH2A1 occupancy in epigenetic silencing of the tumor suppressor gene p16(CDKN2A). Nucleic Acids Res 39: 1326–1335. - PMC - PubMed
    1. Zlatanova J, Thakar A (2008) H2A.Z: view from the top. Structure 16: 166–179. - PubMed

Publication types