

Improving image quality by accounting for changes in water temperature during a photoacoustic tomography scan
- PMID: 23071512
- PMCID: PMC3469660
- DOI: 10.1371/journal.pone.0045337
Improving image quality by accounting for changes in water temperature during a photoacoustic tomography scan
Erratum in
- PLoS One. 2013;8(5). doi:10.1371/annotation/fe1e40e1-5f1f-4ce2-9960-3d8849b83435
Abstract
The emerging field of photoacoustic tomography is rapidly evolving with many new system designs and reconstruction algorithms being published. Many systems use water as a coupling medium between the scanned object and the ultrasound transducers. Prior to a scan, the water is heated to body temperature to enable small animal imaging. During the scan, the water heating system of some systems is switched off to minimize the risk of bubble formation, which leads to a gradual decrease in water temperature and hence the speed of sound. In this work, we use a commercially available scanner that follows this procedure, and show that a failure to model intra-scan temperature decreases as small as 1.5°C leads to image artifacts that may be difficult to distinguish from true structures, particularly in complex scenes. We then improve image quality by continuously monitoring the water temperature during the scan and applying variable speed of sound corrections in the image reconstruction algorithm. While upgrading to an air bubble-free heating pump and keeping it running during the scan could also solve the changing temperature problem, we show that a software correction for the temperature changes provides a cost-effective alternative to a hardware upgrade. The efficacy of the software corrections was shown to be consistent across objects of widely varying appearances, namely physical phantoms, ex vivo tissue, and in vivo mouse imaging. To the best of our knowledge, this is the first study to demonstrate the efficacy of modeling temporal variations in the speed of sound during photoacoustic scans, as opposed to spatial variations as focused on by previous studies. Since air bubbles pose a common problem in ultrasonic and photoacoustic imaging systems, our results will be useful to future small animal imaging studies that use scanners with similarly limited heating units.
Conflict of interest statement
Figures
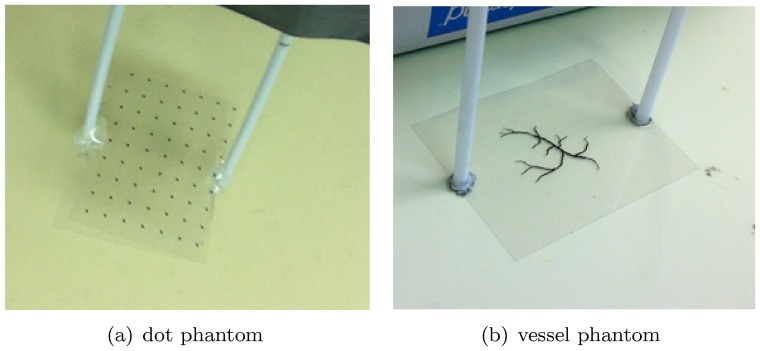
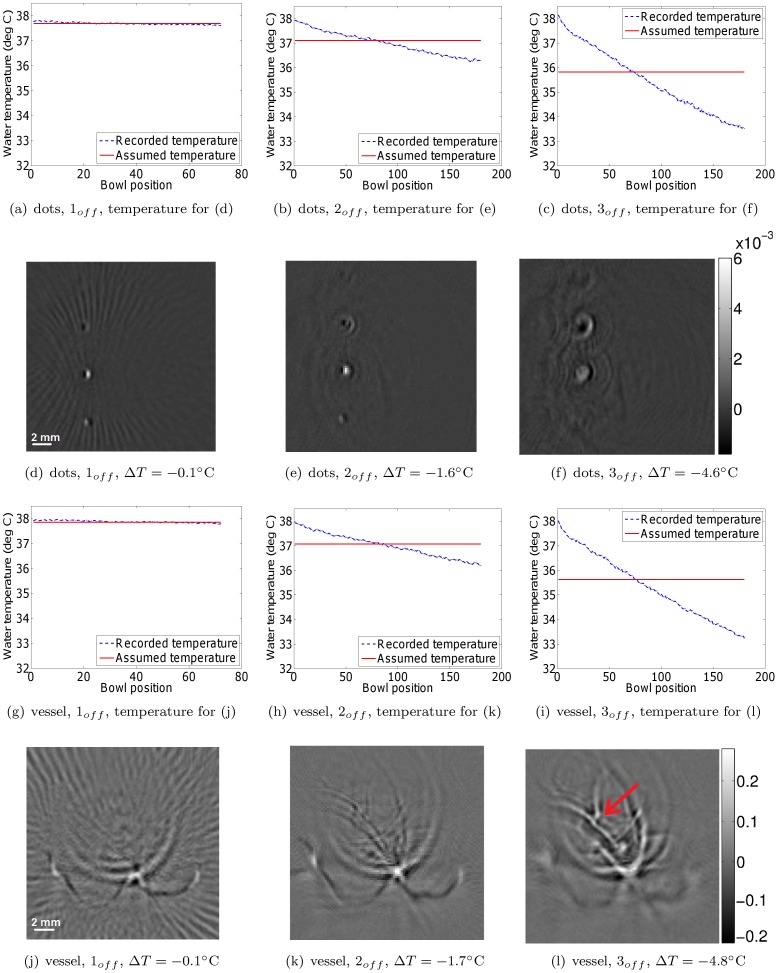
 is the drop in water temperature during the scan. For reconstruction purposes, the water temperature was assumed to be the mean of the water temperature before and after the scan. The planes of the phantoms were not perfectly aligned with the horizontal planes of the reconstruction volumes. As a result, only parts of the phantoms are visible at a time. For example, only one column of dots is visible in the dot phantom, and only part of the vessel structures are visible in the vessel phantom. MIP images that show all structures are shown in Figs. 8 and 9. We show both slices and MIP images to illustrate the difference in appearance of the speed of sound artifacts in both types of images. The red arrow in (l) indicates artifact that is visually indistinguishable from true vessel structures.
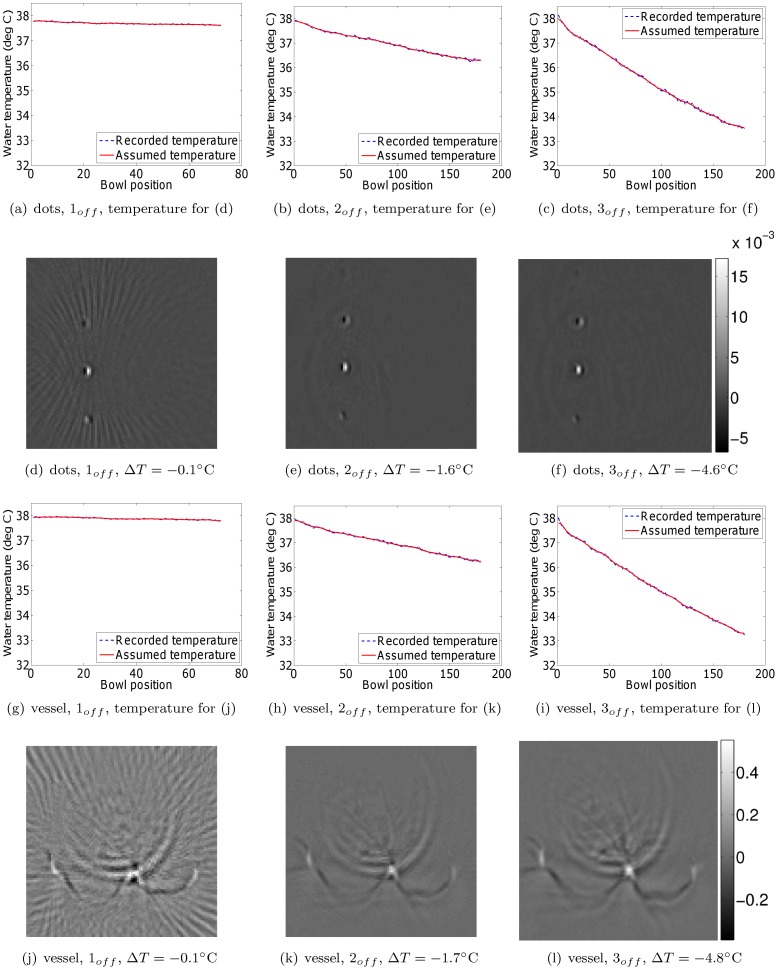
 is the drop in water temperature during the scan. For reconstruction purposes, the water temperature was adjusted for each bowl position separately, based on the temperature record of the water heating system's thermometer.
 to
to  (arbitrary units).
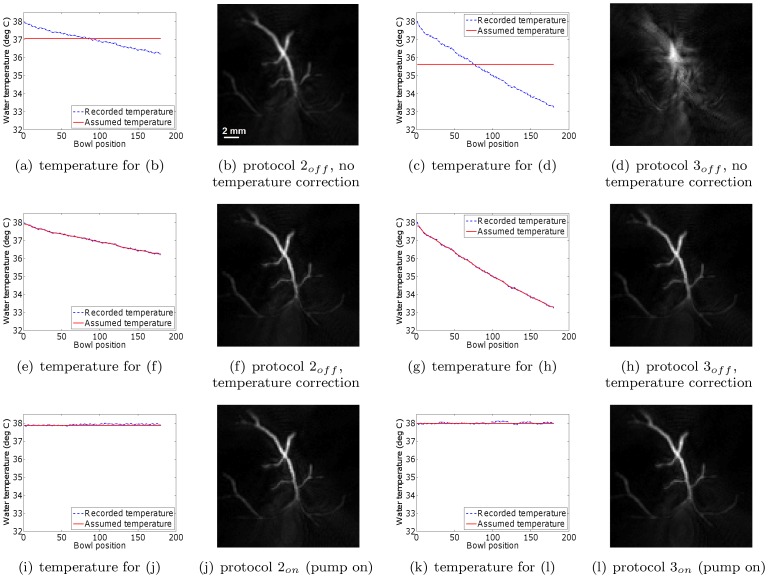
 to
to  (arbitrary units).
Similar articles
-
Calibrated Linear Array-Driven Photoacoustic/Ultrasound Tomography.Ultrasound Med Biol. 2016 Nov;42(11):2697-2707. doi: 10.1016/j.ultrasmedbio.2016.06.028. Epub 2016 Aug 12. Ultrasound Med Biol. 2016. PMID: 27523424
-
Compressed Sensing With a Gaussian Scale Mixture Model for Limited View Photoacoustic Computed Tomography In Vivo.Technol Cancer Res Treat. 2018 Jan 1;17:1533033818808222. doi: 10.1177/1533033818808222. Technol Cancer Res Treat. 2018. PMID: 30373467 Free PMC article.
-
Image reconstruction with the Heaviside equation in photoacoustic tomography accounting for dispersive acoustic media.J Biomed Opt. 2018 Jul;23(7):1-12. doi: 10.1117/1.JBO.23.7.076010. J Biomed Opt. 2018. PMID: 30027712
-
A survey of computational frameworks for solving the acoustic inverse problem in three-dimensional photoacoustic computed tomography.Phys Med Biol. 2019 Jul 18;64(14):14TR01. doi: 10.1088/1361-6560/ab2017. Phys Med Biol. 2019. PMID: 31067527 Review.
-
Spatial resolution in photoacoustic computed tomography.Rep Prog Phys. 2021 Mar 1;84(3). doi: 10.1088/1361-6633/abdab9. Rep Prog Phys. 2021. PMID: 33434890 Review.
Cited by
-
Video-rate full-ring ultrasound and photoacoustic computed tomography with real-time sound speed optimization.Biomed Opt Express. 2022 Jul 27;13(8):4398-4413. doi: 10.1364/BOE.464360. eCollection 2022 Aug 1. Biomed Opt Express. 2022. PMID: 36032563 Free PMC article.
-
Non-invasive methods for the determination of body and carcass composition in livestock: dual-energy X-ray absorptiometry, computed tomography, magnetic resonance imaging and ultrasound: invited review.Animal. 2015 Jul;9(7):1250-64. doi: 10.1017/S1751731115000336. Epub 2015 Mar 6. Animal. 2015. PMID: 25743562 Free PMC article.
-
Simultaneous visualization of tumour oxygenation, neovascularization and contrast agent perfusion by real-time three-dimensional optoacoustic tomography.Eur Radiol. 2016 Jun;26(6):1843-51. doi: 10.1007/s00330-015-3980-0. Epub 2015 Sep 3. Eur Radiol. 2016. PMID: 26334513
-
Short-wavelength optoacoustic spectroscopy based on water muting.Proc Natl Acad Sci U S A. 2020 Feb 25;117(8):4007-4014. doi: 10.1073/pnas.1910597117. Epub 2020 Feb 6. Proc Natl Acad Sci U S A. 2020. PMID: 32029585 Free PMC article.
-
A high-affinity, high-stability photoacoustic agent for imaging gastrin-releasing peptide receptor in prostate cancer.Clin Cancer Res. 2014 Jul 15;20(14):3721-9. doi: 10.1158/1078-0432.CCR-13-3405. Epub 2014 May 21. Clin Cancer Res. 2014. PMID: 24850845 Free PMC article.
References
-
- Wang X, Xu Y, Xu M, Yokoo S, Fry E, et al. (2002) Photoacoustic tomography of biological tissues with high cross-section resolution: Reconstruction and experiment. Medical physics 29: 2799. - PubMed
-
- Ku G, Wang X, Xie X, Stoica G, Wang L (2005) Imaging of tumor angiogenesis in rat brains in vivo by photoacoustic tomography. Applied optics 44: 770–775. - PubMed
-
- Razansky D (2011) Multi-Spectral Optoacoustic Tomography—Volumetric Color Hearing in Real Time. Selected Topics in Quantum Electronics, IEEE Journal of 1–1.
Publication types
MeSH terms
Substances
Grants and funding
LinkOut - more resources
Full Text Sources
Other Literature Sources
Medical
