. 2012;7(10):e46441.
doi: 10.1371/journal.pone.0046441. Epub 2012 Oct 12.

Gene-gene interaction and functional impact of polymorphisms on innate immune genes in controlling Plasmodium falciparum blood infection level

Affiliations

Gene-gene interaction and functional impact of polymorphisms on innate immune genes in controlling Plasmodium falciparum blood infection level

Madhumita Basu et al. PLoS One. 2012.

Abstract

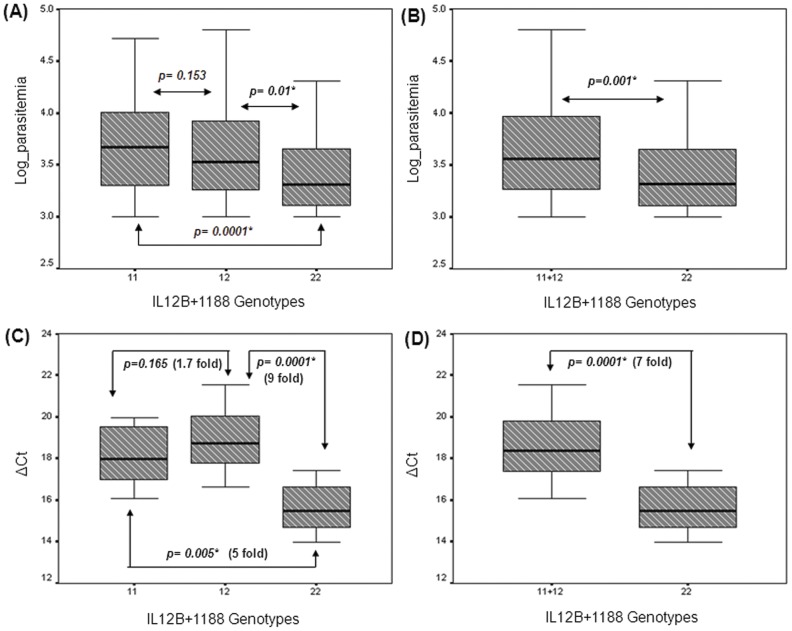
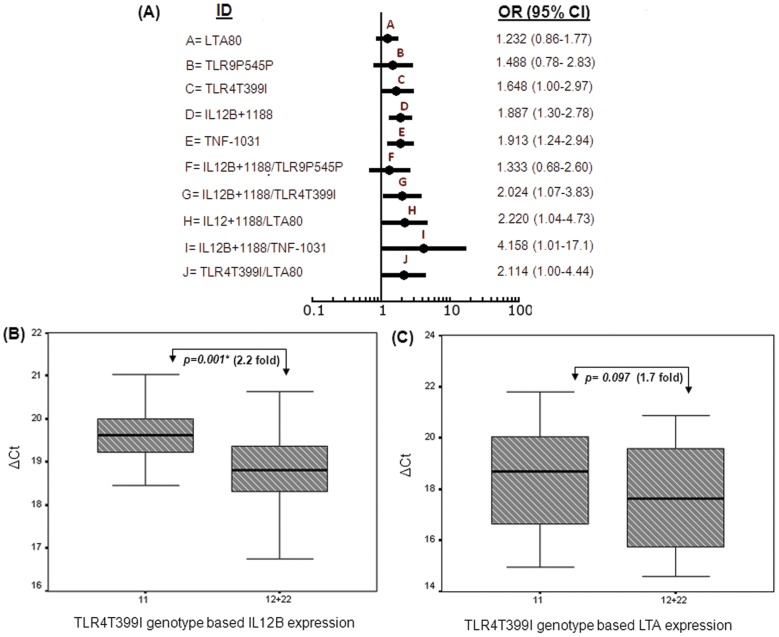
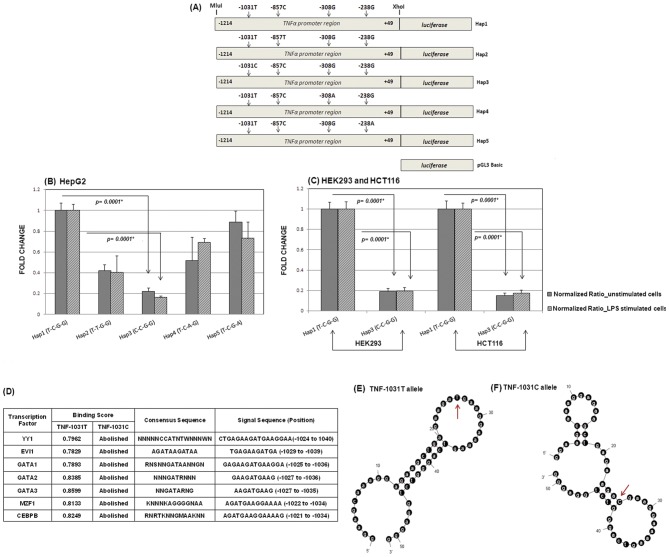
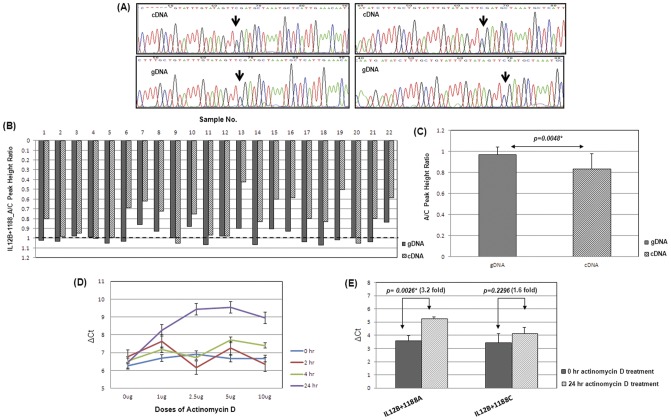
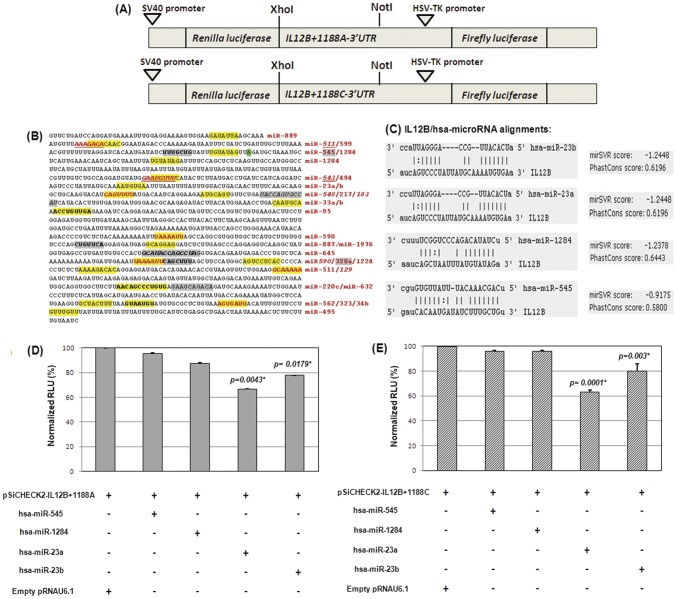
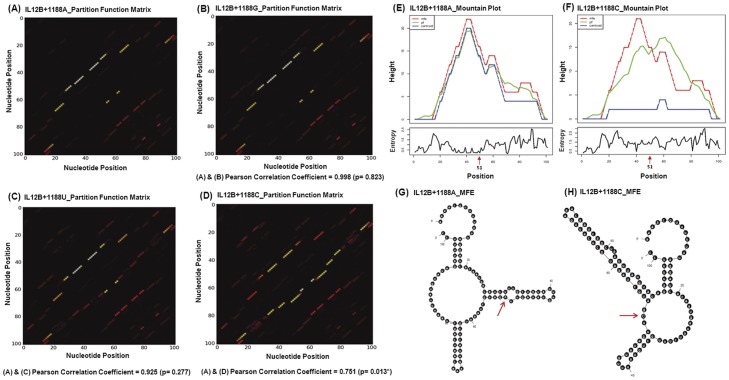
Genetic variations in toll-like receptors and cytokine genes of the innate immune pathways have been implicated in controlling parasite growth and the pathogenesis of Plasmodium falciparum mediated malaria. We previously published genetic association of TLR4 non-synonymous and TNF-α promoter polymorphisms with P.falciparum blood infection level and here we extend the study considerably by (i) investigating genetic dependence of parasite-load on interleukin-12B polymorphisms, (ii) reconstructing gene-gene interactions among candidate TLRs and cytokine loci, (iii) exploring genetic and functional impact of epistatic models and (iv) providing mechanistic insights into functionality of disease-associated regulatory polymorphisms. Our data revealed that carriage of AA (P = 0.0001) and AC (P = 0.01) genotypes of IL12B 3'UTR polymorphism was associated with a significant increase of mean log-parasitemia relative to rare homozygous genotype CC. Presence of IL12B+1188 polymorphism in five of six multifactor models reinforced its strong genetic impact on malaria phenotype. Elevation of genetic risk in two-component models compared to the corresponding single locus and reduction of IL12B (2.2 fold) and lymphotoxin-α (1.7 fold) expressions in patients'peripheral-blood-mononuclear-cells under TLR4Thr399Ile risk genotype background substantiated the role of Multifactor Dimensionality Reduction derived models. Marked reduction of promoter activity of TNF-α risk haplotype (C-C-G-G) compared to wild-type haplotype (T-C-G-G) with (84%) and without (78%) LPS stimulation and the loss of binding of transcription factors detected in-silico supported a causal role of TNF-1031. Significantly lower expression of IL12B+1188 AA (5 fold) and AC (9 fold) genotypes compared to CC and under-representation (P = 0.0048) of allele A in transcripts of patients' PBMCs suggested an Allele-Expression-Imbalance. Allele (A+1188C) dependent differential stability (2 fold) of IL12B-transcripts upon actinomycin-D treatment and observed structural modulation (P = 0.013) of RNA-ensemble were the plausible explanations for AEI. In conclusion, our data provides functional support to the hypothesis that de-regulated receptor-cytokine axis of innate immune pathway influences blood infection level in P. falciparum malaria.


Conflict of interest statement

Competing Interests: The authors have declared that no competing interests exist.

Figures

Figure 1
Figure 1. Association between IL12B+1188 genotypes with blood infection level and IL12B gene-expression represented in Box plots.
(A) Diagram represented the distribution of log-parasitemia across three genotypes: 11 (AA), 12 (AC) & 22 (CC) and (B) Diagram represented the comparison of log-parasitemia of minor homozygous genotype (CC) with AA and AC genotypic groups pooled. Statistical significance between pairwise comparisons was mentioned. (C) The ΔCt distribution of IL12B gene expression across AA (N = 24), AC (N = 28) and CC (N = 12) genotypes and (D) comparison of gene expression between IL12B+1188CC genotype and with that of AA and AC individuals pooled together determined by quantitative real time PCR. Statistical significance was determined by the Mann Whitney U test. P values and fold changes obtained for each pairwise combination were appended in each plot. (*) indicates these differences to be statistically significant. The bottom, middle line, and top of each box correspond to the 25th percentile, median, and the 75th percentile, respectively. Bars extend to the lowest value and to the highest value of each group.
Figure 2
Figure 2. Genetic and functional association of multifactor models obtained by Multifactorial Dimensionality Reduction analysis.
(A) Forest plots presented the comparison of risk estimates in terms of odds ratio (OR) and 95% confidence interval (CI) for significant gene-gene interaction models and component single loci. The risk corresponding to each single and two factor models was denoted by a dot and the horizontal lines represented odds ratio and 95% CI respectively. The model IDs (A–J) and respective ORs (95% CI) were given at the left and right side of each dot in the forest plot. (B) IL12B and (C) LTA gene expression in patients' PBMCs classified according to TLR4Thr399Ile genotype status by real time quantitative PCR. Distribution of ΔCt was plotted and compared between the genotypic groups. Statistical significance was determined by Mann Whitney U test. P values and corresponding fold changes obtained for each pairwise comparison were shown in the box plots. (*) indicates these differences to be statistically significant.
Figure 3
Figure 3. Results of TNF-α promoter assay.
(A) Schematic representation of reporter gene constructs for five TNF-α promoter haplotypes (Hap1–Hap5) used for transfection assays. (B) HepG2 cells (1×10⁵ cells/ml) were transiently transfected with all promoter constructs and relative luciferase activities in supernatants were measured alone (light grey) or with cells stimulated with 250 ng/ml of LPS (dark grey) after 48 hours. Activity of wild-type promoter haplotype TNF-α-Hap1 served as reference and set at one, and the variant constructs were expressed as fold changes in relation to this. Statistical significance for all pairwise comparisons was done by t-test. P values of significant differences between haplotype expressions were marked with asterisks (*). (C) Similar experiments were performed with wild-type Hap1 and variant Hap3 constructs in HEK293 and HCT116 cells and corresponding differences in promoter activities were measured. (*) indicates the significant comparisons given as P values. (D) Putative transcription factor binding profiles for TNF-1031 T allele summarizing the TFs with their binding scores, consensus and signal sequences which were completely abolished in presence of the variant (C) allele. (E & F) MFOLD derived representative DNA secondary structures encompassing 50 bp TNF-α promoter sequence. The numbers indicate the base position while the arrowhead marks the −1031 site.
Figure 4
Figure 4. IL12B 3′UTR based AEI analysis.
(A) Representative electropherograms showing the peak heights of the sequence encompassing IL12B+1188 locus in gDNA (lower panel) and cDNA (upper panel) extracted from the heterozygous (AC) patients' PBMC samples. The arrowhead indicates the +1188 site. Here A and C alleles are represented as green and blue peaks respectively. Difference in peak heights in sequences between cDNA and gDNA was evident. (B) Bar graph displays the A/C peak height ratios in individual heterozygous samples (N = 22). The dotted line indicates the baseline where the A/C ratio is one. (C) The departure of A/C peak height ratios from baseline in gDNA and cDNA were shown in the form of bar diagram. Each bar represents the mean height and corresponding standard deviation. The statistical difference of this distribution was measured by Sign test. P value has been indicated. (D) Dose-response and time-course assay of actinomycin-D treatment by real time PCR. (E) HepG2 cells (1×10⁵cells/ml) were treated with the optimum dose of actinomycin-D (5 µg/ml), harvested after 0 and 24 hours after treatment and IL12B mRNA levels were measured and corrected for GAPDH mRNA for both the wild-type and variant pSiCHECK2-3′UTR constructs. Statistical significance was measured by t-test. (*) indicates the P values to be statistically significant.
Figure 5
Figure 5. IL12B mRNA-microRNA interaction assay.
(A) Schematic representation of reporter gene constructs for IL12B 3′UTR A and C alleles used for transfection assays. (B) Entire 3′UTR region was mapped for putative microRNA binding sites. The highlighted, boldfaced and underlined segments within IL12B sequence were the seed sequences for the miRNAs. (C) Schematic representation of the score and seed position of four miRNAs on target IL12B. (D & E) Normalized luciferase relative light units (RLU) in HepG2 cells were measured for IL12B+1188 A and C allele containing pSiCHECK2 constructs with (+) and without (−) the effect of miRNAs. Co-transfection of the empty pRNAU6.1 (+) vector with pSiCHECK2-IL12B+1188 construct was set as 100% and reductions in luciferase expression in presence of four miRNAs were measured in relation to this. hsa-miR-23a and hsa-miR-23b resulted in significant reduction in luciferase activities for both pSiCHECK2-IL12B+1188A and pSiCHECK2-IL12B+1188C constructs. Statistical significance was measured with t-test. (*) indicates the P values and percentage reduction to be statistically significant.
Figure 6
Figure 6. IL12B 3′UTR polymorphism based RNA ensemble structures.
(A–D) display the SNPfold derived partition function heat maps generated for 101 nucleotide sequences harboring A (risk), G, U and C (non-risk) alleles respectively at the 51st position. The partition function matrix illustrates the base-pairing probabilities represented by dots. We estimated the pairwise Pearson correlation coefficient with respect to wild-type A allele and P values to quantify the overall modulation in the RNA structural ensemble caused by a mutation. (*) indicates the P value to be statistically significant. (E & F) show the mountain plot diagrams for IL12+1188A and C allele for 101 bases using RNAfold. The upper panel demonstrates the height vs position graph in which the red, green and blue lines depict the minimum free energy structure, the partition function of all possible RNA secondary structures and ensemble centroid structure respectively. The lower panel represents the entropy vs position profile and arrowhead denotes the 51st position, the location of A+1188C. (G & H) shows allele specific minimum free energy (MFE) conformations generated from RNA MFOLD. Numbers indicate the base position while the arrow directs the position of the polymorphic site.

Similar articles

Cited by

References

    1. World Health Organization (2011) World Malaria Report. GenevaSwitzerland: World Health Organization.
    1. Stevenson MM, Tam MF (1993) Differential induction of helper T cell subsets during blood-stage Plasmodium chabaudi AS infection in resistant and susceptible mice. Clin Exp Immunol 92: 77–83. - PMC - PubMed
    1. Taylor-Robinson AW, Phillips RS (1994) B cells are required for the switch from Th1- to Th2-regulated immune responses to Plasmodium chabaudi chabaudi infection. Infect Immun 62: 2490–2498. - PMC - PubMed
    1. Ing R, Stevenson MM (2009) Dendritic cell and NK cell reciprocal cross talk promotes gamma interferon-dependent immunity to blood-stage Plasmodium chabaudi AS infection in mice. Infect Immun 77: 770–782. - PMC - PubMed
    1. Metcalf CJ, Graham AL, Huijben S, Barclay VC, Long GH, et al. (2011) Partitioning regulatory mechanisms of within-host malaria dynamics using the effective propagation number. Science 333: 984–988. - PMC - PubMed

Publication types

Substances