. 2012;7(10):e46610.
doi: 10.1371/journal.pone.0046610. Epub 2012 Oct 10.

Of mice, birds, and men: the mouse ultrasonic song system has some features similar to humans and song-learning birds

Affiliations

Of mice, birds, and men: the mouse ultrasonic song system has some features similar to humans and song-learning birds

Gustavo Arriaga et al. PLoS One. 2012.

Abstract

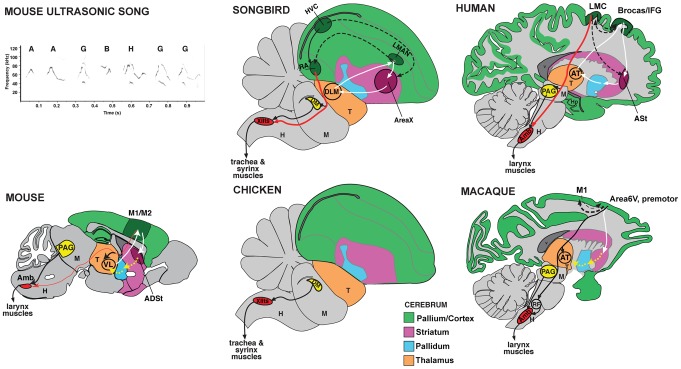
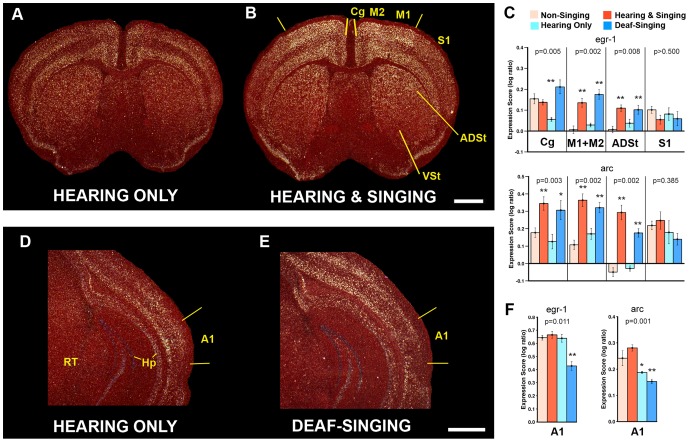
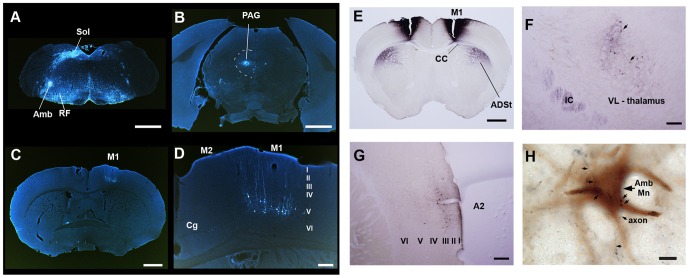
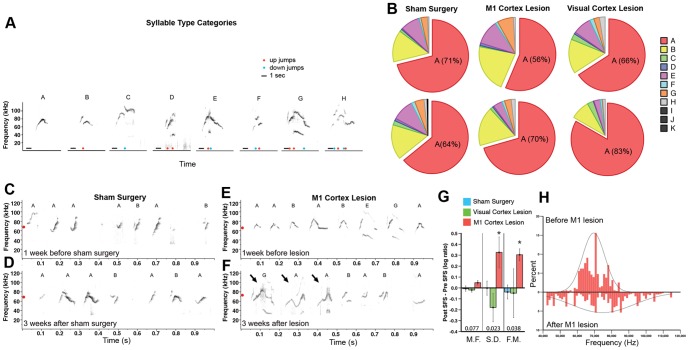
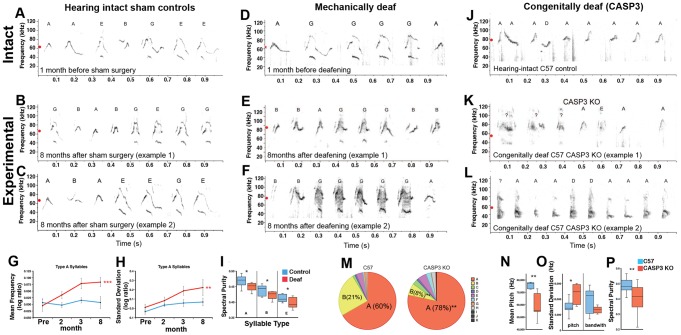
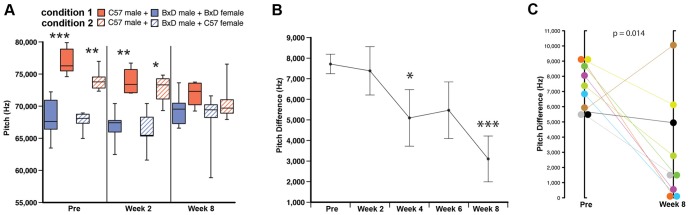
Humans and song-learning birds communicate acoustically using learned vocalizations. The characteristic features of this social communication behavior include vocal control by forebrain motor areas, a direct cortical projection to brainstem vocal motor neurons, and dependence on auditory feedback to develop and maintain learned vocalizations. These features have so far not been found in closely related primate and avian species that do not learn vocalizations. Male mice produce courtship ultrasonic vocalizations with acoustic features similar to songs of song-learning birds. However, it is assumed that mice lack a forebrain system for vocal modification and that their ultrasonic vocalizations are innate. Here we investigated the mouse song system and discovered that it includes a motor cortex region active during singing, that projects directly to brainstem vocal motor neurons and is necessary for keeping song more stereotyped and on pitch. We also discovered that male mice depend on auditory feedback to maintain some ultrasonic song features, and that sub-strains with differences in their songs can match each other's pitch when cross-housed under competitive social conditions. We conclude that male mice have some limited vocal modification abilities with at least some neuroanatomical features thought to be unique to humans and song-learning birds. To explain our findings, we propose a continuum hypothesis of vocal learning.


Conflict of interest statement

Competing Interests: The authors have declared that no competing interests exist.

Figures

Figure 1
Figure 1. Brain systems for vocalization in birds and mammals.
A, Typical ultrasonic song segment (sonogram) of a male B6D2F1/J (BxD) mouse produced in response to presentation of female urine. Multiple distinct syllables (letters) are produced in long sequences (sometimes over 30 sec), but only 1 second is shown so that the frequency contours and nonlinearities of individual units can be resolved. The sonogram was generated from Audio S1. B–C, Summary diagrams of vocal learning systems in songbirds and proposed pathway in humans . Red arrows, the direct forebrain projection to vocal motor neurons in the brainstem (RA to XIIts in song learning birds; Laryngeal motor cortex [LMC] to Amb in humans) , , , . White lines, anterior forebrain premotor circuits, including cortico-striatal-thalamic loops. Dashed lines, connections between the anterior forebrain and posterior vocal motor circuits. D–E, The direct cortico-bulbar projection is said to be absent in vocal non-learners such as chickens and monkeys. Monkeys possess an indirect cortical pathway to Amb , but this circuit does not appear to influence programming of vocalizations . F, Summary diagram of mouse song system connectivity discovered in this study. Two pathways converge on Amb: one originating from the periaqueductal grey (PAG) and one from M1 (red arrow) similar to humans (C). Yellow lines indicate proposed connections for cortico-striatal-thalamic loop that need to be tested. Auditory input is not shown. All diagrams show the sagittal view. Abbreviations: ADSt, anterior dorsal striatum; Amb, nucleus ambiguous; Area 6V, ventral part of Area 6 premotor cortex; Area X, a song nucleus of the striatum; ASt, anterior striatum; AT, anterior thalamus; DLM, dorsalateral nucleus of the mesencephalon; DM, dorsal medial nucleus of the midbrain; H, hindbrain; Hp, hippocampus; HVC – letter based name; IFG, inferior frontal gyrus; LMAN, lateral magnocellular nucleus of the anterior nidopallium; LMC, laryngeal motor cortex; M, midbrain; M1, primary motor cortex; M2, secondary motor cortex; nXIIts, 12th tracheosynringeal motor neurons; PAG, periaqueductal grey; RA, robust nucleus of the arcopallium; RF, reticular formation; T, thalamus; VL, ventral lateral nucleus of the thalamus.
Figure 2
Figure 2. Behavioral-molecular mapping of mouse song system forebrain areas.
A–B, Dark-field images of cresyl violet stained (red) coronal brain sections showing in-situ hybridization of singing-induced egr1 expression (white) in the forebrain of male mice. The Hearing Only animal heard playbacks of USVs for 30 min. The Hearing & Singing animal sang 4,304 syllables in 30 min. Yellow lines mark the edges of the motor region with singing-driven gene expression. C, egr-1 and arc expression scores (log10 ratios normalized to the ventral striatum, see methods) for the four groups in five brain regions. D–E, Primary auditory cortex (A1; one hemisphere) of animals from the Hearing Only and Deaf-Singing groups. F, egr-1 and arc expression scores in A1 normalized to the midbrain reticular nucleus (RT). Kruskal-Wallis H-tests were used to test for mean differences across all groups in each region (n = 5 per group; p values reported on graphs), followed by the Mann-Whitney U to directly test differences between each group relative to Non-Singing controls (* = p<0.05, ** = p<0.01). Data are reported as means ± s.e.m. Scale bars, 1 mm. Additional data and arc in-situ hybridizations are shown in Figure S1. Abbreviations: A1, primary auditory cortex; ADSt, anterior dorsal striatum; Cg, cingulate cortex; Hp, hippocampus; M1, primary motor cortex; M2, secondary motor cortex; RT, reticular nucleus; S1, primary somatosensory cortex; VSt, ventral striatum.
Figure 3
Figure 3. Mouse song system connectivity.
A, Transynaptic PRV-Bartha expressing eGFP (white) in Amb from an injection in laryngeal muscles; tracer jumped to the surrounding reticular formation (RF) and solitary nucleus (Sol); color inverted from original brightfield image. B, Labeled cells bodies in the vocal part of the peri-aqueductal grey (PAG) of the same animal. C, Localized labeled layer V pyramidal neurons in the singing activated region of M1 of the same animal. D, Higher magnification of the cells in (C). E, Bilateral BDA injections (black) fill laryngeally connected M1 and reveal a dense projection to ADSt. F, M1 axons in the internal capsule (IC) with some terminations in VL of the thalamus; VL also has retrogradely filled neurons (arrows) that project to M1. G, Backfilled layer III cells of secondary auditory cortex (A2) from the same animal in (E). The auditory cortex region was verified with cytochrome oxidase label (not shown). H, Fine caliber M1 axons (black arrows) contact CTb-labeled laryngeal Amb motor neurons (MN; brown) from the same animal in (E). All sections are coronal. Scale bars: 1 mm for A,C,E; 200 µm for B,D,G,H; 10 µm for H. Abbreviations, the same as Figure 2 legend; additional abbreviations: CC, corpus collusm; Sol, solitary nucleus; IC, internal capsule; RF, reticular formation.
Figure 4
Figure 4. Song production following lesion of laryngeally connected motor cortex.
A, Syllable category types from courtship USV of adult male BxD mice. A syllable is a series of one or more notes (continuous uninterrupted sound) and the corresponding sequence of instantaneous jumps (>10 kHz) in the dominant pitch ; blue dots - ‘Up’ jumps; red dots - ‘Down’ jumps. Because a jump is defined based on the instantaneous peak frequency, the harmonics in some notes are not considered for classification. Scale bar: 20 ms. B, Pie charts of syllable repertoire composition (categories in panel A) of male mice in each of the three surgery groups (n = 6 Sham surgery; n = 5 M1 Cortex Lesion; n = 4 Visual Cortex Lesion). C–F, Sonograms of male USVs before and after sham surgery or laryngeally connected M1 lesion (pitch-shifted recordings in Audios S2–5). Red dots, average pitch. Arrows point to examples of syllables with increased modulation relative to before M1 lesions. G, Spectral feature scores (SFS; expressed as log-ratio) for the mean frequency (M.F.) of the pitch, standard deviation (S.D.) of the pitch distribution, and frequency modulation (F.M.) for Type A syllables before and after surgery (* = p<0.05; Mann-Whitney U Test). Data are plotted as means ± s.e.m, from an average of 1731±381 s.e.m. Type A syllables per animal. H, Example difference in the distribution (in percent) of pitch (in Hz) in one male for type A syllables before and after M1 lesions.
Figure 5
Figure 5. Effects of deafening on mouse song.
A–F, Sonograms of pre- and post-surgical USVs from hearing-intact and deafened males showing the shift in mean pitch (red dots) and spectral deterioration of post-deafened songs (sonograms correspond to Audios S6–11). G–H, Mean frequency & standard deviation of the pitch of Type A syllables (expressed as spectral feature scores, SFS, a log-ratio) over 8 post-operative months (** = p<0.01, *** = p<0.001; repeated measures ANOVA with the Bonferroni-Dunn post-hoc test comparing within-group means across recording months; n = 5 per group). Data are plotted as means ± s.e.m. I, Box plot of spectral purity of the most common syllable types (Types A, B, and E) in deaf and control groups 8 months after surgery (* = p<0.05; Mann-Whitney U-test between groups; n = 5 per group). Data in G–I are from an average of 3266±536 s.e.m. Type A syllables per animal per month. J–L, Sonograms of wild-type B6 and CASP3 KO male USVs (sonograms correspond to Audios S12–14). M, Pie charts of syllable repertoire composition for B6 and CASP3 KO songs (* = p<0.05; ** = p<0.01; Mann-Whitney U-test; n = 8 B6 and n = 6 CASP3 KO). N–O, Box plots of pitch-based features of Type A syllables from the same B6 and CASP3 KO adult males (* = p<0.05; ** = p<0.01; Mann-Whitney U-test). P, Box plot of spectral purity of Type A, B, and E syllables combined from B6 and CASP3 KO males. Box plots show the median, 1st and 3rd quartile, and full range. Data in N-P are from an average of 237±109 s.e.m. Type A syllables per animal per group.
Figure 6
Figure 6. Pitch convergence in B6+BxD male pairs housed with either a B6 or BxD female.
A, Box plots of Type A syllable pitch from the songs of B6 and BxD males before and over 8 weeks of cross-strain paired housing with either a BxD female (solid boxes) or B6 female (striped boxes) (* = p<0.05; ** = p<0.01; *** = p<0.001; Mann-Whitney U-test; n = 4–7 per time point depending on obtaining a sufficient amount of song). Box plots show the median, 1st and 3rd quartile, and full range. B, The mean pitch difference of Type A syllables between the two males in each B6-BxD pair before and over 8 weeks of cross-strain paired housing (* = p<0.05; *** = p<0.001; Student's t-test; Pre: n = 12; Week 2: n = 9; Week 4: n = 6; Week 6: n = 8; Week 8: n = 9; data are plotted as means ± s.e.m.) C, Same pre and post data as in (B), but plotted for individual pairs from before (Pre) and at 8 weeks after cross-strain paired housing (p-value reported on the graph; paired Student's t-test; n = 9). Data are from an average of 616±84 s.e.m. Type A syllables per animal per week.

References

    1. Fischer J, Hammerschmidt K (2010) Ultrasonic vocalizations in mouse models for speech and socio-cognitive disorders: insights into the evolution of vocal communication. Genes Brain Behav 10: 17–27 doi:10.1111/j.1601-183X.2010.00610.x. - PMC - PubMed
    1. Holy TE, Guo Z (2005) Ultrasonic songs of male mice. PLoS Biol 3: e386 doi:10.1371/journal.pbio.0030386. - PMC - PubMed
    1. Kroodsma DE, Konishi M (1991) A suboscine bird (eastern phoebe, Sayornis phoebe) develops normal song without auditory feedback. Anim Behav 42: 477–487.
    1. Arriaga G, Jarvis ED (2012) Mouse vocal communication system: are ultrasounds learned or innate? Brain Lang Accepted - PMC - PubMed
    1. Janik VM, Slater PJB (1997) Vocal learning in mammals. Adv Stud Behav 26: 59–99.

Publication types

MeSH terms

Substances