

Framing the Salmonidae family phylogenetic portrait: a more complete picture from increased taxon sampling
- PMID: 23071608
- PMCID: PMC3465342
- DOI: 10.1371/journal.pone.0046662
Framing the Salmonidae family phylogenetic portrait: a more complete picture from increased taxon sampling
Abstract
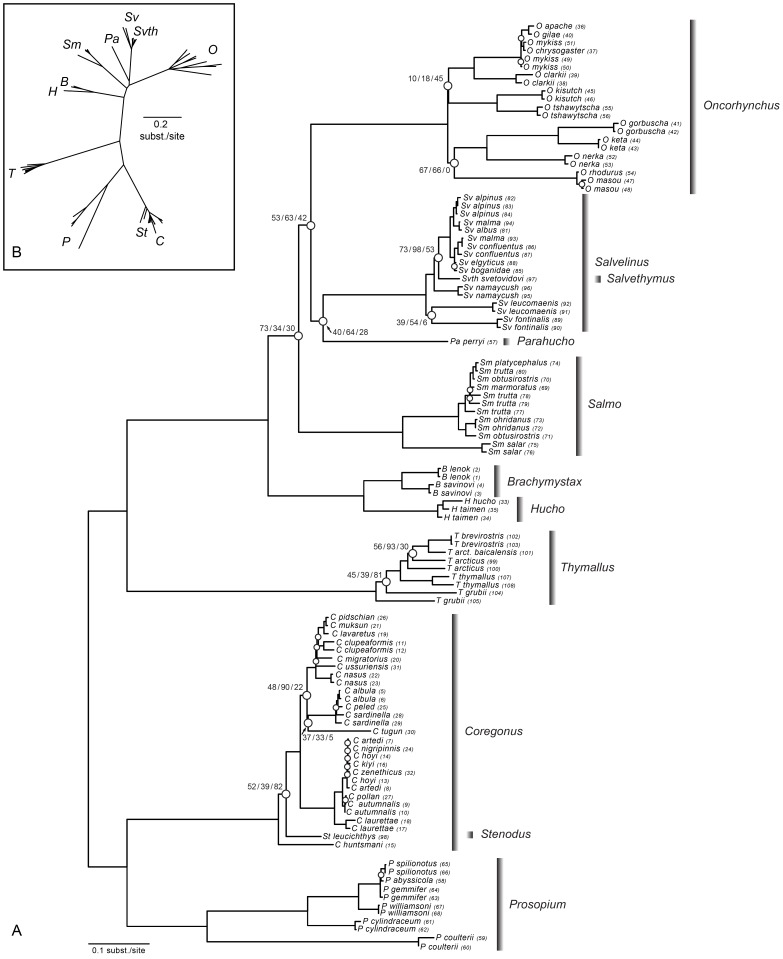
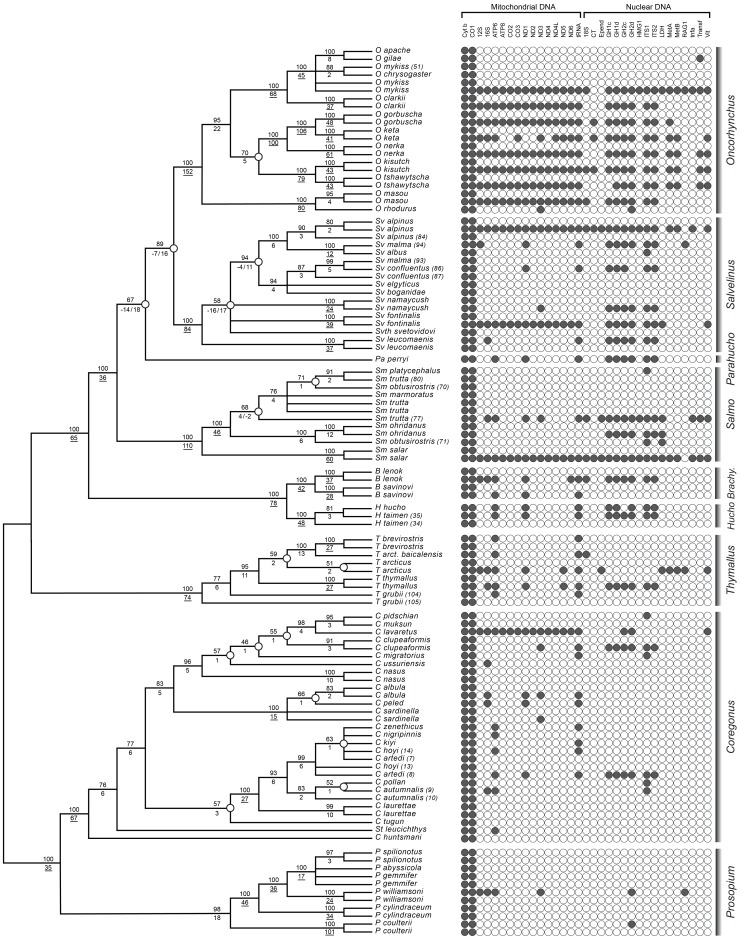
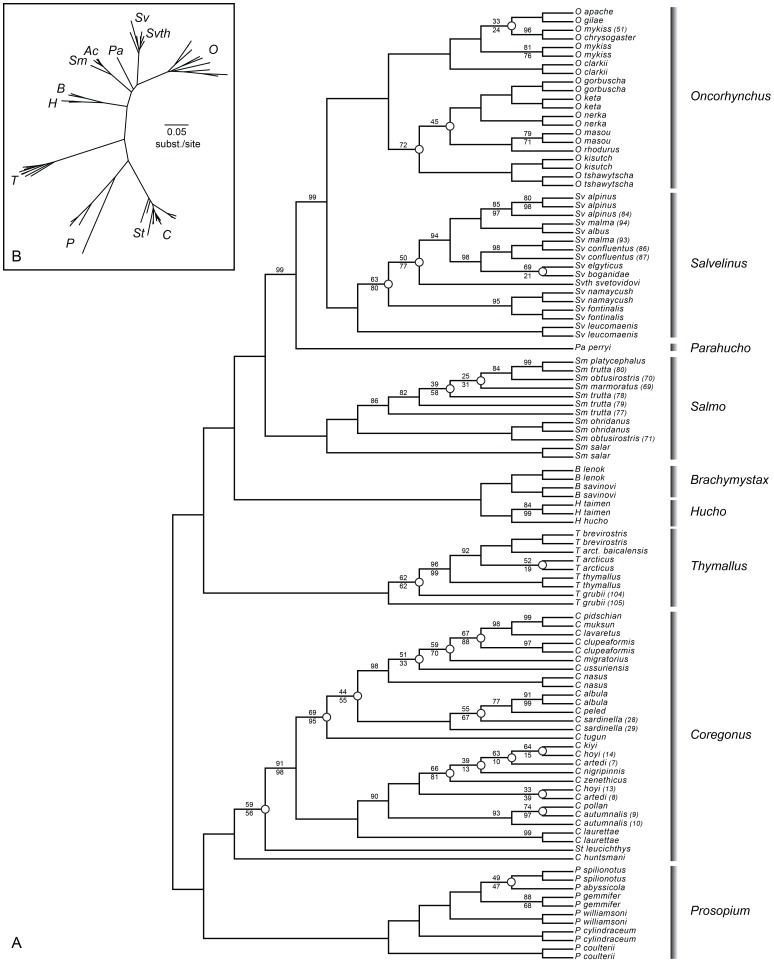
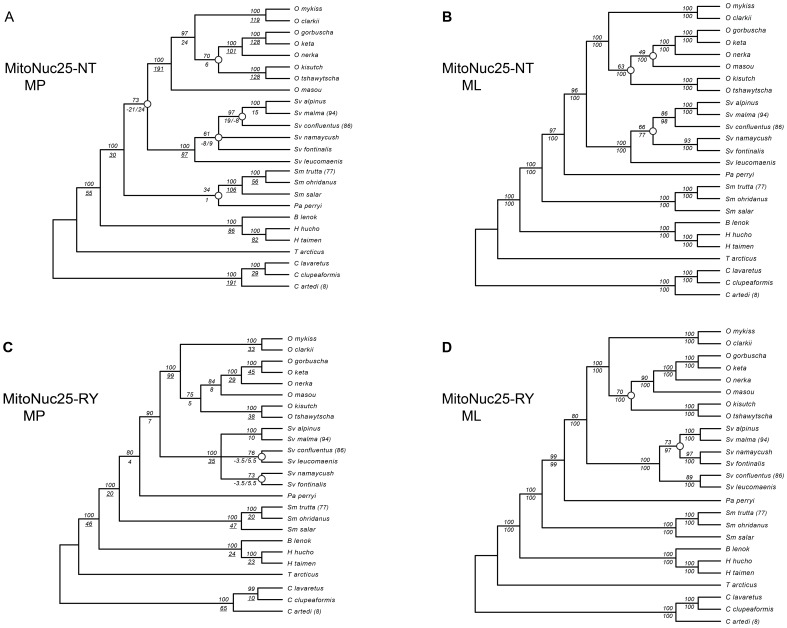
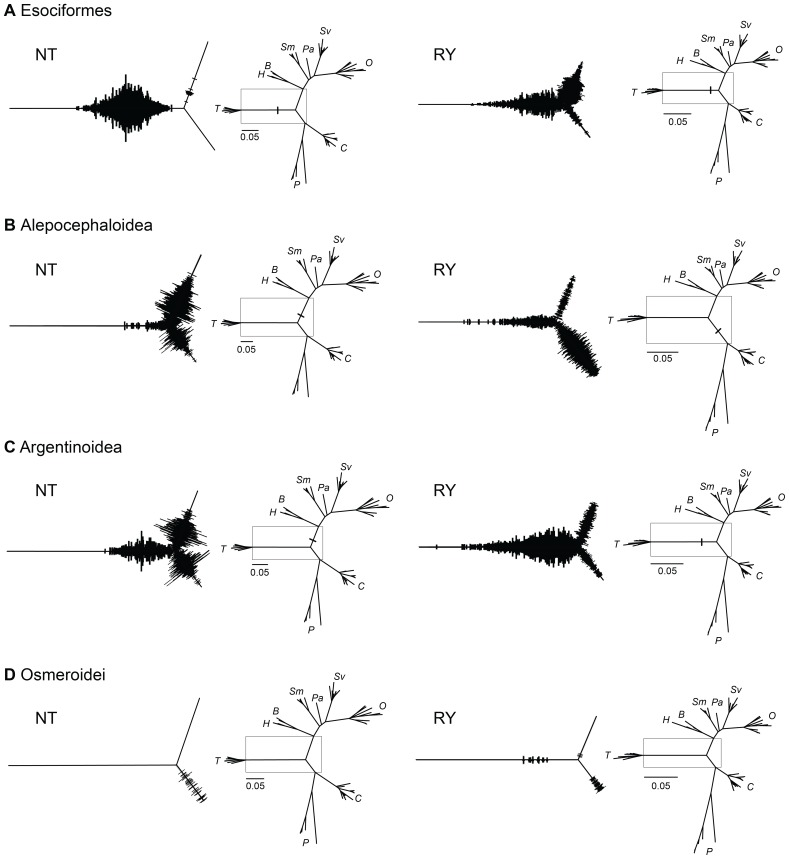
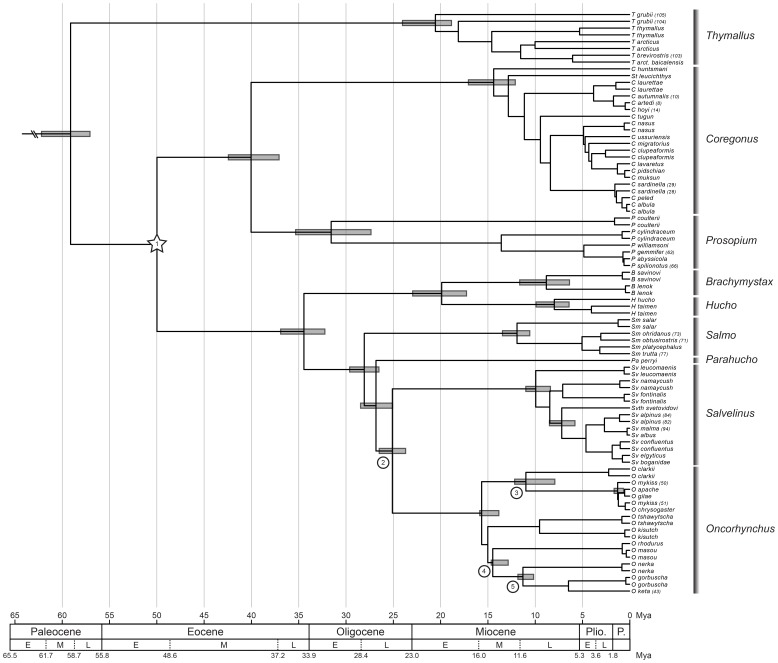
Considerable research efforts have focused on elucidating the systematic relationships among salmonid fishes; an understanding of these patterns of relatedness will inform conservation- and fisheries-related issues, as well as provide a framework for investigating evolutionary mechanisms in the group. However, uncertainties persist in current Salmonidae phylogenies due to biological and methodological factors, and a comprehensive phylogeny including most representatives of the family could provide insight into the causes of these difficulties. Here we increase taxon sampling by including nearly all described salmonid species (n = 63) to present a time-calibrated and more complete portrait of Salmonidae using a combination of molecular markers and analytical techniques. This strategy improved resolution by increasing the signal-to-noise ratio and helped discriminate methodological and systematic errors from sources of difficulty associated with biological processes. Our results highlight novel aspects of salmonid evolution. First, we call into question the widely-accepted evolutionary relationships among sub-families and suggest that Thymallinae, rather than Coregoninae, is the sister group to the remainder of Salmonidae. Second, we find that some groups in Salmonidae are older than previously thought and that the mitochondrial rate of molecular divergence varies markedly among genes and clades. We estimate the age of the family to be 59.1 MY (CI: 63.2-58.1 MY) old, which likely corresponds to the timing of whole genome duplication in salmonids. The average, albeit highly variable, mitochondrial rate of molecular divergence was estimated as ~0.31%/MY (CI: 0.27-0.36%/MY). Finally, we suggest that some species require taxonomic revision, including two monotypic genera, Stenodus and Salvethymus. In addition, we resolve some relationships that have been notoriously difficult to discern and present a clearer picture of the evolution of the group. Our findings represent an important contribution to the systematics of Salmonidae, and provide a useful tool for addressing questions related to fundamental and applied evolutionary issues.
Conflict of interest statement
Figures
Similar articles
-
[Phylogeny of salmonids (Salmoniformes, Salmonidae) and molecular dating: analysis of mtDNA data].Genetika. 2013 Jun;49(6):718-34. doi: 10.7868/s0016675813060118. Genetika. 2013. PMID: 24450195 Russian.
-
Grayling (Thymallinae) phylogeny within salmonids: complete mitochondrial DNA sequences of Thymallus arcticus and Thymallus thymallus.J Fish Biol. 2010 Feb;76(2):395-400. doi: 10.1111/j.1095-8649.2009.02494.x. J Fish Biol. 2010. PMID: 20738715
-
Targeted sequencing for high-resolution evolutionary analyses following genome duplication in salmonid fish: Proof of concept for key components of the insulin-like growth factor axis.Mar Genomics. 2016 Dec;30:15-26. doi: 10.1016/j.margen.2016.06.003. Epub 2016 Jun 23. Mar Genomics. 2016. PMID: 27346185
-
Salmonidae Genome: Features, Evolutionary and Phylogenetic Characteristics.Genes (Basel). 2022 Nov 27;13(12):2221. doi: 10.3390/genes13122221. Genes (Basel). 2022. PMID: 36553488 Free PMC article. Review.
-
[Genetic History of Salmonid Fishes of the Genus Oncorhynchus].Genetika. 2015 May;51(5):584-99. Genetika. 2015. PMID: 26137638 Review. Russian.
Cited by
-
Genetic signs of multiple colonization events in Baltic ciscoes with radiation into sympatric spring- and autumn-spawners confined to early postglacial arrival.Ecol Evol. 2014 Nov;4(22):4346-60. doi: 10.1002/ece3.1299. Epub 2014 Oct 27. Ecol Evol. 2014. PMID: 25540695 Free PMC article.
-
A well-constrained estimate for the timing of the salmonid whole genome duplication reveals major decoupling from species diversification.Proc Biol Sci. 2014 Jan 22;281(1778):20132881. doi: 10.1098/rspb.2013.2881. Print 2014 Mar 7. Proc Biol Sci. 2014. PMID: 24452024 Free PMC article.
-
From sabers to spikes: A newfangled reconstruction of the ancient, giant, sexually dimorphic Pacific salmon, †Oncorhynchus rastrosus (SALMONINAE: SALMONINI).PLoS One. 2024 Apr 24;19(4):e0300252. doi: 10.1371/journal.pone.0300252. eCollection 2024. PLoS One. 2024. PMID: 38656950 Free PMC article.
-
Analysis of microbiota-host communication mediated by butyrate in Atlantic salmon.Comput Struct Biotechnol J. 2023 Mar 31;21:2558-2578. doi: 10.1016/j.csbj.2023.03.050. eCollection 2023. Comput Struct Biotechnol J. 2023. PMID: 37122632 Free PMC article.
-
Rapture facilitates inexpensive and high-throughput parent-based tagging in salmonids.PLoS One. 2020 Nov 11;15(11):e0239221. doi: 10.1371/journal.pone.0239221. eCollection 2020. PLoS One. 2020. PMID: 33175847 Free PMC article.
References
-
- Norden CR (1961) Comparative osteology of representative salmonid fishes, with particular reference to the grayling (Thymallus arcticus) and its phylogeny. J Fish Res Bd Can 18: 679–791.
-
- Behnke RJ (1972) The systematics of salmonid fishes of recently glaciated lakes. J Fish Res Bd Can 29: 639–671.
-
- Stearley RF, Smith GR (1993) Phylogeny of the Pacific trouts and salmons (Oncorhynchus) and genera of the family Salmonidae. Trans Am Fish Soc 122: 1–33.
-
- Phillips RB, Oakley TH (1997) Phylogenetic relationships among the Salmoninae based on nuclear and mitochondrial DNA sequences. In: Kocher TD, Stepien CA, editors. Molecular Systematics of Fishes. San Diego: Academic Press. pp. 145–162.
-
- Crespi BJ, Fulton MJ (2004) Molecular systematics of Salmonidae: combined nuclear data yields a robust phylogeny. Mol Phyl Evol 31: 658–679. - PubMed
Publication types
MeSH terms
Substances
LinkOut - more resources
Full Text Sources
Miscellaneous
