. 2012;7(10):e46966.
doi: 10.1371/journal.pone.0046966. Epub 2012 Oct 10.

Succession in the gut microbiome following antibiotic and antibody therapies for Clostridium difficile

Affiliations

Succession in the gut microbiome following antibiotic and antibody therapies for Clostridium difficile

Gregory L Peterfreund et al. PLoS One. 2012.

Abstract

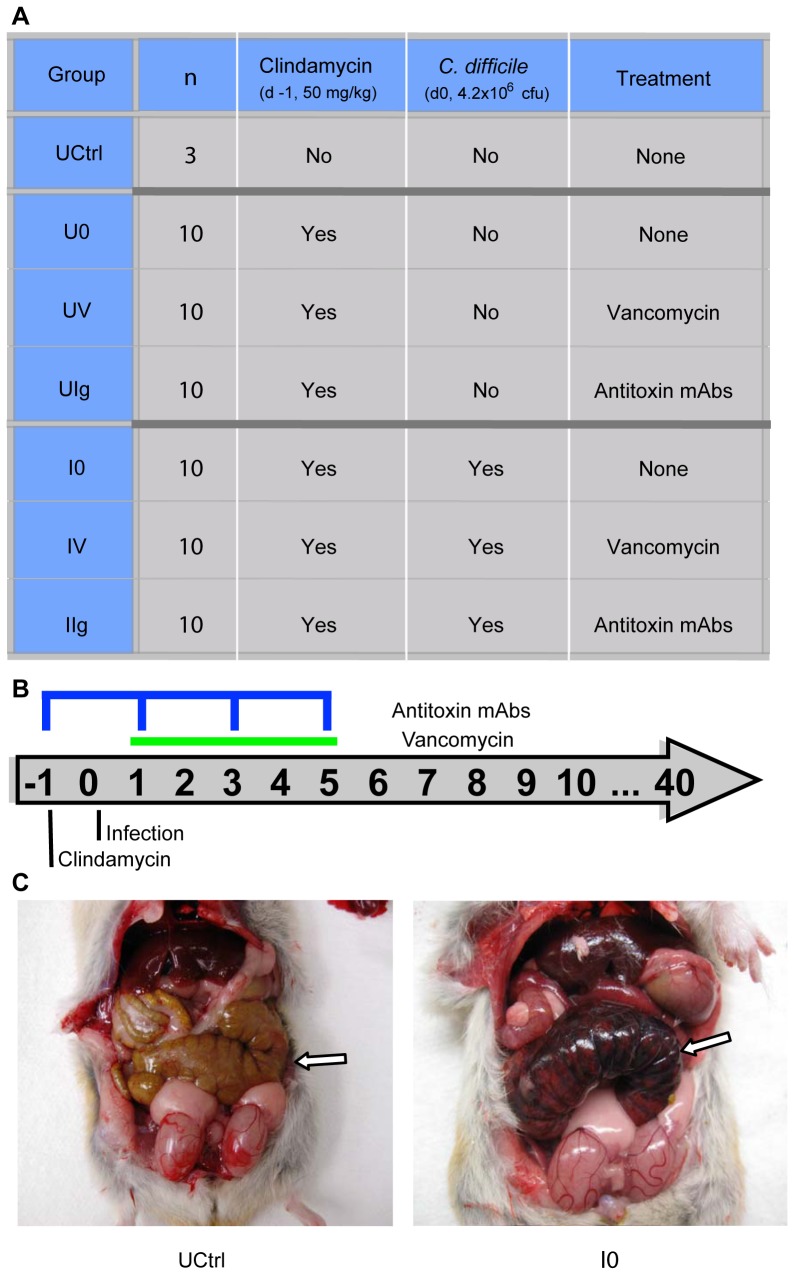
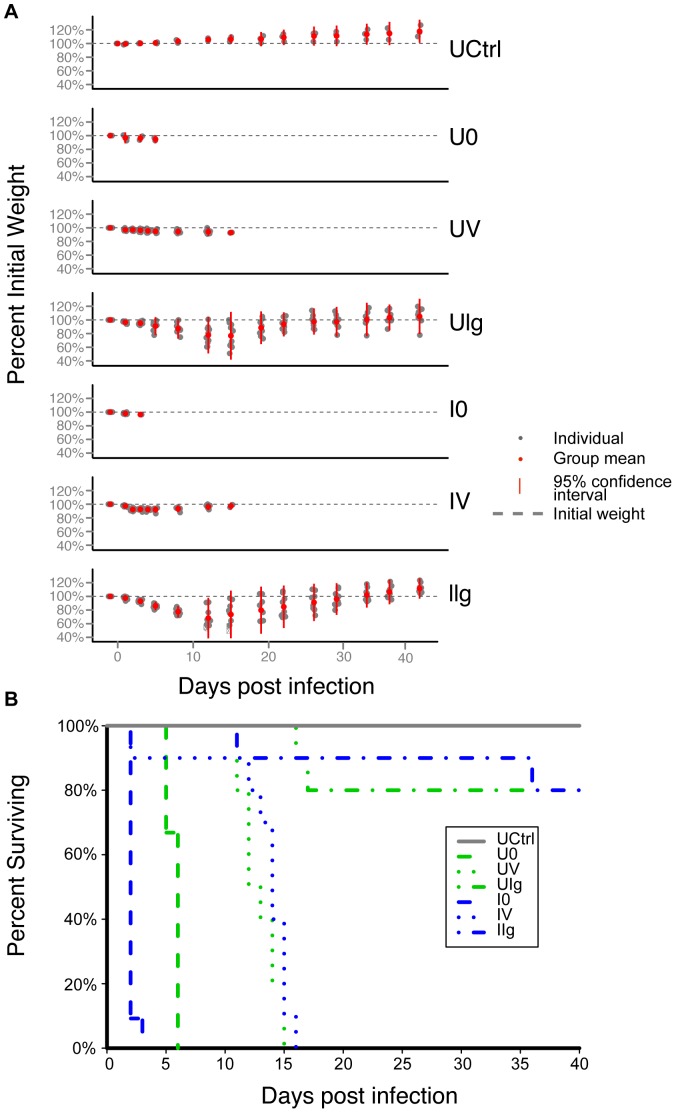
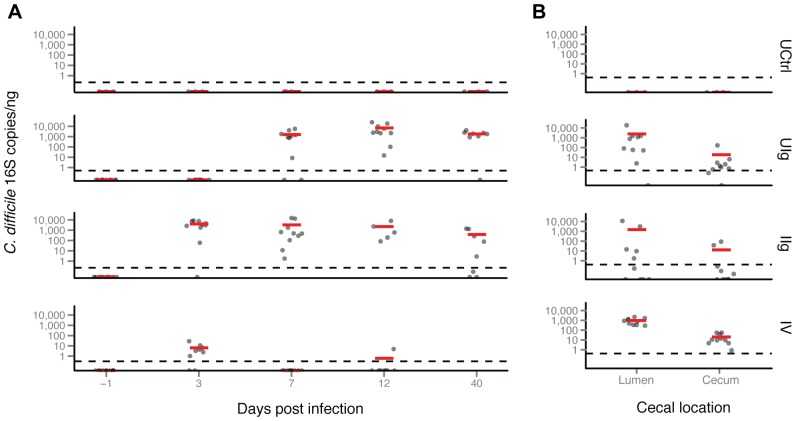
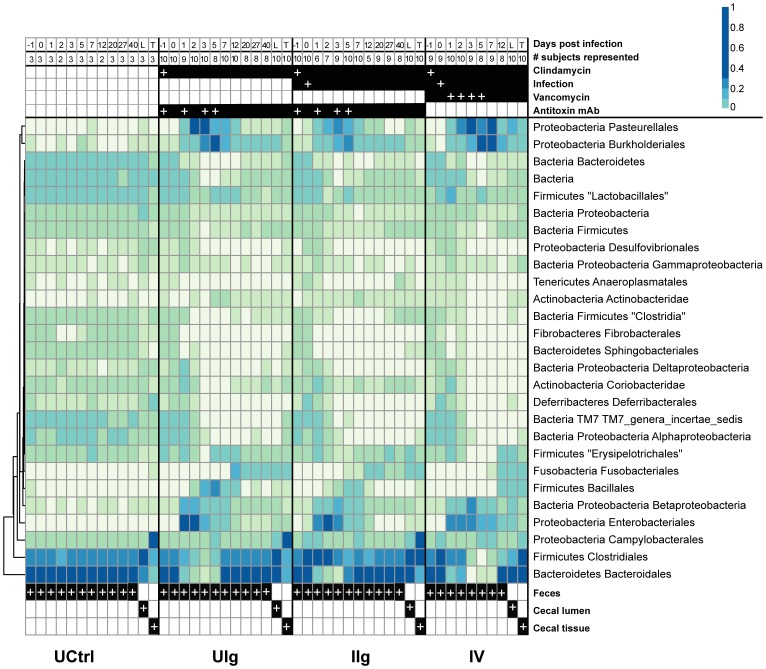
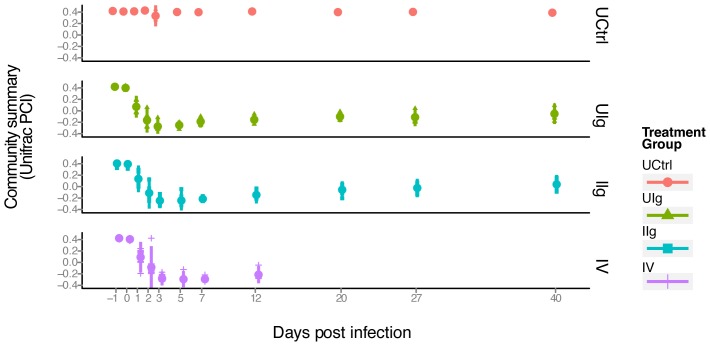
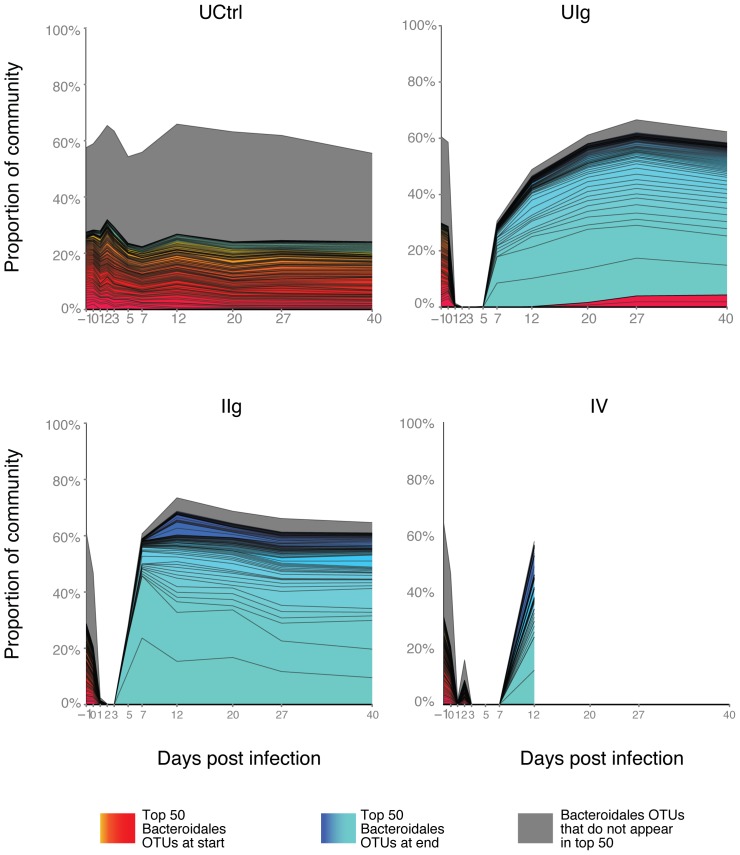
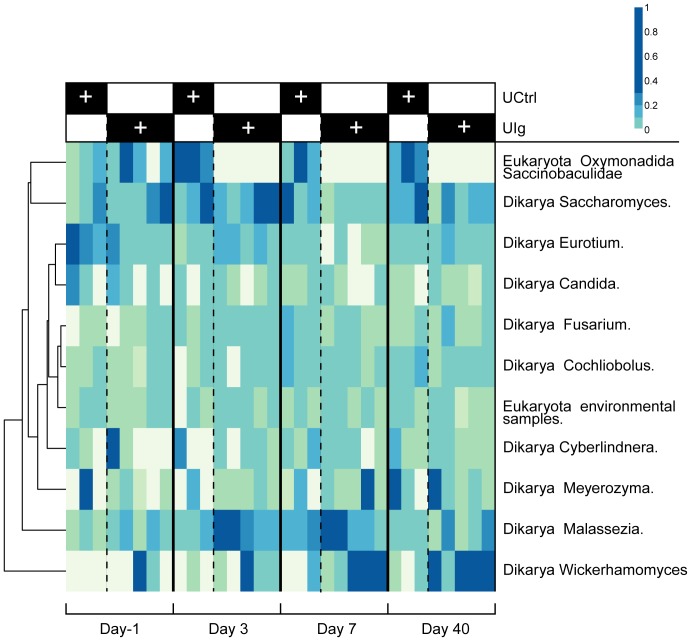
Antibiotic disruption of the intestinal microbiota may cause susceptibility to pathogens that is resolved by progressive bacterial outgrowth and colonization. Succession is central to ecological theory but not widely documented in studies of the vertebrate microbiome. Here, we study succession in the hamster gut after treatment with antibiotics and exposure to Clostridium difficile. C. difficile infection is typically lethal in hamsters, but protection can be conferred with neutralizing antibodies against the A and B toxins. We compare treatment with neutralizing monoclonal antibodies (mAb) to treatment with vancomycin, which prolongs the lives of animals but ultimately fails to protect them from death. We carried out longitudinal deep sequencing analysis and found distinctive waves of succession associated with each form of treatment. Clindamycin sensitization prior to infection was associated with the temporary suppression of the previously dominant Bacteroidales and the fungus Saccinobaculus in favor of Proteobacteria. In mAb-treated animals, C. difficile proliferated before joining Proteobacteria in giving way to re-expanding Bacteroidales and the fungus Wickerhamomyces. However, the Bacteroidales lineages returning by day 7 were different from those that were present initially, and they persisted for the duration of the experiment. Animals treated with vancomycin showed a different set of late-stage lineages that were dominated by Proteobacteria as well as increased disparity between the tissue-associated and luminal cecal communities. The control animals showed no change in their gut microbiota. These data thus suggest different patterns of ecological succession following antibiotic treatment and C. difficile infection.


Conflict of interest statement

Competing Interests: Authors AM and WO are or have been employees of Progenics, developer of the antitoxin antibody used in this study. Progenics has submitted patent applications for these antibodies. Progenics contracted Ricerca to carry out the animal experimentation on their behalf. The project was designed by the authors' lab and author AM from Progenics with input on feasibility and cost from Ricerca. All animal handling, infection, and sample generation were carried out by Ricerca as directed by AM and Progenics. There are no products in development or marketed products to declare. This does not alter the authors' adherence to all the PLOS ONE policies on sharing data and materials.

Figures

Figure 1
Figure 1. Experimental design and pathology.
(A) Hamsters were divided into seven groups, corresponding to one untreated control group (n = 3) and two clindamycin-treated arms with and without C. difficile challenge. Within each arm, hamsters were divided into three treatment groups- none, vancomycin, and antitoxin monoclonal antibody (n = 10 per treatment group). (B) Timeline of interventions. Clindamycin, C. difficile, vancomycin (green bar), and mAb (blue indicator) were given to the designated groups on the days indicated. (C) Gross pathology of Golden Syrian hamsters. Arrow indicates the cecum. [Left] Untreated control (UCtrl) animal on day 40; [Right] Infected, no treatment (I0) animal on day 2. The cecum of the infected, untreated hamster is enlarged, hyperemic, inflamed, and partially necrotic.
Figure 2
Figure 2. Natural history of infection includes weight loss and high mortality rate.
(A) Mean change in percent weight per group over the course of the experiment. Deceased hamsters were dropped from the plot. Red dot- mean weight as percent of initial; gray dot- individual weight as percent of initial; red bar- range within 2 standard deviations of the mean; gray dashed line- original weight. (B) Kaplan-Meier survival curve. Untreated control (UCtrl) hamsters survived the duration of the study. Both infected and uninfected untreated animals showed 100% mortality within six days. One animal died in both vancomycin-treated groups on day 2, while the rest of the animals survived between 11 and 16 days post infection, approximately one week after cessation of treatment. Two animals died in the uninfected, mAb-treated group, and one animal died in the infected, mAb-treated group about two weeks post infection. One more hamster from the infected, mAb-treated group died shortly before the end of the experiment and the rest survived until they were euthanized on day 40.
Figure 3
Figure 3. C. difficile-specific Taqman qPCR analysis of hamster feces and ceca.
(A) A custom qPCR specific for C. difficile DNA was consistently negative for all tested samples from the untreated control group of hamsters. C. difficile DNA in the UIg group rises above the limit of detection by day 7 and remains elevated. The infected hamsters have a detectable spike by day 3 despite having no detectable C. difficile initially. The mAb-treated groups have near-complete survival to day 40 despite having a significant pathogen DNA burden as determined by PCR analysis. Vancomycin-treated animals have a lower spike by day 3 that falls below the limit of detection for most of the subsequent samples. (B) C. difficile 16S RNA copies were detected in luminal and cecal samples. Red bar- group mean 16S copies/ng DNA; gray dots- individual mean 16S copies/ng DNA. Limit of detection is 27 copies per reaction, or ca. 7.9×10³ C. difficile genome equivalents per gram of dry weight feces assuming perfect recovery.
Figure 4
Figure 4. Taxonomic heatmap of fecal and cecal bacterial communities demonstrating large-scale community shift and multiple waves of succession following clindamycin administration.
Heatmap showing relative abundance of taxa as a percent of total 16S rRNA tag reads. Each column represents the read-aggregated mean community for that treatment group and day, each row represents a taxon. The uninfected, clindamycin-naïve group is mostly stable and homogenous for the entirety of the experiment, while clindamycin induces a large-scale perturbation in the microbiota. The numbers of animals and the treatments are shown at the top (white plus (“+”) signs indicate dates of administration) and sample origin at the bottom. Proportion contributed by each taxon is shown by the color scale at the top right.
Figure 5
Figure 5. PCoA analysis displaying the community structure through clindamycin treatment and recovery.
The x-axis indicates time, the y-axis indicates the value of the first principal coordinate, a summary of the UniFrac matrix of distances between bacterial communities. The color code for the different groups is shown to the lower right. Each point represents the community of one animal on one day and the large colored dot on each day is the mean. Red dots- untreated control group; green triangles- UIg; teal squares- IIg; purple plus signs- IV. Vertical bar- range of two standard deviations from the mean.
Figure 6
Figure 6. Divergent Bacteroidales present in the hamster gut at the beginning and end of the study.
The 50 most abundant Bacteroidales OTUs from each group were identified at the beginning and the end of the study and marked–red indicates Bacteroidales OTUs predominant at the beginning, blue indicates the predominant Bacteroidales at the end of the study, grey indicates remaining, lower abundance Bacteroidales. The x-axis shows time, and the y-axis shows proportion over all bacterial lineages. OTU – color correspondence is constant for all panels.
Figure 7
Figure 7. Taxonomic heatmap of 18S OTUs demonstrating microeukaryote succession in clindamycin-treated hamsters.
Taxonomic heatmap comparing the three untreated control hamsters to five of the UIg individuals. The color code for the heat map is as in previous figures (more intense blue indicates a higher proportion).

References

    1. Armstrong TG, Wilmot AJ, Elsdon-Dew R (1950) Aureomycin and amoebic dysentery. Lancet 2: 10–12. - PubMed
    1. Backhed F, Ding H, Wang T, Hooper LV, Koh GY, et al. (2004) The gut microbiota as an environmental factor that regulates fat storage. Proc Natl Acad Sci U S A 101: 15718–15723. - PMC - PubMed
    1. Burkholder PR, McVeigh I (1942) Synthesis of Vitamins by Intestinal Bacteria. Proc Natl Acad Sci U S A 28: 285–289. - PMC - PubMed
    1. Liu Z, Miyashiro T, Tsou A, Hsiao A, Goulian M, et al. (2008) Mucosal penetration primes Vibrio cholerae for host colonization by repressing quorum sensing. Proc Natl Acad Sci U S A 105: 9769–9774. - PMC - PubMed
    1. Garner CD, Antonopoulos DA, Wagner B, Duhamel GE, Keresztes I, et al. (2009) Perturbation of the small intestine microbial ecology by streptomycin alters pathology in a Salmonella enterica serovar typhimurium murine model of infection. Infect Immun 77: 2691–2702. - PMC - PubMed

Publication types

MeSH terms

LinkOut - more resources