Pms2 suppresses large expansions of the (GAA·TTC)n sequence in neuronal tissues
- PMID: 23071719
- PMCID: PMC3469490
- DOI: 10.1371/journal.pone.0047085
Pms2 suppresses large expansions of the (GAA·TTC)n sequence in neuronal tissues
Abstract
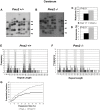
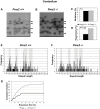
Expanded trinucleotide repeat sequences are the cause of several inherited neurodegenerative diseases. Disease pathogenesis is correlated with several features of somatic instability of these sequences, including further large expansions in postmitotic tissues. The presence of somatic expansions in postmitotic tissues is consistent with DNA repair being a major determinant of somatic instability. Indeed, proteins in the mismatch repair (MMR) pathway are required for instability of the expanded (CAG·CTG)(n) sequence, likely via recognition of intrastrand hairpins by MutSβ. It is not clear if or how MMR would affect instability of disease-causing expanded trinucleotide repeat sequences that adopt secondary structures other than hairpins, such as the triplex/R-loop forming (GAA·TTC)(n) sequence that causes Friedreich ataxia. We analyzed somatic instability in transgenic mice that carry an expanded (GAA·TTC)(n) sequence in the context of the human FXN locus and lack the individual MMR proteins Msh2, Msh6 or Pms2. The absence of Msh2 or Msh6 resulted in a dramatic reduction in somatic mutations, indicating that mammalian MMR promotes instability of the (GAA·TTC)(n) sequence via MutSα. The absence of Pms2 resulted in increased accumulation of large expansions in the nervous system (cerebellum, cerebrum, and dorsal root ganglia) but not in non-neuronal tissues (heart and kidney), without affecting the prevalence of contractions. Pms2 suppressed large expansions specifically in tissues showing MutSα-dependent somatic instability, suggesting that they may act on the same lesion or structure associated with the expanded (GAA·TTC)(n) sequence. We conclude that Pms2 specifically suppresses large expansions of a pathogenic trinucleotide repeat sequence in neuronal tissues, possibly acting independently of the canonical MMR pathway.
Conflict of interest statement
Figures


Similar articles
-
The mismatch repair system protects against intergenerational GAA repeat instability in a Friedreich ataxia mouse model.Neurobiol Dis. 2012 Apr;46(1):165-71. doi: 10.1016/j.nbd.2012.01.002. Epub 2012 Jan 20. Neurobiol Dis. 2012. PMID: 22289650 Free PMC article.
-
MutLα heterodimers modify the molecular phenotype of Friedreich ataxia.PLoS One. 2014 Jun 27;9(6):e100523. doi: 10.1371/journal.pone.0100523. eCollection 2014. PLoS One. 2014. PMID: 24971578 Free PMC article.
-
DNA mismatch repair complex MutSβ promotes GAA·TTC repeat expansion in human cells.J Biol Chem. 2012 Aug 24;287(35):29958-67. doi: 10.1074/jbc.M112.356758. Epub 2012 Jul 11. J Biol Chem. 2012. PMID: 22787155 Free PMC article.
-
Disease-associated repeat instability and mismatch repair.DNA Repair (Amst). 2016 Feb;38:117-126. doi: 10.1016/j.dnarep.2015.11.008. Epub 2015 Dec 12. DNA Repair (Amst). 2016. PMID: 26774442 Review.
-
Mismatch repair pathway: molecules, functions, and role in colorectal carcinogenesis.Eur J Cancer Prev. 2014 Jul;23(4):246-57. doi: 10.1097/CEJ.0000000000000019. Eur J Cancer Prev. 2014. PMID: 24614649 Review.
Cited by
-
Somatic CAG expansion in Huntington's disease is dependent on the MLH3 endonuclease domain, which can be excluded via splice redirection.Nucleic Acids Res. 2021 Apr 19;49(7):3907-3918. doi: 10.1093/nar/gkab152. Nucleic Acids Res. 2021. PMID: 33751106 Free PMC article.
-
Genetic modifiers of repeat expansion disorders.Emerg Top Life Sci. 2023 Dec 14;7(3):325-337. doi: 10.1042/ETLS20230015. Emerg Top Life Sci. 2023. PMID: 37861103 Free PMC article.
-
GAA•TTC repeat expansion in human cells is mediated by mismatch repair complex MutLγ and depends upon the endonuclease domain in MLH3 isoform one.Nucleic Acids Res. 2018 May 4;46(8):4022-4032. doi: 10.1093/nar/gky143. Nucleic Acids Res. 2018. PMID: 29529236 Free PMC article.
-
In vivo CRISPR-Cas9 genome editing in mice identifies genetic modifiers of somatic CAG repeat instability in Huntington's disease.Nat Genet. 2025 Feb;57(2):314-322. doi: 10.1038/s41588-024-02054-5. Epub 2025 Jan 22. Nat Genet. 2025. PMID: 39843658 Free PMC article.
-
MutLγ promotes repeat expansion in a Fragile X mouse model while EXO1 is protective.PLoS Genet. 2018 Oct 12;14(10):e1007719. doi: 10.1371/journal.pgen.1007719. eCollection 2018 Oct. PLoS Genet. 2018. PMID: 30312299 Free PMC article.
References
-
- Lopez CA, Cleary JD, Pearson CE (2010) Repeat instability as the basis for human diseases and as a potential target for therapy. Nat Rev Mol Cell Biol 11: 165–70. - PubMed
-
- Kennedy L, Evans E, Chen CM, Craven L, Detloff PJ, et al. (2003) Dramatic tissue-specific mutation length increases are an early molecular event in Huntington disease pathogenesis. Hum Mol Genet 12: 3359–3367. - PubMed
-
- Shelbourne PF, Keller-McGandy C, Bi WL, Yoon SR, Dubeau L, et al. (2007) Triplet repeat mutation length gains correlate with cell-type specific vulnerability in Huntington disease brain. Hum Mol Genet 16: 1133–1142. - PubMed
-
- Campuzano V, Montermini L, Molto MD, Pianese L, Cossee M, et al. (1996) Friedreich's ataxia: Autosomal recessive disease caused by an intronic GAA triplet repeat expansion. Science 271: 1423–1427. - PubMed
-
- De Biase I, Rasmussen A, Endres D, Al-Mahdawi S, Monticelli A, et al. (2007) Progressive GAA expansions in dorsal root ganglia of Friedreich's ataxia patients. Ann Neurol 61: 55–60. - PubMed
Publication types
MeSH terms
Substances
Grants and funding
LinkOut - more resources
Full Text Sources
Other Literature Sources
Molecular Biology Databases
Miscellaneous

