

Abiotic and biotic factors associated with tick population dynamics on a mammalian host: Ixodes hexagonus infesting otters, Lutra lutra
- PMID: 23071736
- PMCID: PMC3465257
- DOI: 10.1371/journal.pone.0047131
Abiotic and biotic factors associated with tick population dynamics on a mammalian host: Ixodes hexagonus infesting otters, Lutra lutra
Abstract
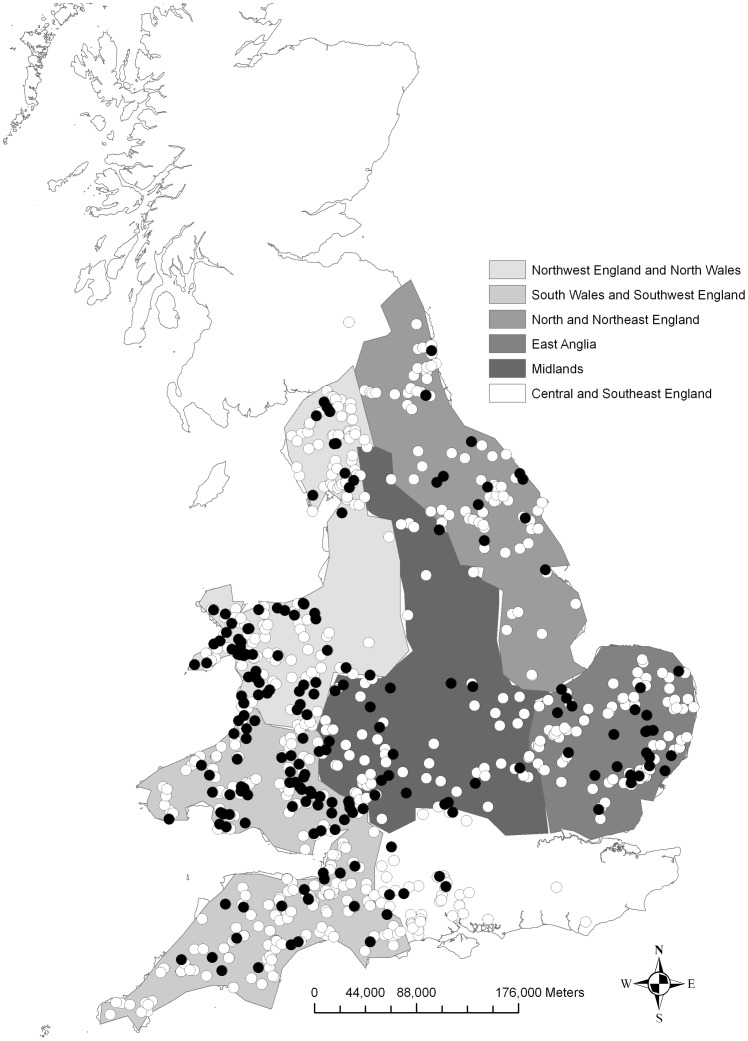
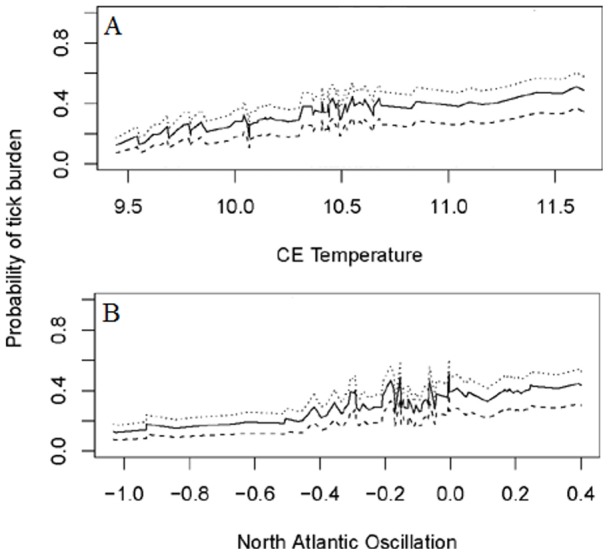
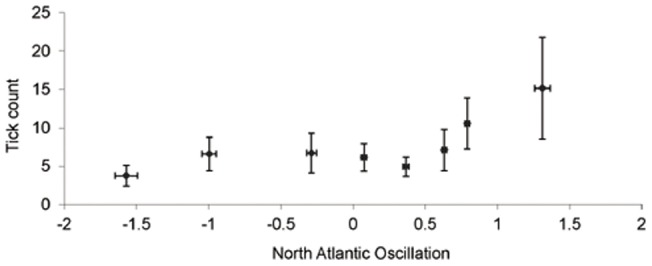
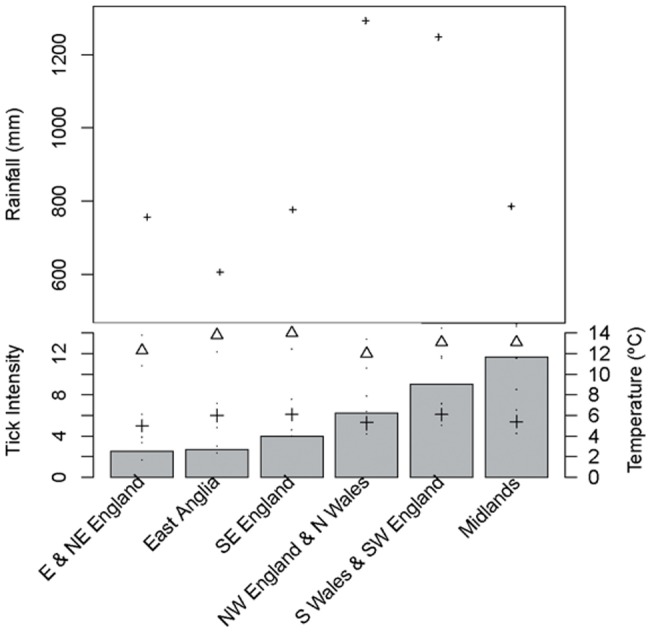
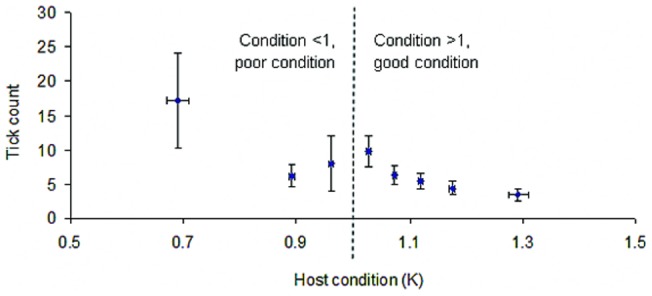
The Eurasian otter, Lutra lutra, hosts several parasites with zoonotic potential. As this semiaquatic mammal has large ranges across terrestrial, freshwater and marine habitats, it has the capacity for wide dispersion of pathogens. Despite this, parasites of otters have received relatively little attention. Here, we examine their ectoparasite load and assess whether this is influenced by abiotic or biotic variables. Climatic phenomena such as the North Atlantic Oscillation (NAO) affect weather conditions in northern Europe. Consequently parasite distributions, particularly species with life stages exposed to the external environment, can be affected. We assessed the extent to which inter-annual variations in large-scale weather patterns (specifically the NAO and Central England (CE) temperatures) and host characteristics influenced tick prevalence and intensity. Ectoparasites consisted of a single species, the nidiculous tick Ixodes hexagonus (prevalence = 24.3%; mean intensity = 7.2; range = 1-122; on n = 820 otter hosts). The prevalence, but not intensity of infestation, was associated with high CE temperatures, while both prevalence and intensity were associated with positive phases of the NAO. Such associations indicate that I. hexagonus are most abundant when weather conditions are warmer and wetter. Ticks were more prevalent on juvenile than sub-adult or adult otters, which probably reflects the length of time the hosts spend in the holt where these ticks quest. High tick number was associated with poor host condition, so either poor condition hosts are more susceptible to ticks, or tick infestations negatively impact on host condition. Otters are clearly an important and common host for I. hexagonus, which has implications for vector-borne diseases. This work is the first to consider the impacts of long-term weather patterns on I. hexagonus and uses wild-animal cadavers to illustrate the importance of abiotic and biotic pressures impacting parasitic populations.
Conflict of interest statement
Figures
Similar articles
-
Climatic variables are associated with the prevalence of biliary trematodes in otters.Int J Parasitol. 2013 Aug;43(9):729-37. doi: 10.1016/j.ijpara.2013.04.006. Epub 2013 Jun 7. Int J Parasitol. 2013. PMID: 23751866
-
Spatial and seasonal factors are key determinants in the aggregation of helminths in their definitive hosts: Pseudamphistomum truncatum in otters (Lutra lutra).Int J Parasitol. 2015 Jan;45(1):75-83. doi: 10.1016/j.ijpara.2014.09.004. Epub 2014 Nov 13. Int J Parasitol. 2015. PMID: 25444862
-
Temporal variation of Ixodes ricinus intensity on the rodent host Apodemus flavicollis in relation to local climate and host dynamics.Vector Borne Zoonotic Dis. 2007 Fall;7(3):285-95. doi: 10.1089/vbz.2006.0607. Vector Borne Zoonotic Dis. 2007. PMID: 17760511
-
Tick ecology: processes and patterns behind the epidemiological risk posed by ixodid ticks as vectors.Parasitology. 2004;129 Suppl:S37-65. doi: 10.1017/s0031182004004925. Parasitology. 2004. PMID: 15938504 Review.
-
Why is tick-borne encephalitis increasing? A review of the key factors causing the increasing incidence of human TBE in Sweden.Parasit Vectors. 2012 Aug 31;5:184. doi: 10.1186/1756-3305-5-184. Parasit Vectors. 2012. PMID: 22937961 Free PMC article. Review.
Cited by
-
Ixodid ticks parasitizing wild carnivores in Romania.Exp Appl Acarol. 2017 Feb;71(2):139-149. doi: 10.1007/s10493-017-0108-z. Epub 2017 Jan 26. Exp Appl Acarol. 2017. PMID: 28124749
-
A cross-sectional survey of hard ticks and molecular characterization of Rhipicephalus microplus parasitizing domestic animals of Khyber Pakhtunkhwa, Pakistan.PLoS One. 2021 Aug 5;16(8):e0255138. doi: 10.1371/journal.pone.0255138. eCollection 2021. PLoS One. 2021. PMID: 34351948 Free PMC article.
-
Pathological Findings in Eurasian Otters (Lutra lutra) Found Dead between 2015-2020 in Schleswig-Holstein, Germany.Animals (Basel). 2021 Dec 28;12(1):59. doi: 10.3390/ani12010059. Animals (Basel). 2021. PMID: 35011165 Free PMC article.
-
Back from Exile? First Records of Chewing Lice (Lutridia exilis; Ischnocera; Mallophaga) in Growing Eurasian Otter (Lutra lutra) Populations from Northern Germany.Pathogens. 2023 Apr 13;12(4):587. doi: 10.3390/pathogens12040587. Pathogens. 2023. PMID: 37111473 Free PMC article.
-
Seasonal Dynamics, Record of Ticks Infesting Humans, Wild and Domestic Animals and Molecular Phylogeny of Rhipicephalus microplus in Khyber Pakhtunkhwa Pakistan.Front Physiol. 2019 Jul 16;10:793. doi: 10.3389/fphys.2019.00793. eCollection 2019. Front Physiol. 2019. PMID: 31379587 Free PMC article.
References
-
- IPCC (2007) Climate Change 2007: Synthesis Report. Contribution to working groups I, II and III to the Fourth Assessment Report of the Intergovernmental Panel on Climate Change. RK Pachauri, A Reisinger, editors. IPCC, Geneva, Switzerland.
-
- Kutz SJ, Hoberg EP, Nagy J, Polley L, Elkin B (2004) “Emerging” parasitic infections in arctic ungulates. Integ Comp Biol 44: 109–118. - PubMed
-
- Patz JA, Epstein PR, Burke TA, Balbus JM (1996) Global climate change and emerging infectious diseases. JAMA 275: 217–223. - PubMed
-
- Harvell CD, Mitchell CE, Ward JR, Altizer S, Dobson AP, et al. (2002) Climate warming and disease risks for terrestrial and marine biota. Science 296: 2158–2162. - PubMed
Publication types
MeSH terms
LinkOut - more resources
Full Text Sources
Research Materials
