. 2012;7(10):e47250.
doi: 10.1371/journal.pone.0047250. Epub 2012 Oct 12.

Computational modeling reveals dendritic origins of GABA(A)-mediated excitation in CA1 pyramidal neurons

Affiliations

Computational modeling reveals dendritic origins of GABA(A)-mediated excitation in CA1 pyramidal neurons

Naomi Lewin et al. PLoS One. 2012.

Erratum in

  • PLoS One. 2013;8(5). doi:10.1371/annotation/d6af29ee-25c0-4f8e-910e-afe53ef8f963

Abstract

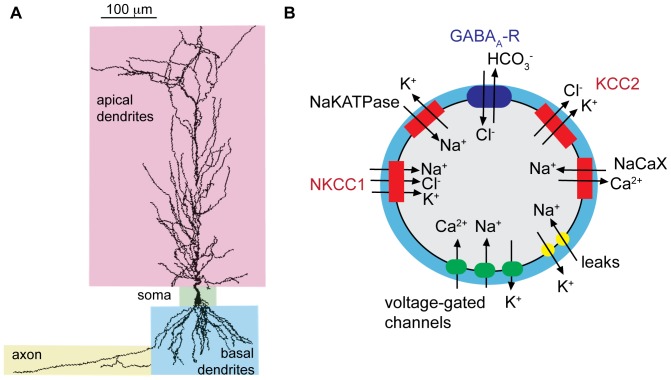
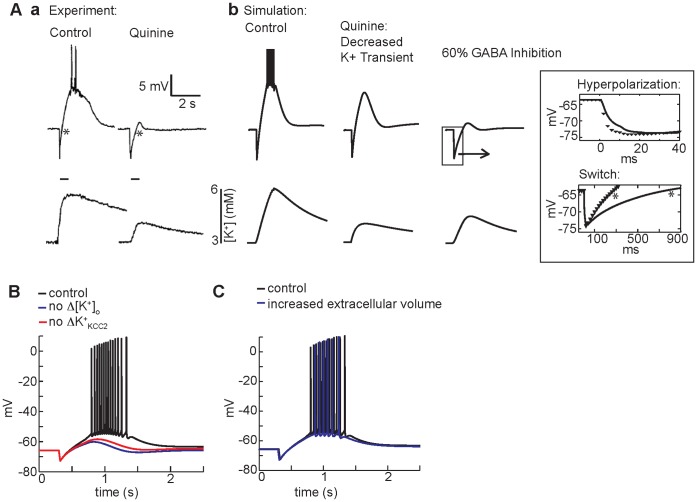
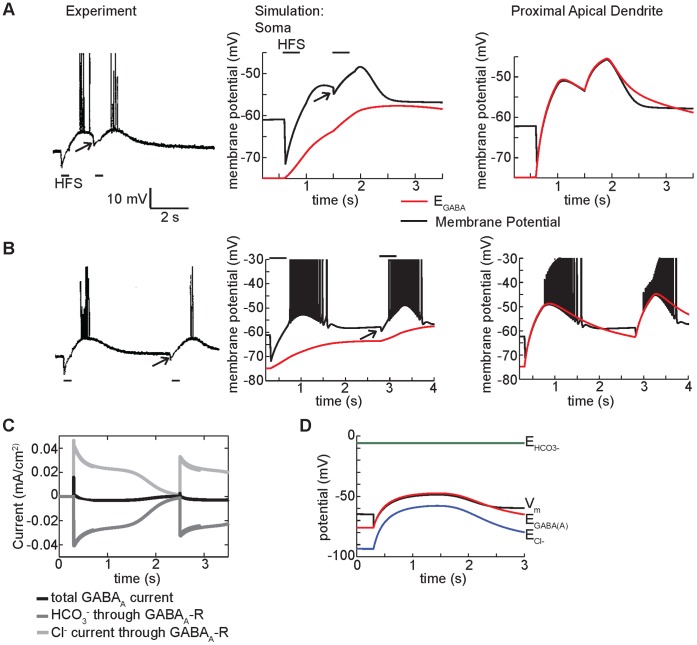
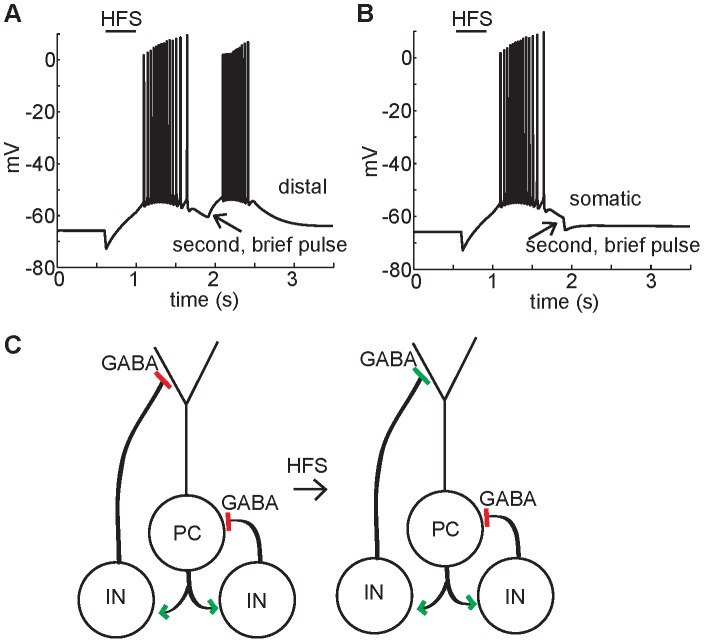
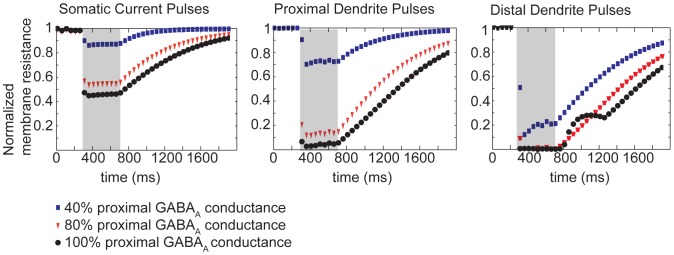
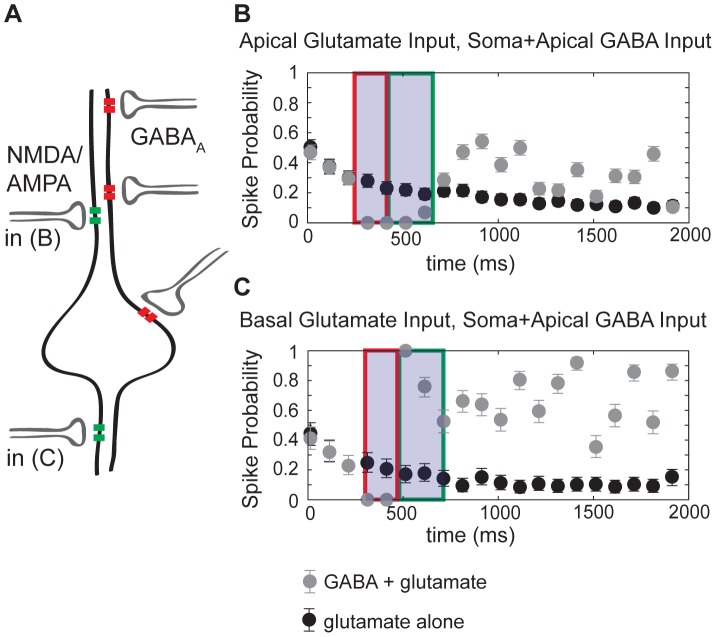
GABA is the key inhibitory neurotransmitter in the adult central nervous system, but in some circumstances can lead to a paradoxical excitation that has been causally implicated in diverse pathologies from endocrine stress responses to diseases of excitability including neuropathic pain and temporal lobe epilepsy. We undertook a computational modeling approach to determine plausible ionic mechanisms of GABA(A)-dependent excitation in isolated post-synaptic CA1 hippocampal neurons because it may constitute a trigger for pathological synchronous epileptiform discharge. In particular, the interplay intracellular chloride accumulation via the GABA(A) receptor and extracellular potassium accumulation via the K/Cl co-transporter KCC2 in promoting GABA(A)-mediated excitation is complex. Experimentally it is difficult to determine the ionic mechanisms of depolarizing current since potassium transients are challenging to isolate pharmacologically and much GABA signaling occurs in small, difficult to measure, dendritic compartments. To address this problem and determine plausible ionic mechanisms of GABA(A)-mediated excitation, we built a detailed biophysically realistic model of the CA1 pyramidal neuron that includes processes critical for ion homeostasis. Our results suggest that in dendritic compartments, but not in the somatic compartments, chloride buildup is sufficient to cause dramatic depolarization of the GABA(A) reversal potential and dominating bicarbonate currents that provide a substantial current source to drive whole-cell depolarization. The model simulations predict that extracellular K(+) transients can augment GABA(A)-mediated excitation, but not cause it. Our model also suggests the potential for GABA(A)-mediated excitation to promote network synchrony depending on interneuron synapse location - excitatory positive-feedback can occur when interneurons synapse onto distal dendritic compartments, while interneurons projecting to the perisomatic region will cause inhibition.


Conflict of interest statement

Competing Interests: The authors have declared that no competing interests exist.

Figures

Figure 1
Figure 1. The anatomically based model of a CA1 pyramidal cell accounts for ion homeostasis.
(A) The morphology of the model neuron is based on a CA1 pyramidal cell, with a soma, apical and basal dendrites, and axon as indicated. (B) Ion homeostasis is computed in each compartment by accounting for ion flux between the intracellular and extracellular space through channels, pumps and transporters, including voltage-gated Na+, K+, and Ca2+ channels, GABAA receptors, neuronal K+−Cl cotransporter (KCC2), Na+−K+−Cl cotransporter (NKCC1), Na+−K+ ATPase (NaK-ATPase), the Na+−Ca2+ exchanger (NaCaX), and leak currents. The extracellular volume (blue shading in diagram) is 15% of the intracellular compartment.
Figure 2
Figure 2. Tuning of model parameters based on experimental data.
(A) Membrane potential elicited by somatic current injection as measured in the soma (A, top) and in a dendritic compartment 250 µm from the soma (A, bottom). The simulation (black line) is superimposed on experimental data from Golding et al. (gray line). (B) Rate of intracellular chloride clearance in the dendrites. Intracellular chloride from an apical dendritic compartment 200 µm from soma (black line) is superimposed on experimental data (symbols). (C) Action potential spike trains measured in the soma (bottom panels) and the proximal (middle) and distal (top) dendrites during 200 pA somatic current injection. Experiments are in left panels – simulations in right panels. Experimental data are from Spruston et al. .
Figure 3
Figure 3. High-frequency GABAA stimulation causes paradoxical depolarization in CA1 neurons.
(A) Experimental and simulated currents recorded in the soma under voltage clamp at −75 mV and −55 mV. Simulations (right panels) are compared to experimental data (left panels) from Smirnov et al. . Stimulation of 40 pulses at 100 Hz was applied (50% activation of GABAA synapses in the simulation). (B) Somatic membrane potential in experiment from Viitanen et al. (left) and simulation (right) (80% activation of GABAA synapses in the simulation). In both the experiment and simulation identical HFS in presence of a transient 200 pA depolarizing or hyperpolarizing injection current in the soma did not change the trend for membrane potential in the soma to tightly follow the GABA reversal potential in the soma during stimulation. (C) Coarse sensitivity analysis demonstrates the robustness of the GABAA mediated depolarization to substantial changes (red indicates 50% increase in parameters as indicated. Blue indicates 50% reduction in indicated parameter) in baseline model parameters (without sodium current). See Methods for the baseline parameter values.
Figure 4
Figure 4. Summary of concentration and GABAA reversal potential changes at various locations.
A) The maximum chloride concentration, GABAA reversal potential, and extracellular potassium concentration reached in all somatic and apical dendritic compartments in the model neuron following high-frequency GABAA stimulation, as a function of compartment radius. B) The maximum concentrations and reversal potentials reached along the main apical dendritic tree (highlighted on the image of the neuron) as a function of distance from the soma. Bottom panel: maximum extracellular potassium accumulation in each compartment (black dots), and proportion derived from KCC2 extrusion alone (red dots).
Figure 5
Figure 5. The ionic mechanism of GABAA-mediated depolarization.
(A) (a) In experiments from Smirnov et al. , bath application of quinine blunts the GABAA-mediated depolarizing response (top panels show membrane potential measured in the soma) to HFS (a, bottom panels). (b) In the simulation, clamping the extracellular potassium transient to experimental values slightly reduces the amplitude of GABA-mediated depolarization (middle). When effects of quinine on GABAA conductance (60% inhibition of GABAA) are included, the simulated voltage traces closely resembles the experimentally observed kinetics of hyperpolarization and diminished depolarization (b, right). The potassium transient is diminished, but not eliminated when GABAA is inhibited - also consistent with the experiment. Inset: magnification of magnitude and kinetics of the hyperpolarization with GABAA inhibition (black line) compared to control (black symbols). In the top panel, slower hyperpolarization occurs because of the decreased magnitude of current elicited by each GABA pulse. Note also the slower switch from hyperpolarization to depolarization in the presence of quinine in experiment (a, right) and simulation (bottom inset) (both marked with *). (B) Complete elimination of the extracellular potassium transient decreases GABAA-mediated depolarization (blue line) compared to control (black line). A similar decrease is observed when the potassium transient is unchanged, but the KCC2 transporter is insensitive to the potassium transient (red line). (C) An increase in extracellular volume of the dendritic compartments (22% of intracellular volume) (blue line) compared to control (15% of intracellular volume) (black line) has smaller effects on somatic membrane potential response in the model.
Figure 6
Figure 6. The cellular response to additional GABAA stimulation following high-frequency stimulation.
(A) In an experiment by Kaila et al. , application of a second identical HFS during the initial falling phase of the GABAA-mediated depolarization causes immediate hyperpolarization followed by depolarization. In corresponding simulations (with Na+ channels blocked for clarity) membrane potential (black lines) and GABAA reversal potential (red lines) are shown for a somatic compartment and apical dendritic compartment 150 µm from the soma. As in the experiment, when a second HFS is applied at the start of the falling phase, immediate hyperpolarization is observed in the soma due to the hyperpolarized GABAA reversal potential compared to membrane potential. In contrast, immediate depolarization is observed in the dendrite in response to a second HFS because the GABAA reversal potential is depolarized compared to membrane potential. (B) When a second HFS is applied following cell recovery from GABAA-mediated depolarization, a brief low amplitude hyperpolarization in the experiment, and in the both the somatic and dendritic compartments in the simulation occurs, due to hyperpolarized GABAA reversal potential relative to the membrane potential. The hyperpolarization is short-lived however, owing to the small additional influx of chloride required in the dendritic compartments to push the GABAA reversal potential into the depolarized regime, leading to robust membrane depolarization via bicarbonate current. (C) Total current through the GABAA receptor, and the component chloride and bicarbonate currents. The chloride current dominates initially leading to a fast initial positive total current, which then switches direction as the bicarbonate current dominates. A second subsequent GABA stimulus leads to a repeat of the positive to negative current switch. (D) The chloride reversal potential rises following the high frequency stimulus but does not become depolarized compared to the membrane potential. However, the GABA reversal potential, a weighted average of the chloride and bicarbonate reversal potentials, does become depolarized compared to the membrane potential.
Figure 7
Figure 7. Following high frequency stimulation of GABAA, the response of a CA1 pyramidal cell to a physiological stimulus depends on the stimulus location.
The somatic membrane potential in response to physiological single pulse of GABA after HFS is shown. (A) A single secondary GABA pulse limited to dendrites with distance 50 to 200 µm from the soma leads to excitation in the soma. (B) A single additional pulse limited to the soma leads to hyperpolarization. (C) The model suggests that interneurons with dendritic targets may have transient excitatory rather than inhibitory feedback onto the pyramidal cell while interneurons targeting the soma will cause inhibitory input.
Figure 8
Figure 8. Effects of HFS of GABAA on CA1 membrane resistance.
Three levels of GABAA conductances evoke varied degrees of dendritic shunting in response to applied current pulses in the soma (left), proximal dendrite 217 µm from the soma (middle) and distal dendrite 374 µm from the soma (right). Somatic and distal dendritic conductance was fixed at 80% of maximum, while the apical dendritic conductance was 0% (blue symbols), 40% (red symbols), or 80% (black symbols). A 5 ms hyperpolarizing current of 5 nA is applied to the indicated compartment, every 50 ms for two seconds. The response to this pulse is measured in the soma, and the magnitude of the response to each pulse is normalized to the magnitude at baseline. The shaded gray region illustrates the duration of the applied HFS to activate GABA receptors.
Figure 9
Figure 9. The net effect of interaction between glutamatergic and GABAergic signaling depends on location of glutamatergic input.
(A) Schematic indicating location of synaptic inputs in simulations. 10 Hz glutamatergic pulses were applied either to proximal apical dendrites (in B) or basal dendrites (in C). A noisy input current was applied to a somatic compartment so that the probability of spiking in response to a glutamate pulse was less than 50%. For both (B) and (C), HFS of GABA receptors was applied to the soma and apical dendrites (for the duration indicated by the shaded box in B and C). (B) and (C) The probability of action potential firing within 10 ms of a glutamate pulse with GABA (gray circles) and without GABA (black circles) is plotted for 500 trials each, with the error bars representing the 95% confidence interval. During the initial fast hyperpolarization (region outlined by red boxes), HFS and consequent GABA activation completely inhibited action potential firing independently of glutamate input (grey circles). HFS resulting in GABA activation inhibits the response to apical glutamatergic input throughout its course (B), whereas the response to basal glutamatergic input is enhanced (C) (region outlined by green boxes). The slow depolarization following 400 ms of HFS enhanced the response to basal glumatergic input (C) more than apical glutamatergic input (B).
Figure 10
Figure 10. Block of the neuronal K+-Cl– cotransporter (KCC2) promotes GABAA-mediated depolarization via effects on GABAA reversal potential.
(A) Somatic membrane potential trace in response to HFS for control (black line) and 60% decrease in KCC2 transport (gray line). (B) In a dendritic compartment adjacent to the soma, a decrease in KCC2 leads to increased depolarization of EGABA(A) (solid lines), and a decrease in [K+]o (dashed lines). (C) The response to a single GABA pulse following the high frequency stimulus, with 60% KCC2 inhibition compared to control. (a) Somatic pulses with reduced KCC2 are still hyperpolarizing, but dendritic pulses (b) lead to increased depolarization and higher frequency firing (grey) as compared to control (black).

References

    1. Cohen I, Navarro V, Clemenceau S, Baulac M, Miles R (2002) On the origin of interictal activity in human temporal lobe epilepsy in vitro. Science 298: 1418–1421. - PubMed
    1. De Koninck Y (2007) Altered chloride homeostasis in neurological disorders: a new target. Curr Opin Pharmacol 7: 93–99. - PubMed
    1. Hewitt SA, Wamsteeker JI, Kurz EU, Bains JS (2009) Altered chloride homeostasis removes synaptic inhibitory constraint of the stress axis. Nat Neurosci 12: 438–443. - PubMed
    1. Staley KJ, Soldo BL, Proctor WR (1995) Ionic mechanisms of neuronal excitation by inhibitory GABAA receptors. Science 269: 977–981. - PubMed
    1. Viitanen T, Ruusuvuori E, Kaila K, Voipio J (2010) The K+-Cl cotransporter KCC2 promotes GABAergic excitation in the mature rat hippocampus. J Physiol 588: 1527–1540. - PMC - PubMed

Publication types

MeSH terms

LinkOut - more resources