

Severe thymic atrophy in a mouse model of skin inflammation accounts for impaired TNFR1 signaling
- PMID: 23071785
- PMCID: PMC3469485
- DOI: 10.1371/journal.pone.0047321
Severe thymic atrophy in a mouse model of skin inflammation accounts for impaired TNFR1 signaling
Abstract
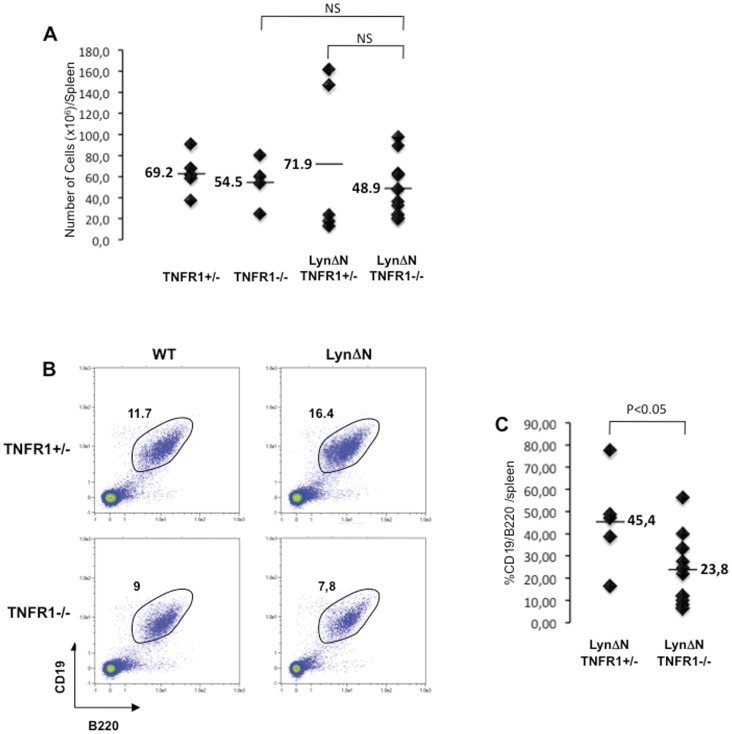
Transgenic mice expressing the caspase-cleaved form of the tyrosine kinase Lyn (LynΔN) develop a TNFα-dependent skin disease that accurately recapitulates human psoriasis. Participation of lymphocytes in this disease was confirmed by backcrossing LynΔN mice on a Rag-1 deficient background. The present study was therefore conducted to analyze whether modification of lymphocyte homeostasis does occur and participate in the phenotype of LynΔN mice. We show here that LynΔN mice consistently exhibit thymic atrophy that correlates with both a net decrease in the CD4+/CD8+ Double Positive (DP) and an increase in Single Positive (SP) thymocyte sub-populations, but also display an increase of splenic mature B cell. Interestingly, a normal immune phenotype was rescued in a TNFR1 deficient background. Finally, none of these immune alterations was detected in newborn mice before the onset of inflammation. Therefore, we conclude that chronic inflammation can induce thymic atrophy and perturb spleen homeostasis in LynΔN mice through the increased production of TNFα, LTß and TNFR1 signaling.
Conflict of interest statement
Figures


Similar articles
-
The caspase-cleaved form of LYN mediates a psoriasis-like inflammatory syndrome in mice.EMBO J. 2009 Aug 19;28(16):2449-60. doi: 10.1038/emboj.2009.183. Epub 2009 Jul 9. EMBO J. 2009. PMID: 19590497 Free PMC article.
-
Accelerated thymic atrophy as a result of elevated homeostatic expression of the genes encoded by the TNF/lymphotoxin cytokine locus.Eur J Immunol. 2009 Oct;39(10):2906-15. doi: 10.1002/eji.200839191. Eur J Immunol. 2009. PMID: 19735075
-
Chagasic thymic atrophy does not affect negative selection but results in the export of activated CD4+CD8+ T cells in severe forms of human disease.PLoS Negl Trop Dis. 2011 Aug;5(8):e1268. doi: 10.1371/journal.pntd.0001268. Epub 2011 Aug 16. PLoS Negl Trop Dis. 2011. PMID: 21858238 Free PMC article.
-
Impaired thymic selection in mice expressing altered levels of the SLP-76 adaptor protein.J Leukoc Biol. 2008 Feb;83(2):419-29. doi: 10.1189/jlb.0507297. Epub 2007 Oct 26. J Leukoc Biol. 2008. PMID: 17965338
-
CD4, CD8 and tyrosine kinases in thymic selection.Curr Opin Immunol. 1993 Apr;5(2):235-40. doi: 10.1016/0952-7915(93)90010-p. Curr Opin Immunol. 1993. PMID: 8507400 Review.
Cited by
-
IFNγ and iNOS-Mediated Alterations in the Bone Marrow and Thymus and Its Impact on Mycobacterium avium-Induced Thymic Atrophy.Front Immunol. 2021 Dec 20;12:696415. doi: 10.3389/fimmu.2021.696415. eCollection 2021. Front Immunol. 2021. PMID: 34987496 Free PMC article.
-
Tissue inflammation induced by constitutively active STING is mediated by enhanced TNF signaling.Elife. 2025 Mar 20;14:e101350. doi: 10.7554/eLife.101350. Elife. 2025. PMID: 40111902 Free PMC article.
-
Two histone/protein acetyltransferases, CBP and p300, are indispensable for Foxp3+ T-regulatory cell development and function.Mol Cell Biol. 2014 Nov;34(21):3993-4007. doi: 10.1128/MCB.00919-14. Epub 2014 Aug 25. Mol Cell Biol. 2014. PMID: 25154413 Free PMC article.
-
The anti-apoptotic form of tyrosine kinase Lyn that is generated by proteolysis is degraded by the N-end rule pathway.Oncotarget. 2014 May 15;5(9):2714-22. doi: 10.18632/oncotarget.1931. Oncotarget. 2014. PMID: 24798867 Free PMC article.
References
-
- Wajant H, Pfizenmaier K, Scheurich P (2003) Tumor necrosis factor signaling. Cell Death Differ 10: 45–65. - PubMed
-
- Ware CF (2005) Network communications: lymphotoxins, LIGHT, and TNF. Annu Rev Immunol 23: 787–819. - PubMed
-
- Gommerman JL, Browning JL (2003) Lymphotoxin/light, lymphoid microenvironments and autoimmune disease. Nat Rev Immunol 3: 642–655. - PubMed
-
- McCarthy DD, Summers-Deluca L, Vu F, Chiu S, Gao Y, et al. (2006) The lymphotoxin pathway: beyond lymph node development. Immunol Res 35: 41–54. - PubMed
Publication types
MeSH terms
Substances
LinkOut - more resources
Full Text Sources
Molecular Biology Databases
Research Materials
Miscellaneous
