

Stress and sleep duration predict headache severity in chronic headache sufferers
- PMID: 23073072
- PMCID: PMC3626265
- DOI: 10.1016/j.pain.2012.08.014
Stress and sleep duration predict headache severity in chronic headache sufferers
Abstract
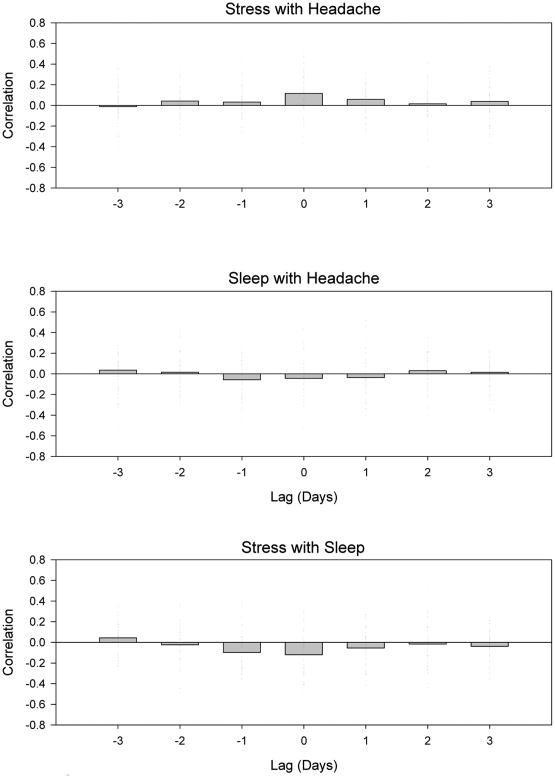
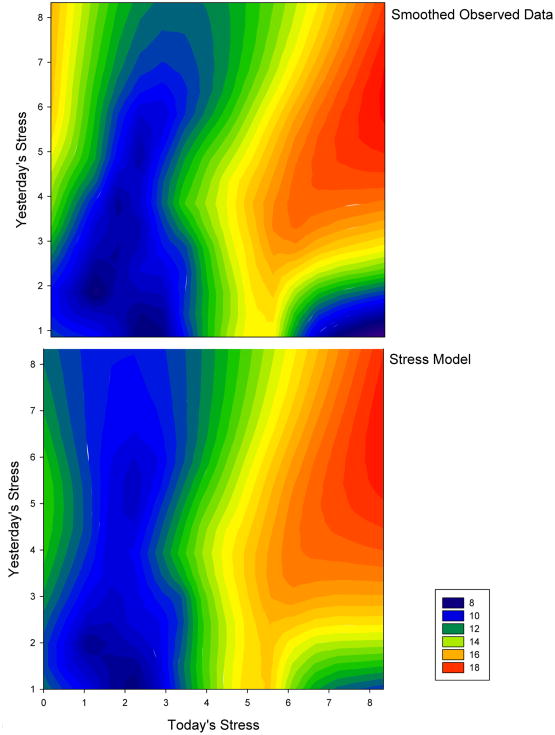
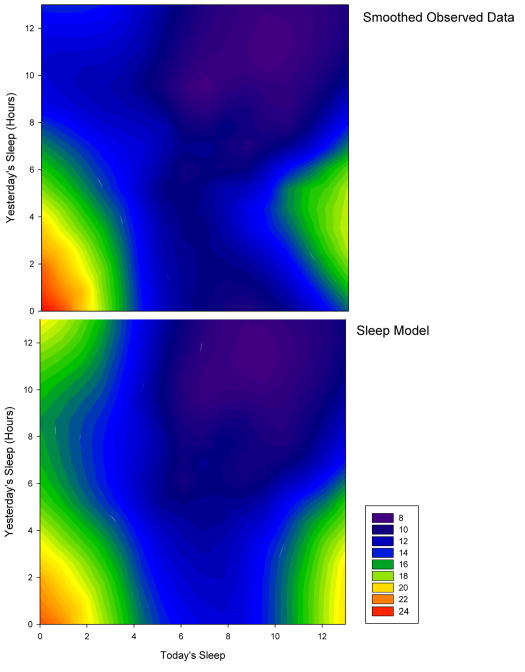
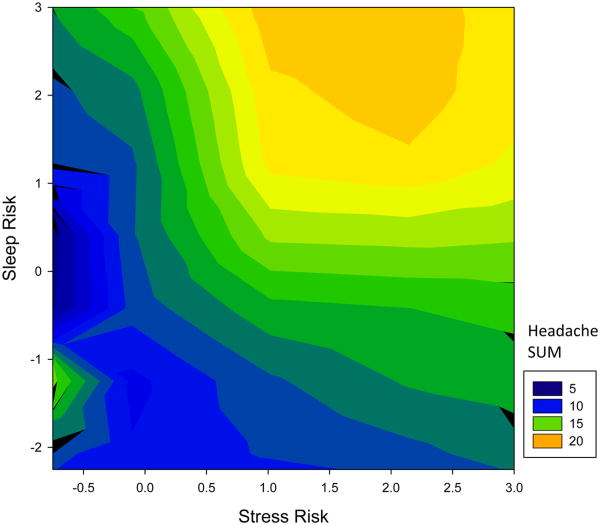
The objective of this study was to evaluate the time-series relationships between stress, sleep duration, and headache pain among patients with chronic headaches. Sleep and stress have long been recognized as potential triggers of episodic headache (<15 headache days/month), though prospective evidence is inconsistent and absent in patients diagnosed with chronic headaches (≥15 days/month). We reanalyzed data from a 28-day observational study of chronic migraine (n=33) and chronic tension-type headache (n=22) sufferers. Patients completed the Daily Stress Inventory and recorded headache and sleep variables using a daily sleep/headache diary. Stress ratings, duration of previous nights' sleep, and headache severity were modeled using a series of linear mixed models with random effects to account for individual differences in observed associations. Models were displayed using contour plots. Two consecutive days of either high stress or low sleep were strongly predictive of headache, whereas 2 days of low stress or adequate sleep were protective. When patterns of stress or sleep were divergent across days, headache risk was increased only when the earlier day was characterized by high stress or poor sleep. As predicted, headache activity in the combined model was highest when high stress and low sleep occurred concurrently during the prior 2 days, denoting an additive effect. Future research is needed to expand on current findings among chronic headache patients and to develop individualized models that account for multiple simultaneous influences of headache trigger factors.
Copyright © 2012 International Association for the Study of Pain. Published by Elsevier B.V. All rights reserved.
Conflict of interest statement
Ross A. Butschek: Mr. Butschek reports no conflicts of interest
Dana P. Turner: Ms. Turner receives research support from Merck and Co., Inc.
Todd A. Smitherman: Dr. Smitherman reports no conflicts of interest.
Jeanetta C. Rains: Dr. Rains reports no conflicts of interest.
Donald B. Penzien: Dr. Penzien receives research support from Merck and Co., Inc.
Figures
References
-
- Affleck G, Tennen H, Urrows S, Higgins P. Person and contextual features of daily stress reactivity: individual-differences in relations of undesirable daily events with mood disturbance and chronic pain intensity. J Pers Soc Psychol. 1994;66:329–340. - PubMed
-
- Ashina M, Bendtsen L, Jensen R, Schifter S, Olesen J. Evidence for increased plasma levels of calcitonin gene-related peptide in migraine outside of attacks. Pain. 2000;86:133–138. - PubMed
-
- Barbanti P, Fabbrini G, Aurilia C, Vanacore N, Cruccu G. A case-control study on excessive daytime sleepiness in episodic migraine. Cephalalgia. 2007;27:1115–1119. - PubMed
-
- Bigal ME, Lipton RB. Modifiable risk factors for migraine progression. Headache. 2006;46:1334–1343. - PubMed
-
- Blumenfeld AM, Varon SF, Wilcox TK, Buse DC, Kawata AK, Manack A, Goadsby PJ, Lipton RB. Disability, HRQoL and resource use among chronic and episodic migraineurs: results from the International Burden of Migraine Study (IBMS) Cephalalgia. 2011;31:301–315. - PubMed
MeSH terms
Grants and funding
LinkOut - more resources
Full Text Sources
Other Literature Sources
Medical
Research Materials
