Clinical and molecular cross-sectional study of a cohort of adult type III spinal muscular atrophy patients: clues from a biomarker study
- PMID: 23073312
- PMCID: PMC3658179
- DOI: 10.1038/ejhg.2012.233
Clinical and molecular cross-sectional study of a cohort of adult type III spinal muscular atrophy patients: clues from a biomarker study
Abstract
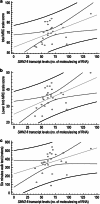
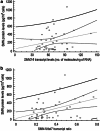
Proximal spinal muscular atrophy (SMA) is an autosomal recessive neuromuscular disorder caused by mutations of the SMN1 gene. Based on severity, three forms of SMA are recognized (types I-III). All patients usually have 2-4 copies of a highly homologous gene (SMN2), which produces insufficient levels of functional survival motor neuron (SMN) protein due to the alternative splicing of exon 7. The availability of potential candidates to the treatment of SMA has raised a number of issues, including the availability of biomarkers. This study was aimed at evaluating whether the quantification of SMN2 products in peripheral blood is a suitable biomarker for SMA. Forty-five adult type III patients were evaluated by Manual Muscle Testing, North Star Ambulatory Assessment scale, 6-min walk test, myometry, forced vital capacity, and dual X-ray absorptiometry. Molecular assessments included SMN2 copy number, levels of full-length SMN2 (SMN2-fl) transcripts and those lacking exon 7 and SMN protein. Clinical outcome measures strongly correlated to each other. Lean body mass correlated inversely with years from diagnosis and with several aspects of motor performance. SMN2 copy number and SMN protein levels were not associated with motor performance or transcript levels. SMN2-fl levels correlated with motor performance in ambulant patients. Our results indicate that SMN2-fl levels correlate with motor performance only in patients preserving higher levels of motor function, whereas motor performance was strongly influenced by disease duration and lean body mass. If not taken into account, the confounding effect of disease duration may impair the identification of potential SMA biomarkers.
Figures


References
-
- Pearn J. Classification of spinal muscular atrophies. Lancet. 1980;1:919–922. - PubMed
-
- Munsat TL, Davies KE. International SMA consortium meeting (26–28 June 1992, Bonn, Germany) Neuromuscul Disord. 1992;2:423–428. - PubMed
-
- Zerres K, Rudnik-Schöneborn S, Forrest E, et al. A collaborative study on the natural history of childhood and juvenile onset proximal spinal muscular atrophy (type II and III SMA): 569 patients. J Neurol Sci. 1997;146:67–72. - PubMed
-
- Lefebvre S, Bürglen L, Reboullet S, et al. Identification and characterization of a spinal muscular atrophy-determining gene. Cell. 1995;80:155–165. - PubMed
-
- Wirth B. An update of the mutation spectrum of the survival motor neuron gene (SMN1) in autosomal recessive spinal muscular atrophy (SMA) Hum Mut. 2000;15:228–237. - PubMed
Publication types
MeSH terms
Substances
LinkOut - more resources
Full Text Sources

