Review
. 2012 Oct;92(4):1577-617.
doi: 10.1152/physrev.00009.2012.

Molecular physiology of SPAK and OSR1: two Ste20-related protein kinases regulating ion transport

Affiliations
Review

Molecular physiology of SPAK and OSR1: two Ste20-related protein kinases regulating ion transport

Kenneth B Gagnon et al. Physiol Rev. 2012 Oct.

Abstract

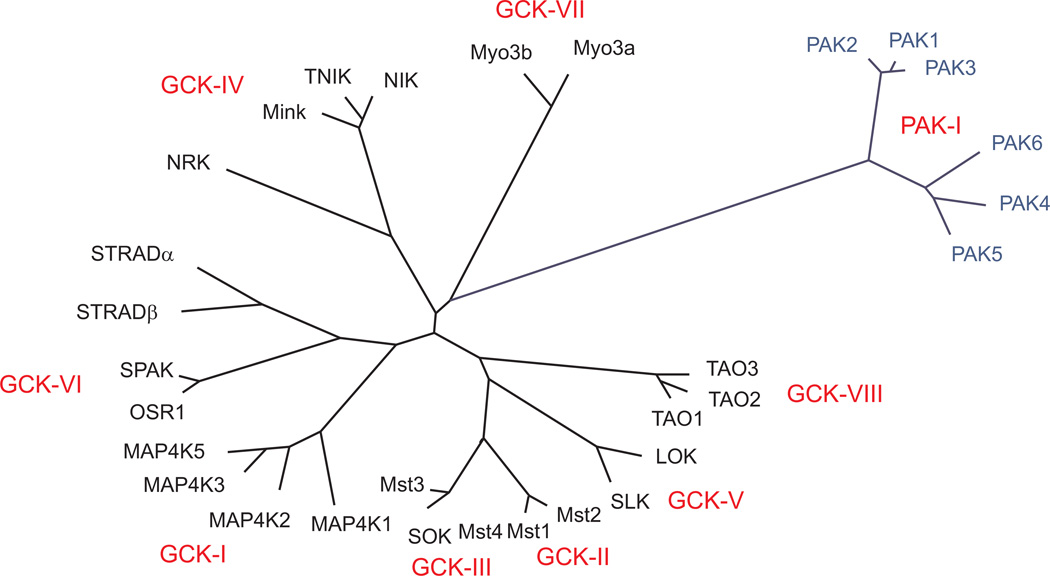
SPAK (Ste20-related proline alanine rich kinase) and OSR1 (oxidative stress responsive kinase) are members of the germinal center kinase VI subfamily of the mammalian Ste20 (Sterile20)-related protein kinase family. Although there are 30 enzymes in this protein kinase family, their conservation across the fungi, plant, and animal kingdom confirms their evolutionary importance. Already, a large volume of work has accumulated on the tissue distribution, binding partners, signaling cascades, and physiological roles of mammalian SPAK and OSR1 in multiple organ systems. After reviewing this basic information, we will examine newer studies that demonstrate the pathophysiological consequences to SPAK and/or OSR1 disruption, discuss the development and analysis of genetically engineered mouse models, and address the possible role these serine/threonine kinases might have in cancer proliferation and migration.


Figures

Figure 1
Figure 1. Cluster dendrogram of mammalian Ste20 kinases
The amino acid sequences of 30 mammalian Ste20 kinases were aligned using VectorNti Suite 6.0 (Invitrogen/Life Technologies, Grand Island, NY), saved as a text file, and then reformatted for use with Promlk, a software component of the Phylogeny Inference Package (PHYLIP) from http://evolution.gs.washington.edu/phylip.html. Promlk estimates phylogenies from protein amino acid sequences by maximum likelihood and assumes a molecular clock. Length of tree branches can be compared to the reference bar which represents 0.1 amino acid substitutions per site. Mouse kinase (sequence accession numbers) used: PAK1 (NP_035165), PAK2 (NP_796300), PAK3 (NP_032804), PAK4 (NP_081746), PAK5 (AAR37415), PAK6 (BAE34725), TAO1 (NP_659074), TAO2 (NP_001157246), TAO3 (NP_001074777), LOK (BAA24073), SLK (NP_001158111), MST1 (NP_067395), MST2 (NP_062609), MST3 (NP_663440), MST4 (NP_598490), SOK (AAH52913), MAPK1 (NP_032305), MAPK2 (NP_033032), MAPK3 (NP_001074826), MAPK4 (NP_001239131), MAPK5 (NP_958927), SPAK (NP_058562), OSR1 (NP_598746), STRADα (NP_001239377), STRADβ (NP_766244), NRK (BAA84943), MINK (AAH52474), TNIK (AAI58060), NIK (NP_058592), Myo3ab (EDL08135), Myo3b (AAX59999).
Figure 2
Figure 2. Cluster dendrograms of yeast Ste20/Ste11 kinases
Dendograms were constructed in absence (A) or presence (B) of protozoan (Capsaspora owczarzaki) OSR1. The amino acid sequences were aligned using VectorNti Suite 6.0 (Invitrogen/Life Technologies), saved as a text file, and then reformatted for use with Promlk, a software component of the Phylogeny Inference Package (PHYLIP) from http://evolution.gs.washington.edu/phylip.html. Length of tree branches can be compared to the reference bar which represents 0.1 amino acid substitutions per site. Note that OSR1 is closest to Saccharomyces cerevisiae Sps1 and Kic1 kinases. Mouse kinase (sequence accession numbers) used: Ksp1 (NP_011950), Bck1 (NP_012440), Ste11 (NP_013466), Ssk22 (NP_009998), Ssk2 (NP_014428), Cdc15 (NP_009411), Sps1 (NP_010811), Kic1 (NP_011970), Ste20 (NP_011856), Skm1 (NP_014528), Cla4 (NP_014101), Sks1 (NP_015299), Vhs1 (NP_010533), and Capsaspora owczarzaki OSR1 (EFW42229).
Figure 3
Figure 3. Evidence for protozoa and plant OSR1 kinase
A) Amino acid sequence alignment of OSR1 proteins of mouse (NCBI accession number: NP_598746), plant (Physcomitrella patens, XP_001784493), protozoa (Capsaspora owczarzaki, EFW42229), and roundworm (C. elegans, NP_507517). B) Percent identity of OSR1 increases from 55% between plant and higher organisms, to 61% between protozoa and higher organisms, to 71% between C. elegans and mouse. C) Evolutionary tree showing the bacterial branch in blue, the archea branch in green, and the eukaryote branch in red. OSR1 is present in eukaryotes, from protist to fungi to plants to animal cells.
Figure 4
Figure 4. Genomic organization of mouse SPAK and OSR1
A) Bar graph of exons 1–17 (exon 18 > 2000 bp) illustrating conservation of exon length between the two Ste20-related kinase genes. B) Bar graph illustrating non-conservation of intronic sequences 1–17 between the two Ste20-related genes. A schematic representation of the kinase is presented in panel A to identify the position of key kinase features.
Figure 5
Figure 5. Characterization of the colonic SPAK isoform
A) Amino acid alignment between the catalytic domains of full-length SPAK and the colonic isoform. Identical residues are indicated by red font over yellow background. B) Modeling of the first 72 amino acids of the colonic SPAK isoform using PSIPRED (http://bioinf.cs.ucl.ac.uk/psipred/). The histogram in blue represents the confidence of the prediction for each amino acid. C = coil, E = strand, H = helix. C) 86Rb influx of mouse NKCC1 co-expressed with mouse WNK4 in Xenopus laevis oocytes with full-length (fl) and colonic (c) SPAK. Bars represent mean ∀ S.E.M (n = 20 – 25 oocytes). The NKCC1-mediated K+ influx is expressed in nmoles/oocyte/hr (unpublished data from Delpire Laboratory).
Figure 6
Figure 6. Amino acid sequence and secondary structure of mouse SPAK
A. The α helices and β sheets (colored in blue and green, respectively) are derived from the crystal structure of the OSR1 catalytic domains (PDB#: 3DAK and 2VWI) and the OSR1 carboxyl-terminal domain (PDB#: 2V3S). The α helices and β sheets (colored in purple) are from modeling based on PSIPRED (http://bioinf.cs.ucl.ac.uk/psipred/). The catalytic domain (residues 75 – 349) is indicated by two vertical lines. The positions of the catalytic-, the Mg2+-binding-, activation segment, P + 1-loop, nuclear localization signal, putative caspase and TRAIL cleavage sites are also indicated. The purple β sheet made of WEW (underlined) constitutes the interaction site for Cab39/MO25 proteins. Asterisks highlight four phospho-threonines in the activation segment, one phospho-serine in the catalytic domain, and one additional phospho-serine in the PF1 domain, all phospho-residues that are part of SPAK activation. The PF2 domain is indicated by “quotations”. Light pink boxes highlight four hydrophobic residues that form the hydrophobic substrate pocket or P + 1 pocket. Key carboxy-terminal residues participating in the binding of the target RFx[V/I] peptides are indicated by a bold font. B. Schematic representation of the structure of SPAK. The secondary structure elements were drawn from a SWISS-MODEL-generated PDB file of SPAK catalytic domain based on the OSR1 crystal structure (PDB: 3DAK). Drawing was made using the Visual Molecular Dynamics software (University of Illinois). The α helices and β sheet are highlighted.
Figure 7
Figure 7. Absence of Function of SPAK F481A mutant
86Rb influx of mouse NKCC1 co-expressed with mouse WNK4 in Xenopus laevis oocytes with wild-type (wt) and mutant (F481A) forms of SPAK. Bars represent mean ∀ S.E.M (n = 20 – 25 oocytes). The NKCC1-mediated K+ influx is expressed in nmoles/oocyte/hr (unpublished data from Delpire Laboratory).
Figure 8
Figure 8. Alignment of 15 SPAK RFx[V/I] motif interacting proteins
A) Proteins with threonine or serine residues located at positions 5 or 6 in docking motif, thus constituting putative targets for basophilic kinases, are indicated in blue. B) Proteins which do not contain threonine or serine residues at positions 5 or 6 in their docking motif. Note that two motifs do have negatively charged residues located at position 5 or 6.
Figure 9
Figure 9. Evidence for PF2-like domains in WNK4
A. Schematic representation of WNK4 with location of 2 putative PF2-like domains. B. Front halves of two overlapping structures: a SWISS-MODEL-based structure of the PF2-like motif of WNK4, drawn in surface style, and the OSR1 PF2 domain (PDB: 2v3s), drawn in licorice style. C. Back halves of the same structures after 180° rotation on its vertical axis. D. The PF2-like motif of WNK4 is drawn in cartoon style to highlight the two beta sheets and the two alpha helices. The amino acid linker (R-R-G-G-R-P) between β1 and β2 is highlighted. E. Alignment of sequence of the PF2 domain of OSR1 and the two PF2-like domains of WNK4. The residues that orient and interact with the RFxV peptides are indicated by open and closed bars and stars.
Figure 10
Figure 10. Schematic representation of the WNK kinases
Each of the four WNK kinases is characterized by short N-terminal region preceding the catalytic domain, and a carboxyl-terminal regulatory domain of variable length. An internal promoter in the WNK1 gene yields a kidney-specific isoform (KS-WNK1) which starts at exon 4a and therefore lacks a functional catalytic domain. Alternative splicing in exon 18 of WNK3 yields a short and long isoform. Single amino acid mutations downstream of the catalytic domain and at the extreme carboxyl-terminal tail of WNK4 which result in PHAII are identified. Multiple putative SPAK/OSR1 interacting motifs (RFx[V/I]) are indicated by labeled arrowheads. An auto-inhibitory domain in WNK1 is identified by a black box and coil-coil domains in WNK1, 3, and 4 are identified by grey boxes.
Figure 11
Figure 11. Conservation of residues in the primary RFxV binding pocket
Amino acid sequence alignment of the primary RFx[V/I] binding pocket of the single cell eukaryote (Capsaspora), roundworm (C. elegans), fruit fly (Drosophila), and mouse (M. musculus). Green and purple bars are delineating the second β sheet and the first α helix, respectively. Black letters on a blue/green background represent conserved residues. Red letters on a yellow background represent identical residues. Light blue and black letters on a white background represent unique residues. Conserved key carboxyl-terminal residues participating in the binding of the target RFx[V/I] peptides are indicated by a bold font.
Figure 12
Figure 12. Model of Na+ secretion and K+ reabsorption in choroid plexus
A. Immunolocalization of SPAK protein on apical membrane of choroid plexus epithelial cells. B. Schematic representation of a choroid plexus epithelial cell, showing the basolateral membrane (blood side) on the left, and the apical membrane (CSF side) on the right. The Na+/K+-ATPase on the apical membrane provides the driving force for Na+ secretion and K+ reabsorption. Activity of apical NKCC1 uncouples the movement of Na+ and K+ by recycling Na+ on the apical membrane. The Na+ entry mechanism on the basolateral side is mediated by N a+-bicarbonate cotransporters, NBCn1, NBCn2. The K+ exit mechanisms on the basolateral side are: (1) K+ channels and (2) KCC, a K-Cl cotransporter. SPAK is drawn at the apical membrane, associated with NKCC1.
Figure 13
Figure 13. Model of bicarbonate secretion in proximal and distal pancreatic duct epithelial cells
In proximal duct, the luminal bicarbonate concentration is low and the Cl concentration is high. HCO3 enters the cell through the basolateral NBCe1, driven by the Na+ gradient, whereas HCO3 exits the cell through SLC26a6 driven by the Cl gradient. In the distal duct, luminal Cl concentration is low and HCO3 exits the cell through a “SPAK-induced” HCO3-permeable CFTR. The movement of bicarbonate is driven by the membrane potential.
Figure 14
Figure 14. Model of salt reabsorption in TAL and DCT
Schematic representation of the nephron showing glomerulus, proximal tubule (PT), Thick Ascending Limb (TAL), Loop of Henle, Distal Convoluted Tubule (DCT), and Collecting Duct (CD). Model of TAL epithelial cell showing major transporters (NKCC2, ROMK, Na+/K+-ATPase, Cl channel) involved in salt reabsorption. OSR1 is illustrated as monomers [1], heterodimers [2], and heterotrimeric complexes with a yet to be identified upstream kinase [3]. Model of DCT epithelial cell showing major transporters (NCC, Na+/K+-ATPase) involved in salt reabsorption. SPAK is illustrated as monomers [4], homodimers [5], heterodimers [6], and heterotrimeric complexes [7].
Figure 15
Figure 15. Regulation of blood volume through distal Na+ reabsorption and blood vessel constriction
Mild hypovolemia through decreases in the glomerular filtration rate (GFR) results in activation of the renin-angiotensin-aldosterone system. Aldosterone, which is released by the adrenal gland, activates ENaC in the collecting duct and through WNK4/SPAK, also activates the Na-Cl cotransporter in the distal convoluted tubule. AngII activates NCC through SPAK/OSR1, and also affects contractility of blood vessels. Severe hypovolemia (or small rises in plasma osmolarity) leads to the release of arginine-vasopressin (AVP or ADH) from the pituitary gland, resulting in the constriction of blood vessels, insertion of water channels in collecting duct epithelial cells, and activation of NCC (blue arrows).

References

    1. Adams JA. Kinetic and catalytic mechanisms of protein kinases. Chem Rev. 2001;101:2271–2290. - PubMed
    1. Adragna NC, Fulvio MD, Lauf PK. Regulation of K-Cl cotransport: from function to genes. J Membr Biol. 2004;201:109–137. - PubMed
    1. Ahlstrom R, Yu AS. Characterization of the kinase activity of a WNK4 protein complex. Am J Physiol Renal Physiol. 2009;297:F685–F692. - PMC - PubMed
    1. Alvarez-Leefmans FJ. Chloride transporters in presynaptic inhibition, pain and neurogenic inflammation. In: Alvarez-Leefmans FJ, Delpire E, editors. Physiology and Pathology of Chloride Transporter and Channels in the Nervous System: From molecules to diseases. London: Academic Press; 2009. pp. 439–470.
    1. Alvarez-Leefmans FJ, Gamiño SM, Giraldez F, Nogueron I. Intracellular chloride regulation in amphibian dorsal root ganglion neurons studied with ion-selective microelectrodes. J Physiol (Lond) 1988;406:225–246. - PMC - PubMed

Publication types

MeSH terms

Substances

LinkOut - more resources