. 2012 Oct;24(10):4236-51.
doi: 10.1105/tpc.112.104901. Epub 2012 Oct 16.

Nonredundant regulation of rice arbuscular mycorrhizal symbiosis by two members of the phosphate transporter1 gene family

Affiliations

Nonredundant regulation of rice arbuscular mycorrhizal symbiosis by two members of the phosphate transporter1 gene family

Shu-Yi Yang et al. Plant Cell. 2012 Oct.

Abstract

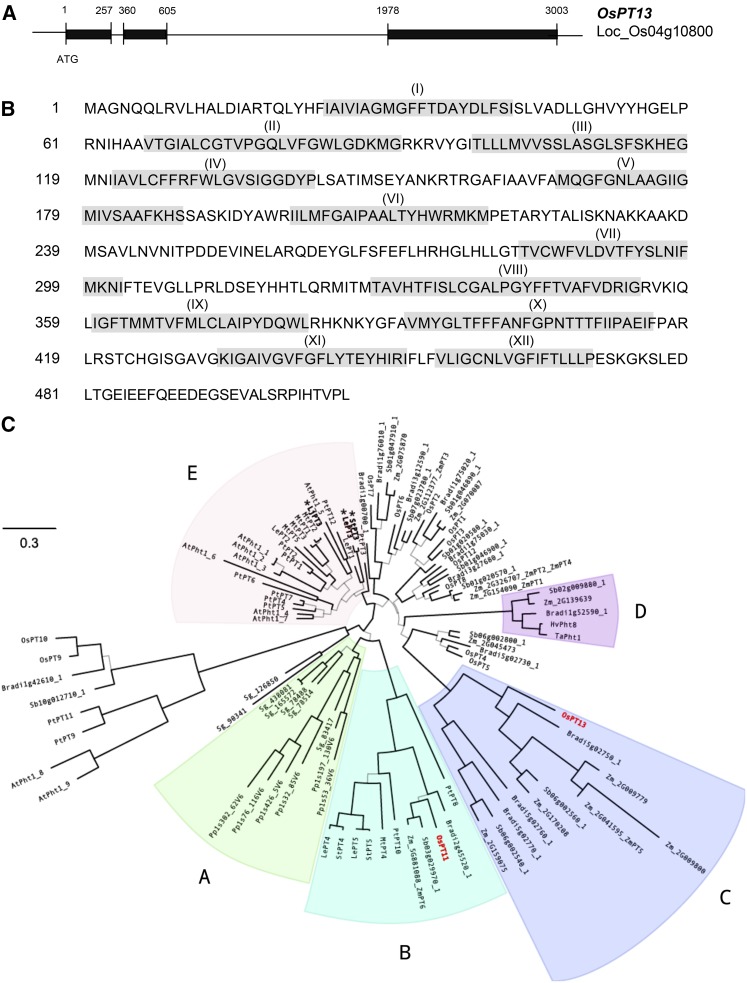
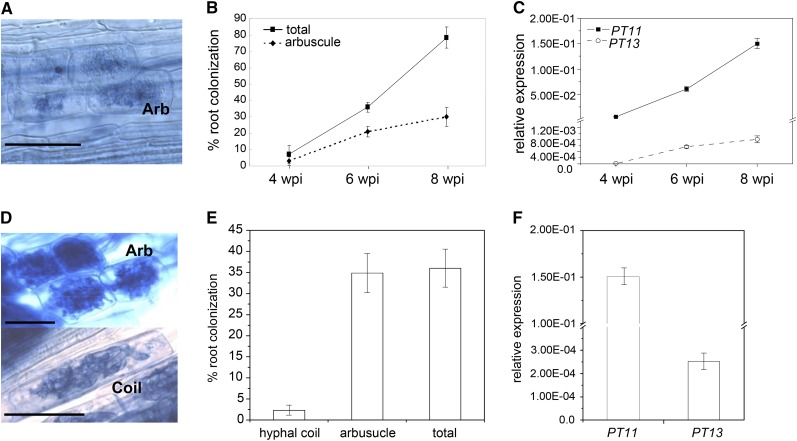
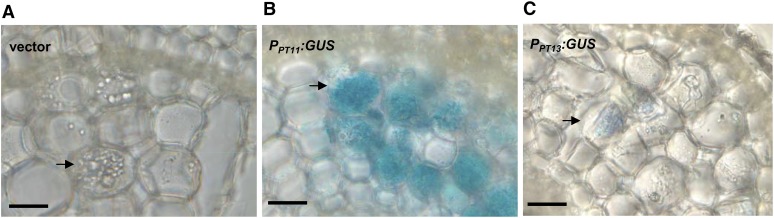
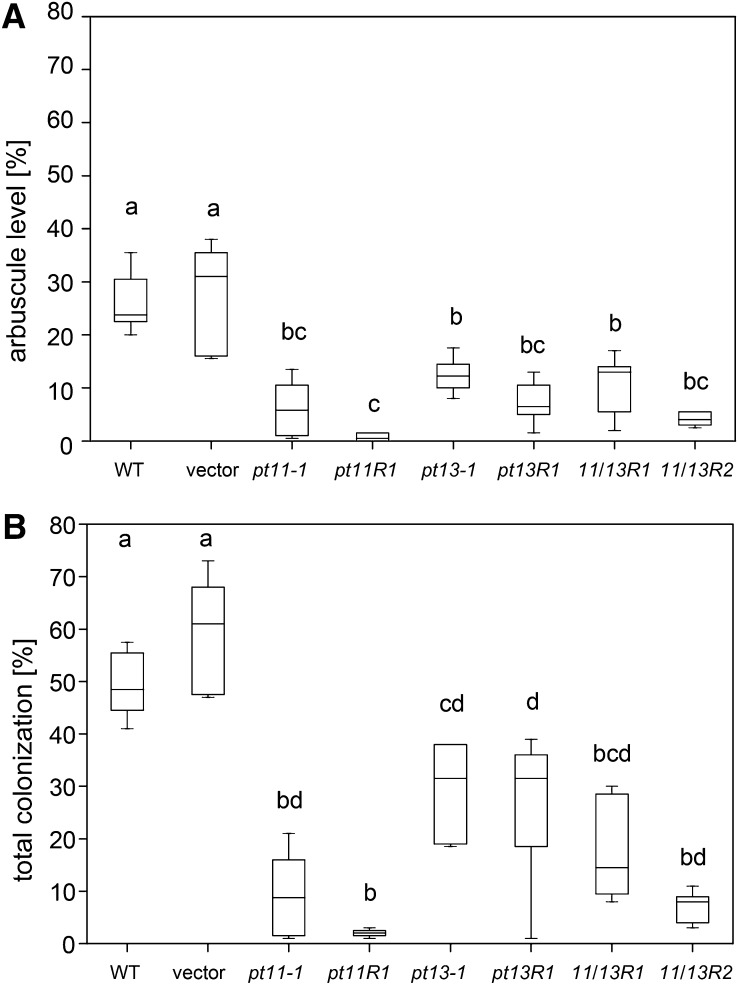
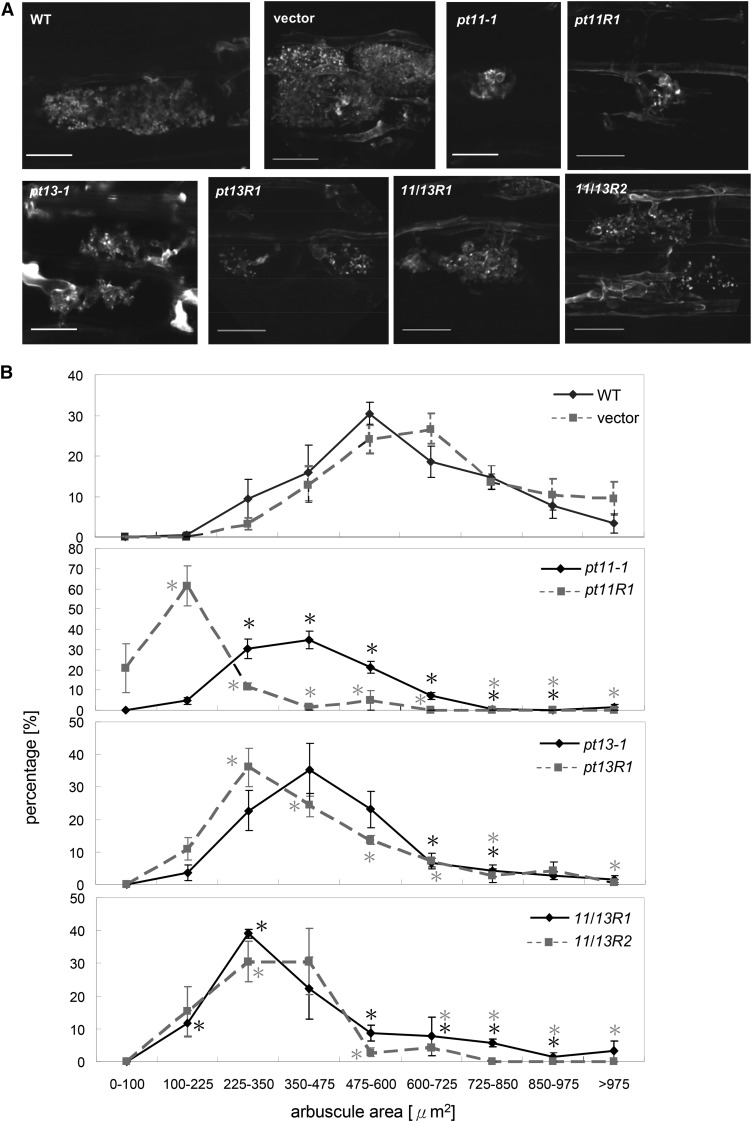
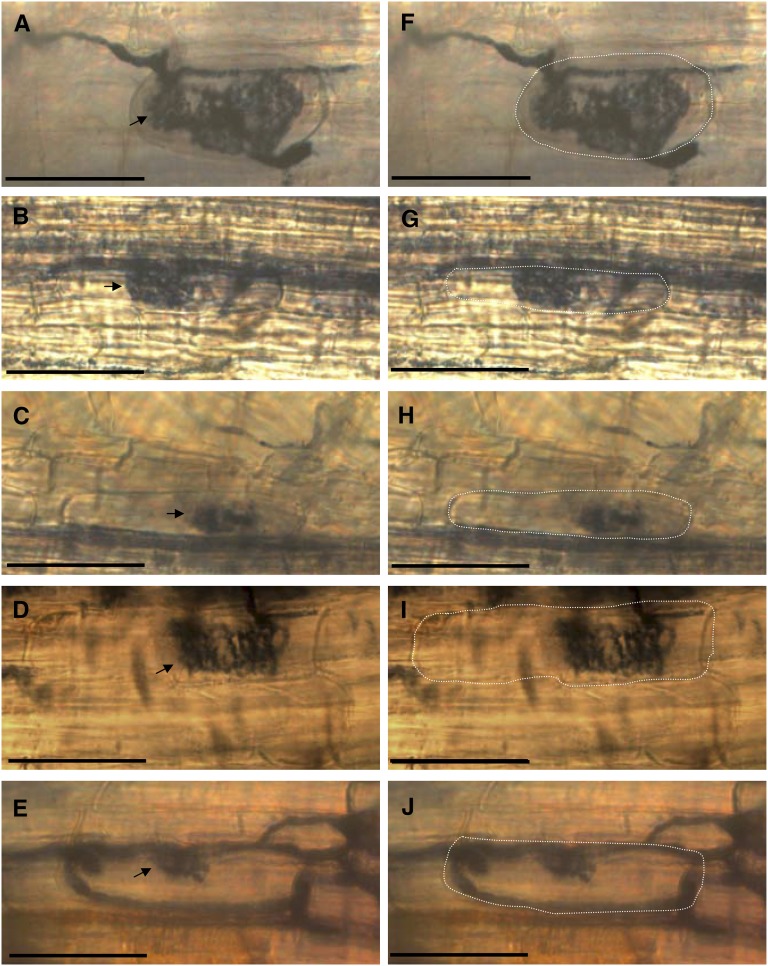
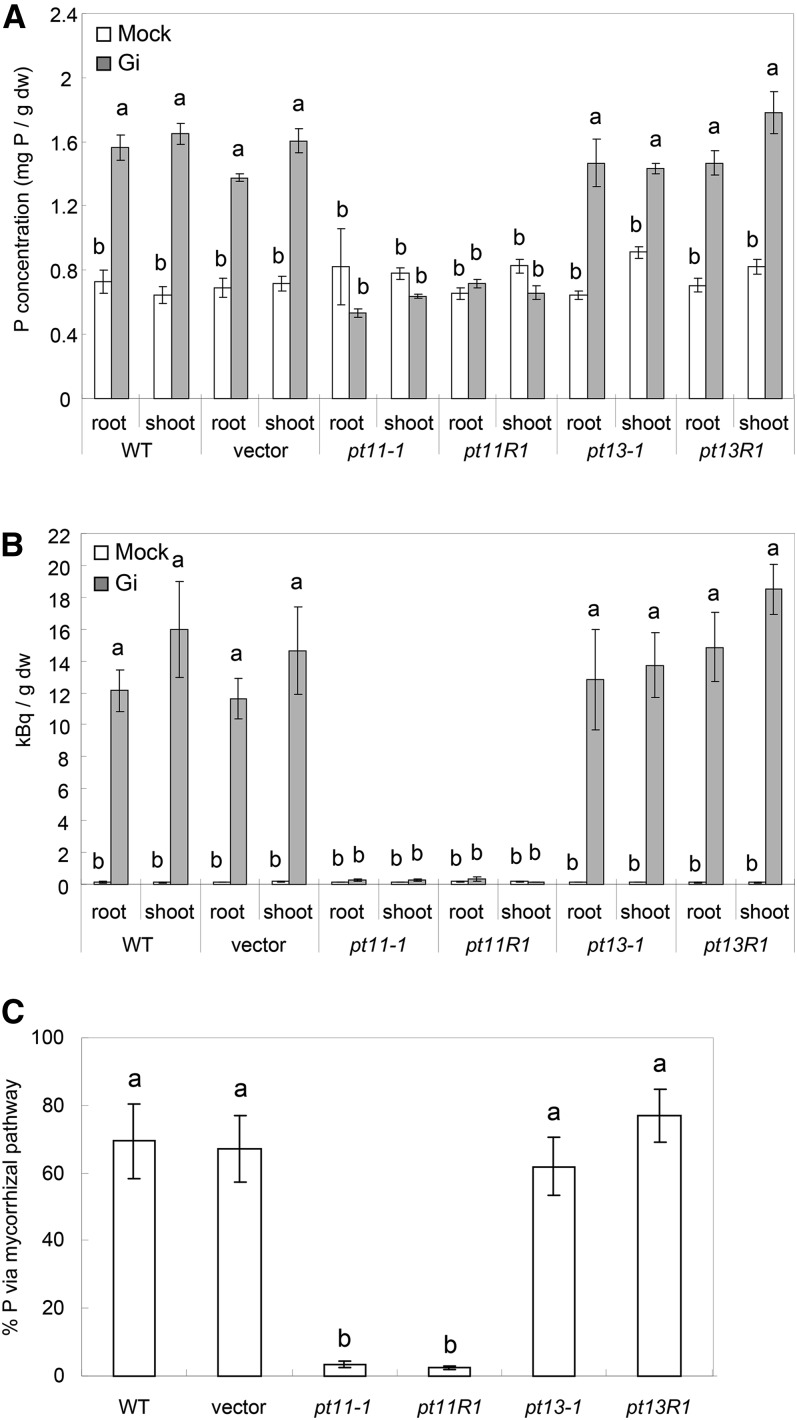
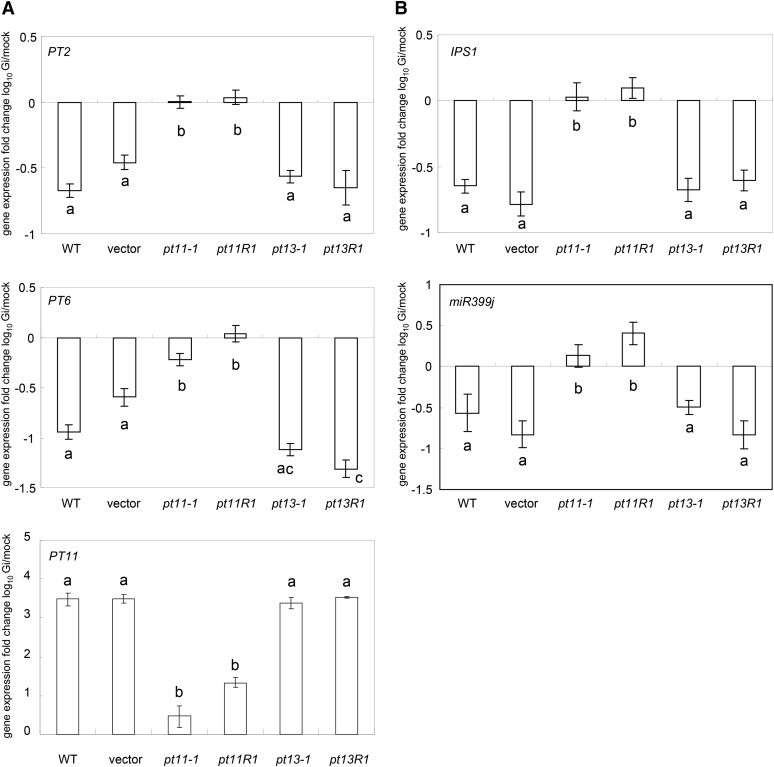
Pi acquisition of crops via arbuscular mycorrhizal (AM) symbiosis is becoming increasingly important due to limited high-grade rock Pi reserves and a demand for environmentally sustainable agriculture. Here, we show that 70% of the overall Pi acquired by rice (Oryza sativa) is delivered via the symbiotic route. To better understand this pathway, we combined genetic, molecular, and physiological approaches to determine the specific functions of two symbiosis-specific members of the PHOSPHATE TRANSPORTER1 (PHT1) gene family from rice, ORYsa;PHT1;11 (PT11) and ORYsa;PHT1;13 (PT13). The PT11 lineage of proteins from mono- and dicotyledons is most closely related to homologs from the ancient moss, indicating an early evolutionary origin. By contrast, PT13 arose in the Poaceae, suggesting that grasses acquired a particular strategy for the acquisition of symbiotic Pi. Surprisingly, mutations in either PT11 or PT13 affected the development of the symbiosis, demonstrating that both genes are important for AM symbiosis. For symbiotic Pi uptake, however, only PT11 is necessary and sufficient. Consequently, our results demonstrate that mycorrhizal rice depends on the AM symbiosis to satisfy its Pi demands, which is mediated by a single functional Pi transporter, PT11.


Figures

Figure 1.
Figure 1.
Gene and Protein Structure of Rice PT13 and Phylogenetic Relationships with Plant PHT1 Proteins. (A) The PT13 gene corresponds to Loc_Os04g10800 and consists of three exons (black boxes). (B) The encoded membrane intrinsic protein comprises 528 amino acids and 12 TM domains (gray boxes). (C) Phylogenetic tree of the PHT1 proteins built with the JTT+Γ model of evolution using PhyML. Branches with bootstrap support higher than 85% are shown in black, while branches with bootstrap support lower than 85% are in gray. PT11 and PT13 are in red. The AM-inducible Pi transporters from dicots that group with regular Pi transporters are displayed in bold letters and are marked by an asterisk. The published maize genes are labeled with the locus identifier and the published name. Phylogenetic lineages are colored and marked A to E for visual emphasis.
Figure 2.
Figure 2.
Expression Analysis of PT11 and PT13 in G. intraradices and G. rosea Colonized Rice Roots. (A) Micrograph of G. intraradices arbuscules (Arb). (B) Total (squares) and arbuscular (diamonds) colonization levels of wild-type roots with G. intraradices at 4, 6, and 8 wpi. (C) Expression of PT11 (squares) and PT13 (circles) at 4, 6, and 8 wpi with G. intraradices. (D) Micrograph of G. rosea arbuscules and coils. Bars = 50 μm. (E) Colonization levels of wild-type rice at 10 wpi with G. rosea. (F) Expression of PT11 and PT13 at 10 wpi with G. rosea. Gene expression levels are shown relative to the expression of the constitutive rice Cyclophilin 2 gene. (B) and (E) Mean values of three biological replicates are shown, each consisting of two pooled plants. (C) and (F) Error bars refer to the se of the mean of three technical repeats. The experiment was repeated twice with similar results.
Figure 3.
Figure 3.
Spatial Expression of PT11 and PT13 Promoters. Histochemical GUS staining of a proportion of a G. intraradices colonized rice root expressing empty vector (A), PPT11-GUS (B), and PPT13-GUS (C) constructs. Arrowheads represent cortical cells containing arbuscules. Bars = 20 μm.
Figure 4.
Figure 4.
G. intraradices Colonization Levels in Single and Double Mutants of PT11 and PT13. Level of G. intraradices arbuscules (A) and total colonization (B) at 8 wpi in control, insertion, and RNAi mutant alleles as indicated. Box plot shows from three to seven biological replicates of each genotype and was generated using the Origin 7 software. The top of the box is the 75th percentile. The bottom of the box is the 25th percentile. The horizontal line intersecting the box is the median value of the group. Horizontal lines above and below the box represent maximum and minimum values. Boxes with dissimilar letters are significantly different at P < 0.01 after one-way analysis of variance (ANOVA) (paired-sample t tests were performed with Bonferroni adjustment). WT, the wild type.
Figure 5.
Figure 5.
G. intraradices Arbuscule Phenotype in Single and Double Mutants of PT11 and PT13. (A) WGA-Alexafluor 488 cell wall staining of G. intraradices structures of control and mutant roots as indicated at 8 wpi. Hyphal septa are recognized by the intense, punctuate fluorescence in all genotypes. WT, the wild type. Bars = 20 μm. (B) Frequency graphs showing the distribution of arbuscule size classes (cross section area) in arbuscule populations measured in control and mutant plants. Mean values of 24 arbuscules per plant and a total of three plants are shown. Error bars refer to se. Asterisks indicate a statistically significant difference from respective wild-type or vector control plants at P < 0.05.
Figure 6.
Figure 6.
Vital Staining of PT11 and PT13 Mutant Roots Colonized by Glomus intraradices. Live fungal structures are stained in roots of the wild type ([A] and [F]), pt11-1 ([B] and [G]), pt11R1 ([C] and [H]), pt13-1 ([D] and [I]), and pt13R1 ([E] and [J]) at 7 wpi. In (F) to (J), the cell boundaries of arbusculated cells were computationally marked by dashed white lines to highlight arbuscule expansion relative to plant cortex cells. Bars = 50 μm.
Figure 7.
Figure 7.
Quantitative Symbiotic Pi Transfer of PT11 and PT13 Mutants. (A) and (B) Tissue concentration of P (A) and 33P (B) in the roots and shoots of G. intraradices (Gi) or mock-inoculated control plants at 8 wpi. dw, dry weight; WT, the wild type. (C) Percentage of contribution of the mycorrhizal pathway to P uptake at 8 wpi in the control and mutant RNAi lines colonized by G. intraradices. The se refers to three to five biological replicates, and each biological replicate consists of a pool of two plants. Bars with dissimilar letters are significantly different at P < 0.01 after one-way ANOVA (paired-sample t tests were performed with Bonferroni adjustment).
Figure 8.
Figure 8.
Expression Patterns of Marker Genes for the Direct and the Symbiotic Uptake Pathway and the Pi Starvation Response in PT11 and PT13 Mutant Lines. Real-time RT-PCR–based expression analysis of PT2 and PT6 for the direct and PT11 for the symbiotic Pi uptake pathway (A) and IPS1 and miR399j for Pi starvation (B) in mock and mycorrhizal roots of control and mutant rice genotypes as indicated. Mean and se values of three biological replicates are shown. The fold changes in gene expression levels of G. intraradices (Gi) relative to mock-inoculated rice are depicted. As PT11 is not expressed in the absence of symbiosis, the mock value was artificially floored to 2.00E-05. Bars with dissimilar letters are significantly different at P < 0.01 after one-way ANOVA (paired-sample t tests were performed with Bonferroni adjustment). WT, the wild type.
Figure 9.
Figure 9.
Gene Expression Analysis of Marker Genes from Roots of Rice Grown in Irrigated and Aerobic Soils. Transcript levels of marker genes were determined from roots of 6-week-old IR66 roots. The genes represent markers for mycorrhizal colonization (AM1, AM3, and AM14) and Pi transporters involved in the direct (PT2 and PT6) and symbiotic Pi uptake pathway (PT11). The fold changes in gene expression levels of rice grown in aerobic (AE) relative to irrigated (IR) soil are depicted. Mean and se values of three biological replicates are shown.

Similar articles

Cited by

References

    1. Ai P., Sun S., Zhao J., Fan X., Xin W., Guo Q., Yu L., Shen Q., Wu P., Miller A.J., Xu G. (2009). Two rice phosphate transporters, OsPht1;2 and OsPht1;6, have different functions and kinetic properties in uptake and translocation. Plant J. 57: 798–809 - PubMed
    1. Araki R., Hasegawa H. (2006). Expression of rice (Oryza sativa L.) genes involved in high-affinity nitrate transport during the period of nitrate induction. Breed. Sci. 56: 295–302
    1. Banks J.A., et al. (2011). The Selaginella genome identifies genetic changes associated with the evolution of vascular plants. Science 332: 960–963 - PMC - PubMed
    1. Barea J. (1991). Vesicular-arbuscular mycorrhizae as modifiers of soil feritlity. In Advances in Soil Science 15, B. Stewart, ed (New York: Springer), pp. 1–40
    1. Bari R., Datt Pant B., Stitt M., Scheible W.R. (2006). PHO2, microRNA399, and PHR1 define a phosphate-signaling pathway in plants. Plant Physiol. 141: 988–999 - PMC - PubMed

Publication types

Substances