. 2013 Jan;27(1):299-312.
doi: 10.1096/fj.12-214312. Epub 2012 Oct 16.

Toll-like receptor 2 ligands promote microglial cell death by inducing autophagy

Affiliations

Toll-like receptor 2 ligands promote microglial cell death by inducing autophagy

Daniela S Arroyo et al. FASEB J. 2013 Jan.

Abstract

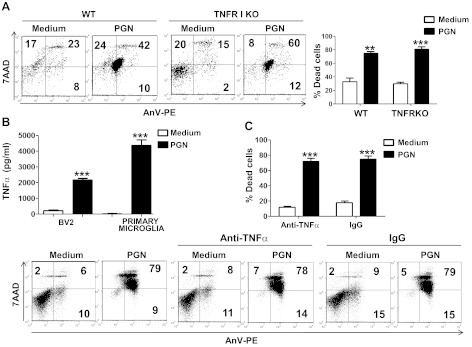
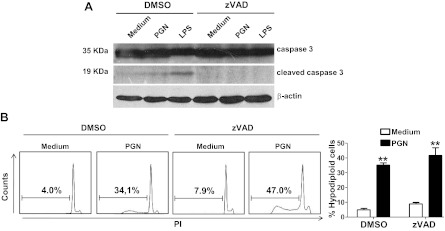
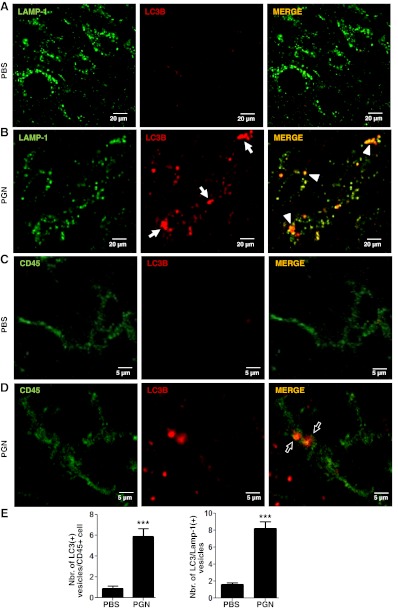
Microglial cells are phagocytes in the central nervous system (CNS) and become activated in pathological conditions, resulting in microgliosis, manifested by increased cell numbers and inflammation in the affected regions. Thus, controlling microgliosis is important to prevent pathological damage to the brain. Here, we evaluated the contribution of Toll-like receptor 2 (TLR2) to microglial survival. We observed that activation of microglial cells with peptidoglycan (PGN) from Staphylococcus aureus and other TLR2 ligands results in cell activation followed by the induction of autophagy and autophagy-dependent cell death. In C57BL/6J mice, intracerebral injection of PGN increased the autophagy of microglial cells and reduced the microglial/macrophage cell number in brain parenchyma. Our results demonstrate a novel role of TLRs in the regulation of microglial cell activation and survival, which are important for the control of microgliosis and associated inflammatory responses in the CNS.


Figures

Figure 1.
Figure 1.
PGN from S. aureus induces microglial cell death. A) BV2 cells cultured in the presence or absence of PGN (20 μg/ml) for 72 h were observed with a phase-contrast microscope, and viable cells were counted. Bar graph represents means ± sd of 3 independent experiments. B) BV2 cells cultured for 48 h in the presence of 2, 10, and 20 μg/ml PGN were fixed with ethanol and stained with propidium iodide (PI), and the percentages of hypodiploid cells were determined by flow cytometry. Histograms of PI red fluorescence are shown; numbers indicate the frequency of hypodiploid cells. Bar graphs represent means ± sd of 3 separate experiments. C) BV2 cells incubated with medium or PGN (20 μg/ml) for 12, 24, or 48 h at 37°C were costained with AnV-PE and 7-AAD and analyzed by flow cytometry. Numbers in dot plots represent the percentage of cells in each quadrant. Data represent 3 independent experiments with similar results. **P < 0.01, ***P < 0.001 vs. unstimulated cells.
Figure 2.
Figure 2.
TNF-α is not involved in PGN-induced microglial cell death. A) Primary microglia from wild-type (WT) or TNFR1-KO mice cultured in the presence or the absence of PGN (20 μg/ml) for 48 h were costained with AnV-PE and 7-AAD and analyzed by flow cytometry. Numbers in dot plots represent the percentage of cells in each quadrant. Bar graphs represent mean ± sd of 3 separated experiments. B) Supernatants from BV2 or primary microglial cells cultured in the presence or absence of PGN (20 μg/ml) for 24 h were measured for TNF-α by an ELISA sandwich assay. ELISA data represent 3 independent experiments. C) BV2 cells incubated with a TNF-α-specific monoclonal antibody (10 μg/ml) or control IgG (10 μg/ml) for 1 h at 37°C were cultured in the presence or absence of PGN (20 μg/ml) for 48 h. Cells were costained with AnV-PE and 7-AAD and analyzed by flow cytometry. Numbers in dot plots represent the percentage of cells in each quadrant. Bar graphs represent means ± sd of 3 separated experiments. **P < 0.01, ***P < 0.001 vs. unstimulated cells.
Figure 3.
Figure 3.
Caspase activation is not required for PGN-induced microglial cell death. A) BV2 cells incubated in the presence of zVAD (20 μM; a pan-caspase inhibitor) or DMSO for 1 h at 37°C were cultured in the presence or absence of PGN (20 μg/ml) or LPS (1 μg/ml) for 24 h at 37°C. Cells were lysed, and caspase-3 was examined by Western immunoblotting. Results represent ≥3 independent experiments. B) BV2 cells cultured in the presence of zVAD or DMSO for 1 h at 37°C were stimulated with PGN for 48 h. Cells were fixed with ethanol and stained with PI, and the percentages of hypodiploid cells were evaluated by flow cytometry. Histograms of PI (red fluorescence) are shown; numbers indicate the frequency of hypodiploid cells. Bar graphs represent means ± sd of 3 separate experiments. **P < 0.01 vs. unstimulated cells.
Figure 4.
Figure 4.
Authophagy is shown by microglial cells stimulated with PGN. BV2 cells were incubated in the presence of DMSO (A) or LY294002 (LY; 50 μM; a PI3K inhibitor; B) for 1 h at 37°C. These cells, cultured in the presence or absence of PGN (C, D) or Pam3CSK4 (E, F; 5 μg/ml) for 24 h were stained with an LC3B-specific antibody and evaluated using a confocal fluorescence microscope. Arrows indicate the presence of LC3B+ punctated cells. Bar graph (G) represents means ± sd of the number of LC3+ vesicles per cell of 3 separate experiments. ***P < 0.001, #P > 0.05 (nonsignificant) vs. unstimulated cells.
Figure 5.
Figure 5.
PGN-induced microglial cell death requires autophagy. A, B) BV2 cells incubated with 3-MA (2.5 mM; a specific inhibitor of autophagy), zVAD (20 μM), or DMSO for 1 h at 37°C were cultured in the presence or absence of PGN (20 μg/ml) for 24 h at 37°C. Cells were lysed, and LC3B, beclin-1, PARP 1, caspase-3, and β-actin were examined by Western immunoblotting. Data are representative of ≥3 independent experiments with similar results. C) BV2 cells incubated with 3-MA, LY294002 (LY) or DMSO for 1 h at 37°C were cultured in the presence or absence of PGN for 48 h. Cells were then costained with AnV-PE and 7-AAD and analyzed by flow cytometry. Numbers in dot plots represent the percentage of cells in each quadrant. Bar graphs represent means ± sd of 3 separate experiments. *P < 0.05, **P < 0.01, ***P < 0.001 vs. unstimulated cells; ****P < 0.001 vs. PGN-stimulated cells.
Figure 6.
Figure 6.
Synthetic TLR2 ligands induce microglial cell death. BV2 cells incubated with 3-MA, LY294002, or DMSO for 1 h at 37°C were cultured in the presence or absence of PGN (20 μg/ml), Pam2CSK4 (100 ng/ml), Pam3CSK4 (5 μg/ml), or MDP (20 μg/ml) for 48 h at 37°C. Then the cells were costained with AnV-PE and 7-AAD and analyzed by flow cytometry. Numbers in dot plots represent the percentage of cells in each quadrant. Bar graphs represent means ± sd of percentage of dead cells of 3 separated experiments. Solid bars indicate control cells incubated with DMSO. ***P < 0.001 vs. unstimulated cells; #P < 0.001 vs. cells stimulated in the absence of inhibitors.
Figure 7.
Figure 7.
PGN-induced autophagy and microglial cell death require TLR2. A) Primary microglia from wild-type (WT) mice were incubated in the presence of LY294002 (50 μM; a PI3K inhibitor) or DMSO for 1 h at 37°C and cultured in the presence or the absence of PGN (20 μg/ml) for 24 h. Primary microglia from TLR2-KO mice were cultured in the presence or the absence of PGN (20 μg/ml) for 24 h. These cells were stained with an LC3B-specific antibody and evaluated using a confocal fluorescence microscope. B, C) Bar graphs represent means ± sd of the number of LC3+ vesicles per cell of 3 separate experiments. D) Primary microglia from WT or TLR2-KO mice cultured in the presence or the absence of PGN (20 μg/ml) for 48 h were costained with AnV-PE and 7-AAD and analyzed by flow cytometry. Numbers in dot plots represent the percentage of cells in each quadrant. Bar graphs represent means ± sd of 3 separate experiments. **P < 0.01, ***P < 0.001, #P > 0.05 (nonsignificant) vs. unstimulated cells; ****P < 0.001 vs. PGN-stimulated cells.
Figure 8.
Figure 8.
PGN induces microglial cell autophagy in vivo. PBS (A, C) or PGN (B, D) was stereotaxically injected into the mouse CPU. After 24 h, 10-μm brain sections were stained with anti-LAMP-1 (green; A, B) or anti-CD45 (green; C, D) plus anti-LC3B (red) antibodies. Alexa Fluor 488 or Alexa Fluor 546 secondary antibodies were used. Slides were analyzed under a laser scanning confocal fluorescence microscope. Arrows indicate the presence of LC3B+ punctated cells. Arrowheads indicate colocalization of LC3B+ vesicles with LAMP-1. Bar graphs (E) represent means ± sd of number of LC3+ vesicles per CD45+ cell of 3 separate experiments. Number of LC3/Lamp-1 double-positive cells was obtained from 10 fields/slide, analyzing the next 3 sections without the needle artifact of 3 separate experiments. ***P < 0.001 vs. unstimulated cells.
Figure 9.
Figure 9.
Microglial and macrophage cell depletion and autophagy after intracerebral injection of PGN. A) PGN or PBS was stereotaxically injected into the mouse CPU. At indicated time points after injections, coronal brain slices of 2.0 mm containing the CPU of one hemisphere were dissected. Tissue was homogenized, and CPU cells were costained with anti-CD45 (FITC), anti-CD11b (APC), AnV-PE (AnV), and 7-AAD and analyzed by flow cytometry gating on CD11b+ CD45+ microglial and macrophage cells. Bar graphs represents means ± sd of frequency of dead cells of 3 separate experiments. B) At indicated time points after injections, 10-μm brain sections were stained with an anti-CD45 (green) primary antibody and then with an Alexa Fluor 488 secondary antibody. Slides were analyzed under a laser scanning confocal fluorescence microscope. Arrowheads indicate parenchymal microglial and macrophage cells (CD45+ stained cells). Bar graphs represent means ± sd of numbers of CD45+ cells obtained from 10 fields/slide, analyzing the next 3 sections without the needle artifact of 3 separate experiments. *P < 0.05, ***P < 0.001 vs. PBS-injected mice.

Similar articles

Cited by

References

    1. Mizushima N., Levine B., Cuervo A. M., Klionsky D. J. (2008) Autophagy fights disease through cellular self-digestion. Nature 451, 1069–1075 - PMC - PubMed
    1. Mehrpour M., Esclatine A., Beau I., Codogno P. (2010) Overview of macroautophagy regulation in mammalian cells. Cell Res. 20, 748–762 - PubMed
    1. Bursch W., Karwan A., Mayer M., Dornetshuber J., Frohwein U., Schulte-Hermann R., Fazi B., Di Sano F., Piredda L., Piacentini M., Petrovski G., Fesus L., Gerner C. (2008) Cell death and autophagy: cytokines, drugs, and nutritional factors. Toxicology 254, 147–157 - PubMed
    1. Maiuri M. C., Zalckvar E., Kimchi A., Kroemer G. (2007) Self-eating and self-killing: crosstalk between autophagy and apoptosis. Nat. Rev. Mol. Cell Biol. 8, 741–752 - PubMed
    1. Nakagawa I., Amano A., Mizushima N., Yamamoto A., Yamaguchi H., Kamimoto T., Nara A., Funao J., Nakata M., Tsuda K., Hamada S., Yoshimori T. (2004) Autophagy defends cells against invading group A Streptococcus. Science 306, 1037–1040 - PubMed

Publication types

LinkOut - more resources