

The skeletal site-specific role of connective tissue growth factor in prenatal osteogenesis
- PMID: 23073844
- PMCID: PMC3752831
- DOI: 10.1002/dvdy.23888
The skeletal site-specific role of connective tissue growth factor in prenatal osteogenesis
Abstract
Background: Connective tissue growth factor (CTGF/CCN2) is a matricellular protein that is highly expressed during bone development. Mice with global CTGF ablation (knockout, KO) have multiple skeletal dysmorphisms and perinatal lethality. A quantitative analysis of the bone phenotype has not been conducted.
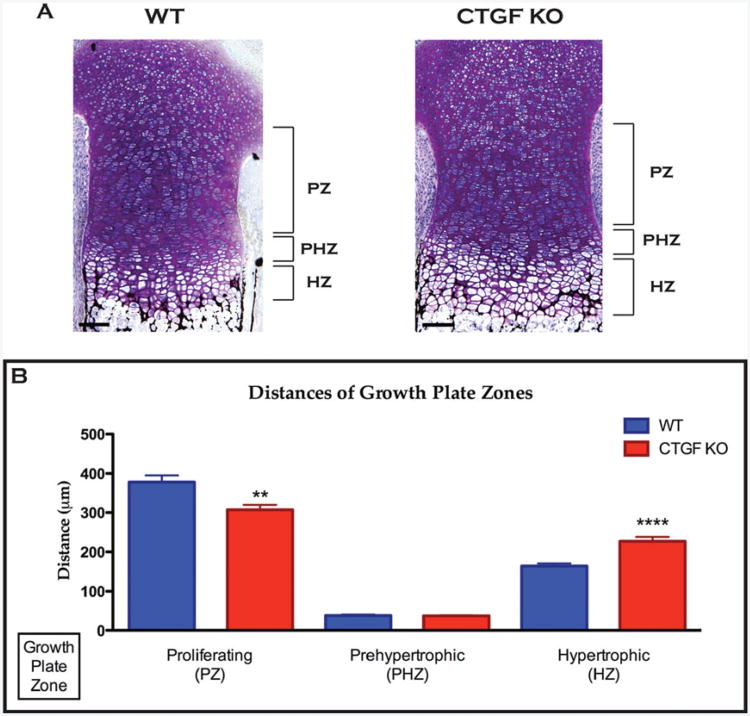
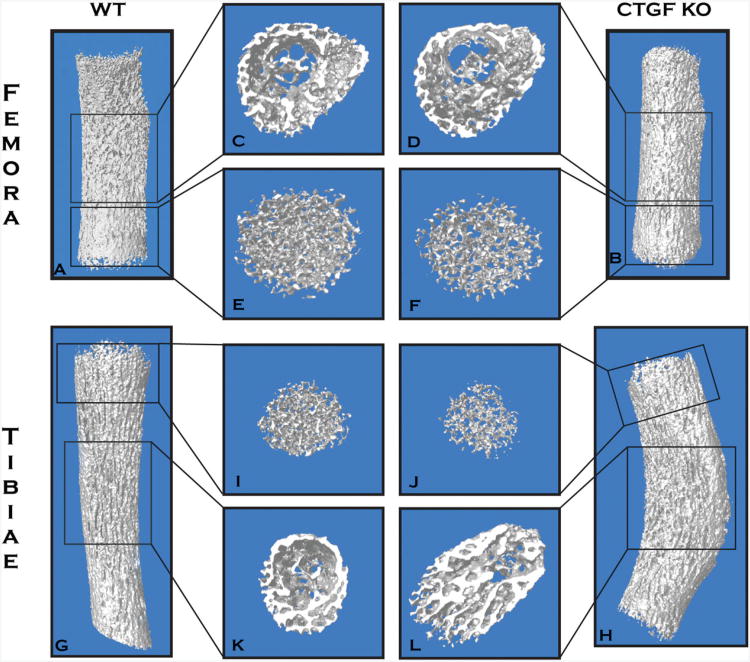
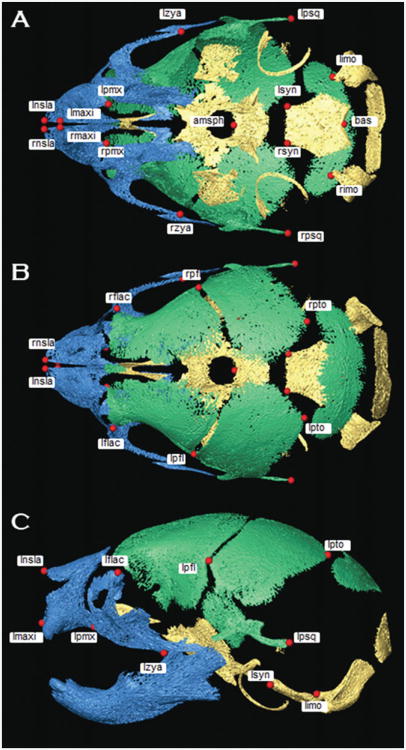
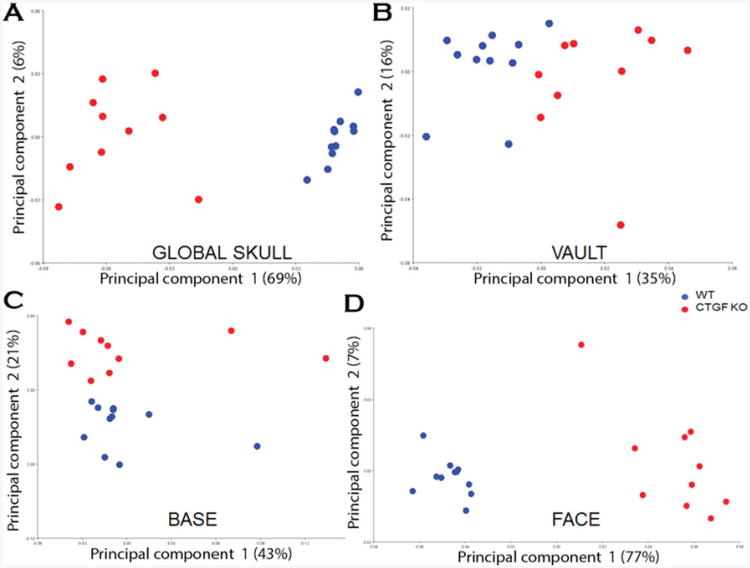
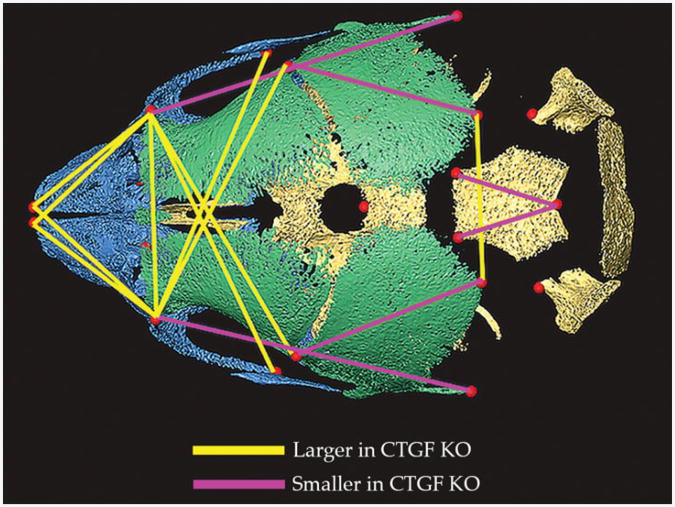
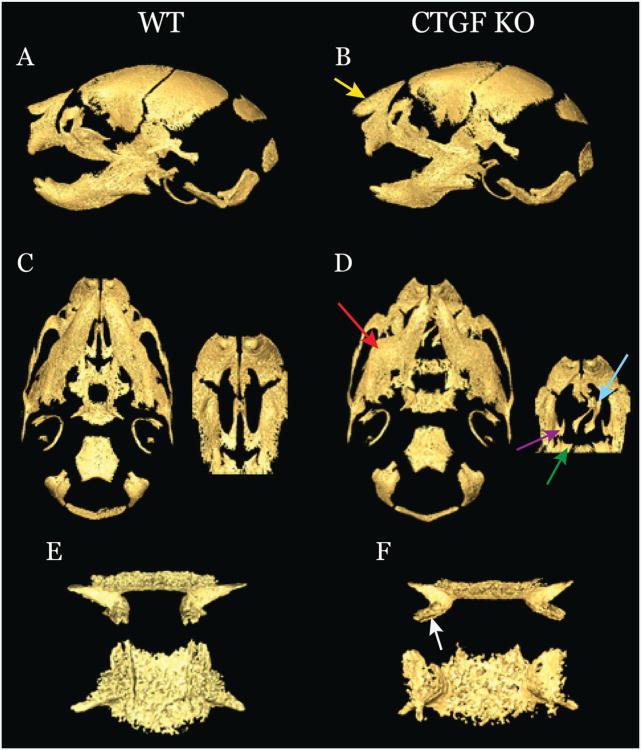
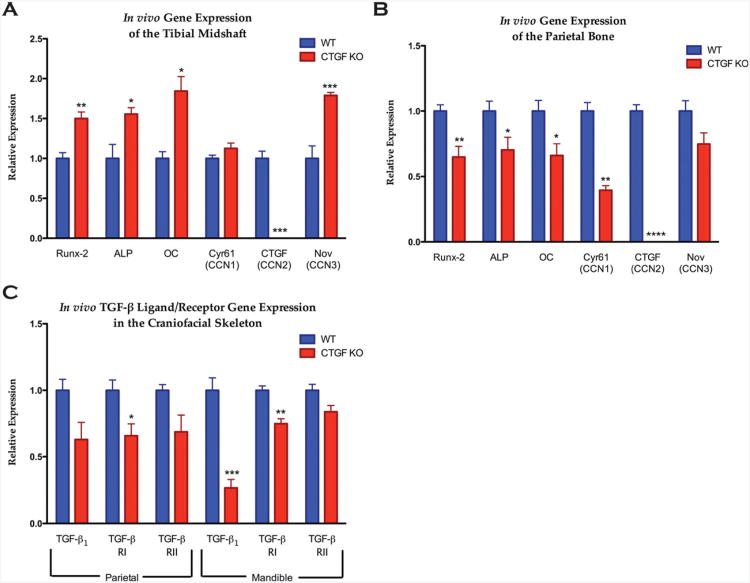
Results: We demonstrated skeletal site-specific changes in growth plate organization, bone microarchitecture, and shape and gene expression levels in CTGF KO compared with wild-type mice. Growth plate malformations included reduced proliferation zone and increased hypertrophic zone lengths. Appendicular skeletal sites demonstrated decreased metaphyseal trabecular bone, while having increased mid-diaphyseal bone and osteogenic expression markers. Axial skeletal analysis showed decreased bone in caudal vertebral bodies, mandibles, and parietal bones in CTGF KO mice, with decreased expression of osteogenic markers. Analysis of skull phenotypes demonstrated global and regional differences in CTGF KO skull shape resulting from allometric (size-based) and nonallometric shape changes. Localized differences in skull morphology included increased skull width and decreased skull length. Dysregulation of the transforming growth factor-β-CTGF axis coupled with unique morphologic traits provides a potential mechanistic explanation for the skull phenotype.
Conclusions: We present novel data on a skeletal phenotype in CTGF KO mice, in which ablation of CTGF causes site-specific aberrations in bone formation.
Copyright © 2012 Wiley Periodicals, Inc.
Figures
Similar articles
-
The role of connective tissue growth factor (CTGF/CCN2) in skeletogenesis.Crit Rev Eukaryot Gene Expr. 2011;21(1):43-69. doi: 10.1615/critreveukargeneexpr.v21.i1.40. Crit Rev Eukaryot Gene Expr. 2011. PMID: 21967332 Free PMC article. Review.
-
Connective tissue growth factor is required for skeletal development and postnatal skeletal homeostasis in male mice.Endocrinology. 2010 Aug;151(8):3490-501. doi: 10.1210/en.2010-0145. Epub 2010 Jun 9. Endocrinology. 2010. PMID: 20534727 Free PMC article.
-
Connective Tissue Growth Factor (CTGF/CCN2) enhances lactogenic differentiation of mammary epithelial cells via integrin-mediated cell adhesion.BMC Cell Biol. 2010 May 24;11:35. doi: 10.1186/1471-2121-11-35. BMC Cell Biol. 2010. PMID: 20497571 Free PMC article.
-
Connective tissue growth factor (CTGF/CCN2) negatively regulates BMP-2 induced osteoblast differentiation and signaling.J Cell Physiol. 2014 May;229(5):672-81. doi: 10.1002/jcp.24491. J Cell Physiol. 2014. PMID: 24127409 Free PMC article.
-
Deregulated expression of connective tissue growth factor (CTGF/CCN2) is linked to poor outcome in human cancer.Int J Cancer. 2015 Aug 1;137(3):504-11. doi: 10.1002/ijc.28972. Epub 2014 May 30. Int J Cancer. 2015. PMID: 24832082 Review.
Cited by
-
CCN proteins in the musculoskeletal system: current understanding and challenges in physiology and pathology.J Cell Commun Signal. 2021 Dec;15(4):545-566. doi: 10.1007/s12079-021-00631-5. Epub 2021 Jul 6. J Cell Commun Signal. 2021. PMID: 34228239 Free PMC article. Review.
-
CCN2/CTGF promotor activity in the developing and adult mouse eye.Cell Tissue Res. 2021 Jun;384(3):625-641. doi: 10.1007/s00441-020-03332-4. Epub 2021 Jan 29. Cell Tissue Res. 2021. PMID: 33512643 Free PMC article.
-
Biallelic variants in CCN2 underlie an autosomal recessive kyphomelic dysplasia.Eur J Hum Genet. 2025 Jan;33(1):30-37. doi: 10.1038/s41431-024-01725-5. Epub 2024 Nov 6. Eur J Hum Genet. 2025. PMID: 39506047 Free PMC article.
-
Platr4 is an early embryonic lncRNA that exerts its function downstream on cardiogenic mesodermal lineage commitment.Dev Cell. 2022 Nov 7;57(21):2450-2468.e7. doi: 10.1016/j.devcel.2022.10.002. Dev Cell. 2022. PMID: 36347239 Free PMC article.
-
Connective tissue growth factor: Role in trabecular meshwork remodeling and intraocular pressure lowering.Exp Biol Med (Maywood). 2023 Aug;248(16):1425-1436. doi: 10.1177/15353702231199466. Epub 2023 Oct 24. Exp Biol Med (Maywood). 2023. PMID: 37873757 Free PMC article. Review.
References
-
- Abdelmagid SM, Barbe MF, Hadjiargyrou M, Owen TA, Razmpour R, Rehman S, Popoff SN, Safadi FF. Temporal and spatial expression of osteoactivin during fracture repair. J Cell Biochem. 2010;111:295–309. - PubMed
Publication types
MeSH terms
Substances
Grants and funding
LinkOut - more resources
Full Text Sources
Molecular Biology Databases
Research Materials
Miscellaneous
