Quantitative assessment of tumor responses after radiation therapy in a DLD-1 colon cancer mouse model using serial dynamic contrast-enhanced magnetic resonance imaging
- PMID: 23074115
- PMCID: PMC3481370
- DOI: 10.3349/ymj.2012.53.6.1147
Quantitative assessment of tumor responses after radiation therapy in a DLD-1 colon cancer mouse model using serial dynamic contrast-enhanced magnetic resonance imaging
Abstract
Purpose: The purpose of this study was to investigate the predictability of pretreatment values including Dynamic Contrast-Enhanced Magnetic Resonance Imaging (DCE-MRI) derived parameters (K(trans), K(ep) and V(e)), early changes in parameters (K(trans), tumor volume), and heterogeneity (standard deviation of K(trans)) for radiation therapy responses via a human colorectal cancer xenograft model.
Materials and methods: A human colorectal cancer xenograft model with DLD-1 cancer cells was produced in the right hind limbs of five mice. Tumors were irradiated with 3 fractions of 3 Gy each for 3 weeks. Baseline and follow up DCE-MRI were performed. Quantitative parameters (K(trans), K(ep) and V(e)) were calculated based on the Tofts model. Early changes in K(trans), standard deviation (SD) of K(trans), and tumor volume were also calculated. Tumor responses were evaluated based on histology. With a cut-off value of 0.4 for necrotic factor, a comparison between good and poor responses was conducted.
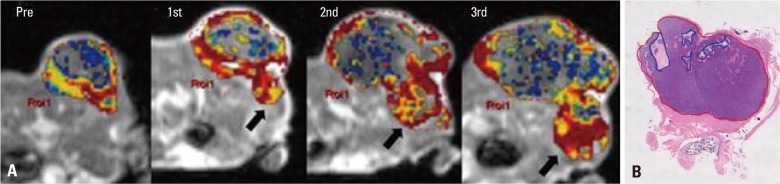
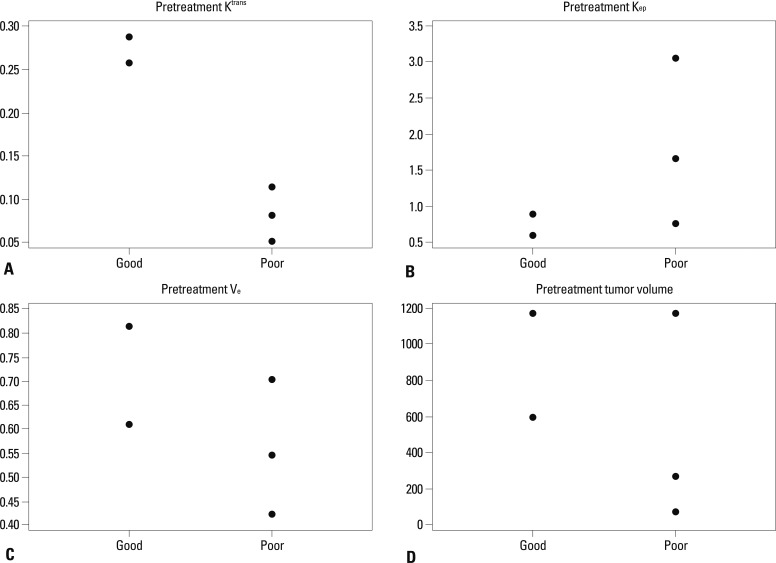
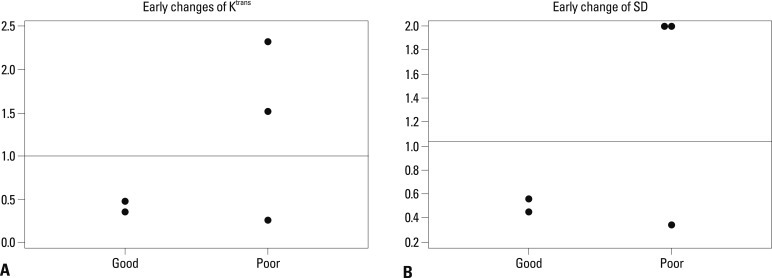
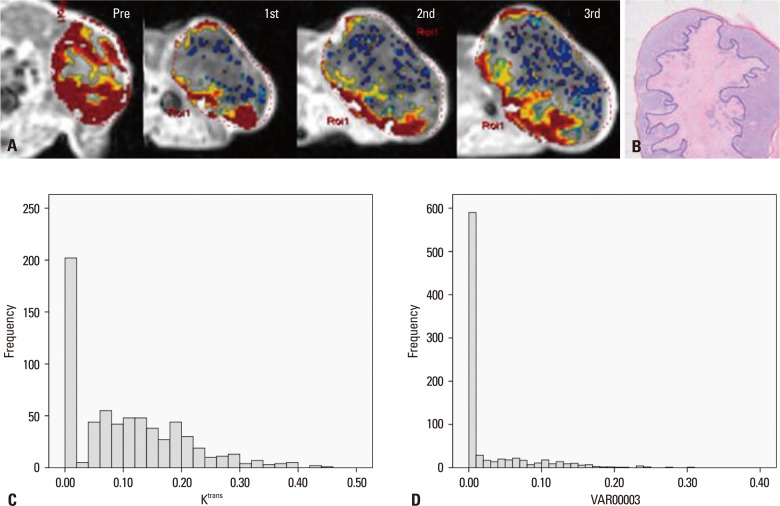
Results: The good response group (mice #1 and 2) exhibited higher pretreatment K(trans) than the poor response group (mice #3, 4, and 5). The good response group tended to show lower pretreatment K(ep), higher pretreatment V(e), and larger baseline tumor volume than the poor response group. All the mice in the good response group demonstrated marked reductions in K(trans) and SD value after the first radiation. All tumors showed increased volume after the first radiation therapy.
Conclusion: The good response after radiation therapy group in the DLD-1 colon cancer xenograft nude mouse model exhibited a higher pretreatment K(trans) and showed an early reduction in K(trans), demonstrating a more homogenous distribution.
Conflict of interest statement
The authors have no financial conflicts of interest.
Figures
References
-
- Lindmark G, Gerdin B, Påhlman L, Bergström R, Glimelius B. Prognostic predictors in colorectal cancer. Dis Colon Rectum. 1994;37:1219–1227. - PubMed
-
- Marsh PJ, James RD, Schofield PF. Adjuvant preoperative radiotherapy for locally advanced rectal carcinoma. Results of a prospective, randomized trial. Dis Colon Rectum. 1994;37:1205–1214. - PubMed
-
- Sauer R, Becker H, Hohenberger W, Rödel C, Wittekind C, Fietkau R, et al. Preoperative versus postoperative chemoradiotherapy for rectal cancer. N Engl J Med. 2004;351:1731–1740. - PubMed
-
- Påhlman L, Glimelius B. The value of adjuvant radio(chemo)therapy for rectal cancer. Eur J Cancer. 1995;31A:1347–1350. - PubMed
-
- Harrison LB, Chadha M, Hill RJ, Hu K, Shasha D. Impact of tumor hypoxia and anemia on radiation therapy outcomes. Oncologist. 2002;7:492–508. - PubMed
Publication types
MeSH terms
LinkOut - more resources
Full Text Sources
Medical
Miscellaneous