

Multicenter precision of cortical and trabecular bone quality measures assessed by high-resolution peripheral quantitative computed tomography
- PMID: 23074145
- PMCID: PMC3577969
- DOI: 10.1002/jbmr.1795
Multicenter precision of cortical and trabecular bone quality measures assessed by high-resolution peripheral quantitative computed tomography
Abstract
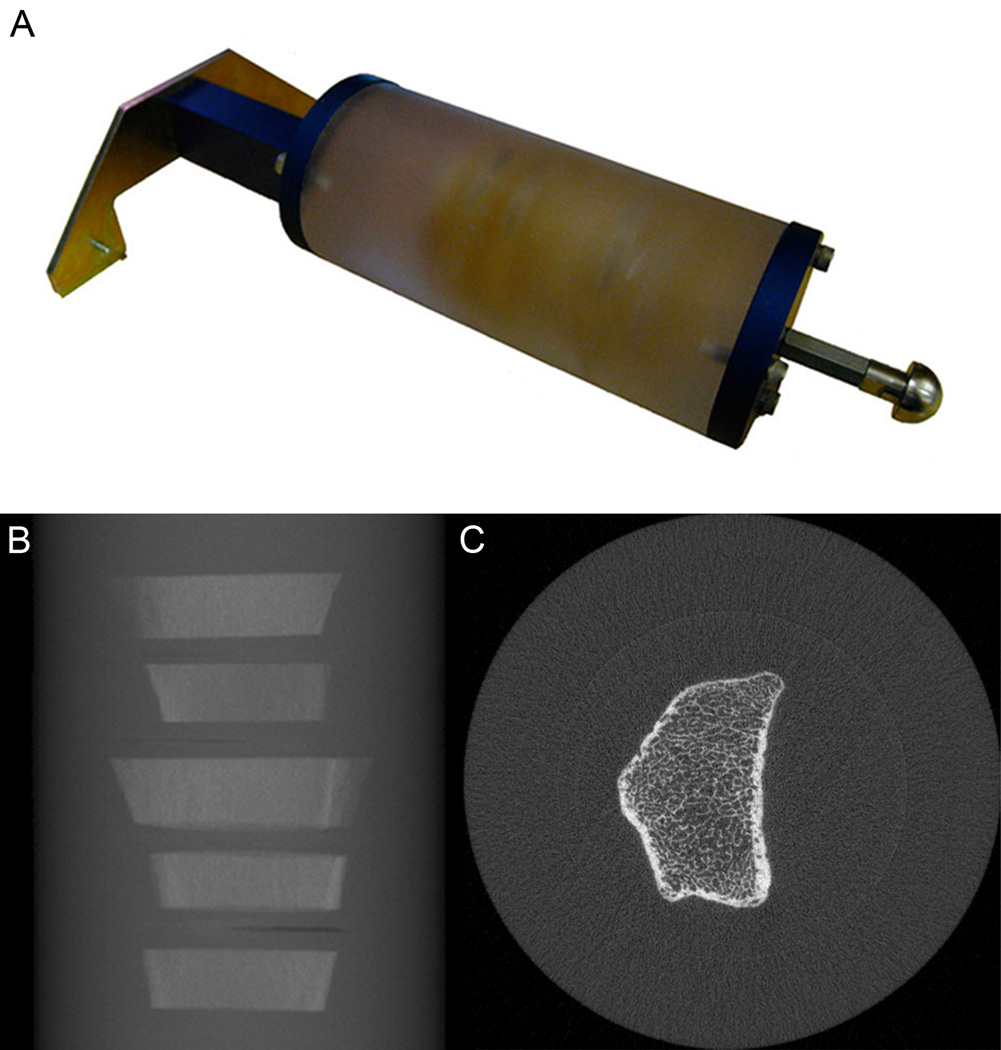
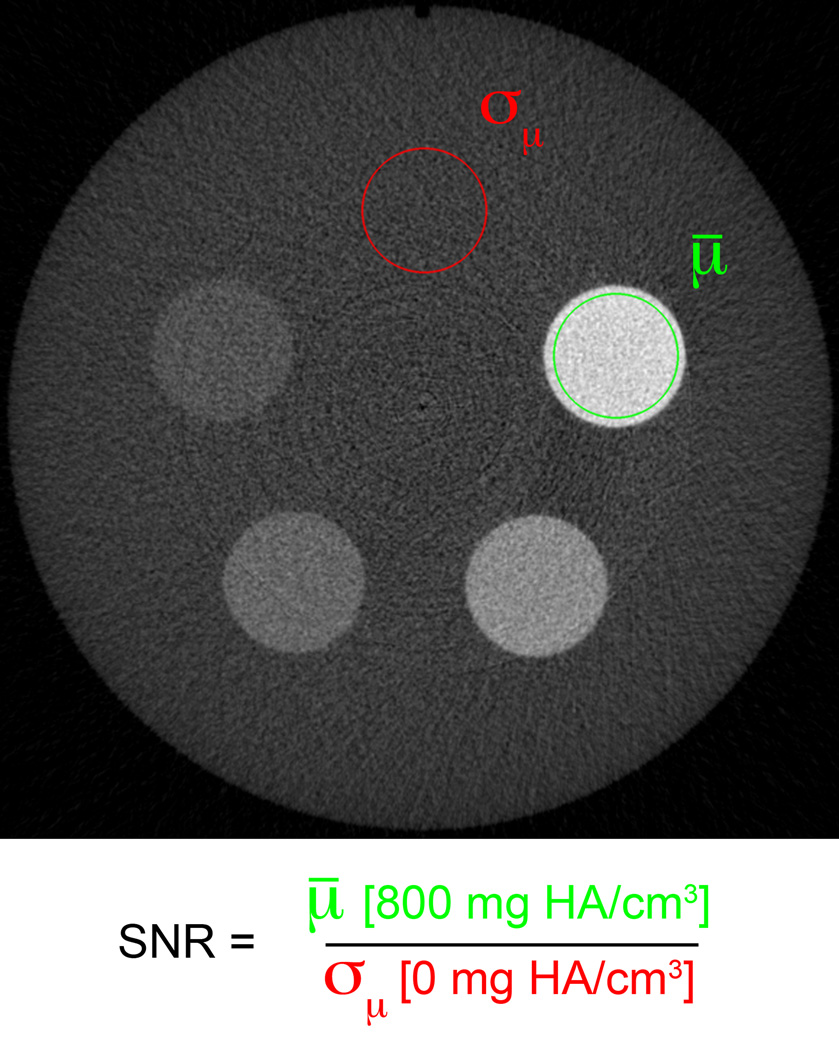
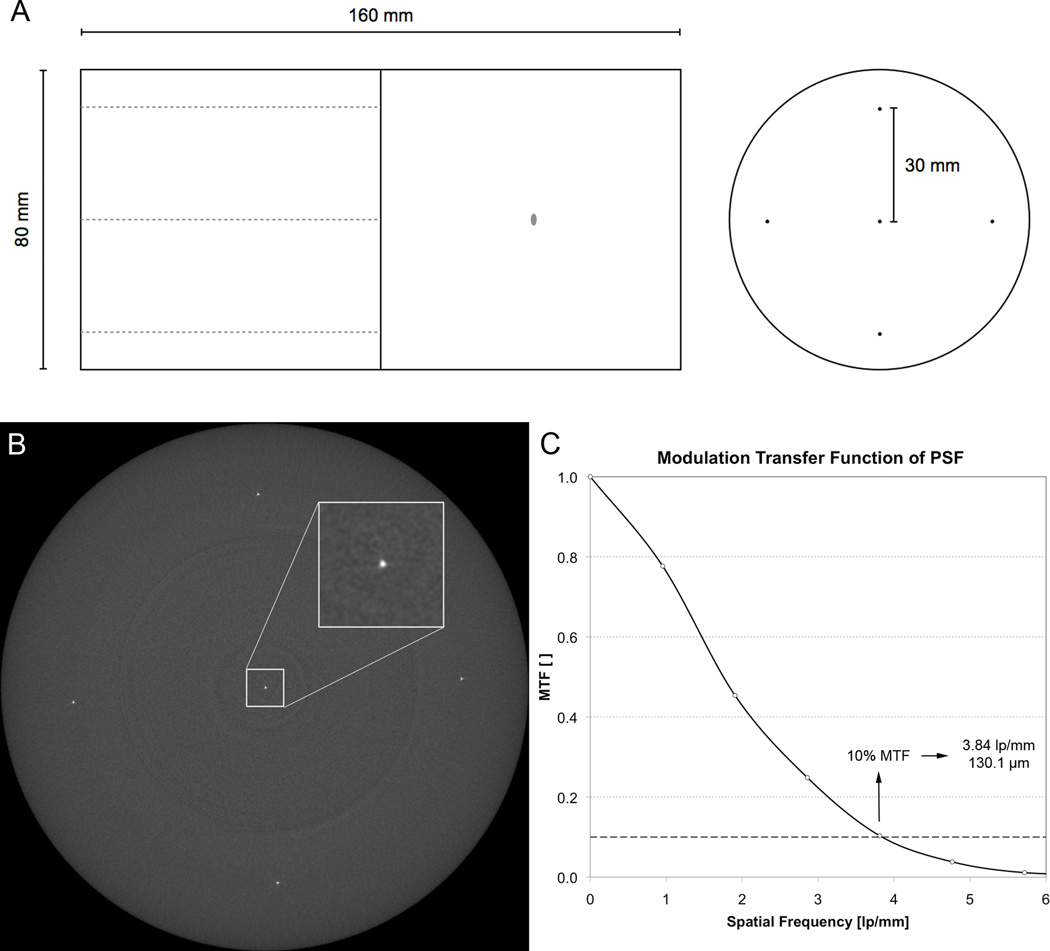
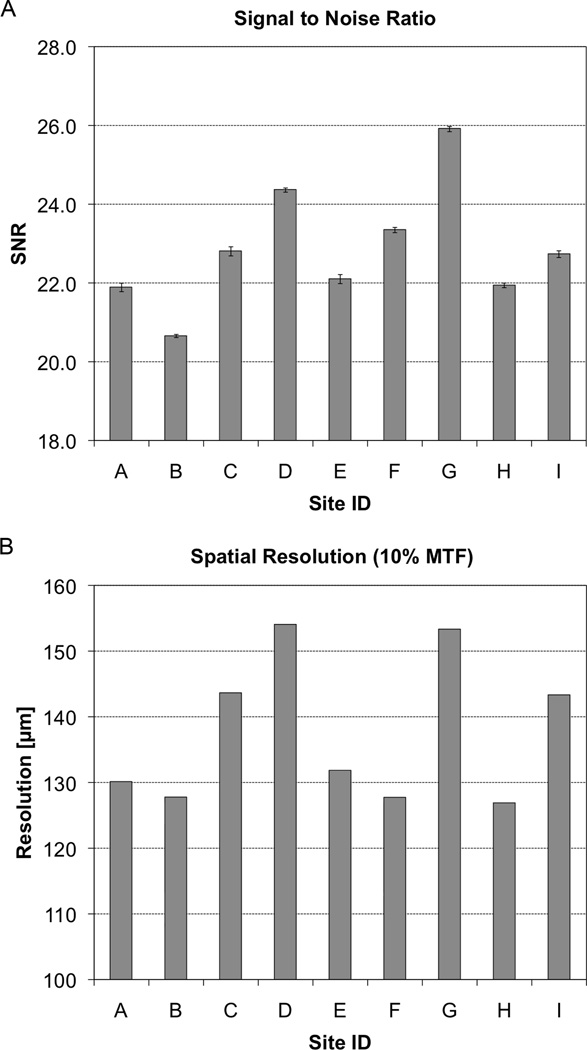
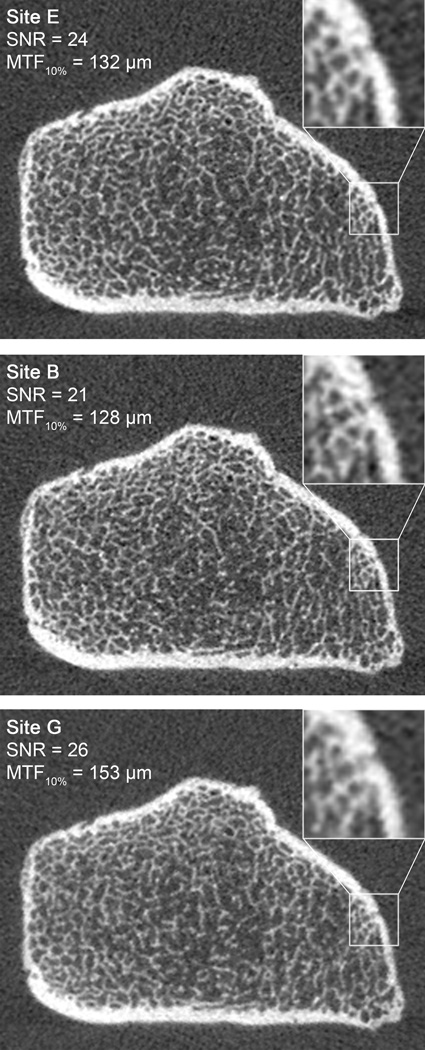
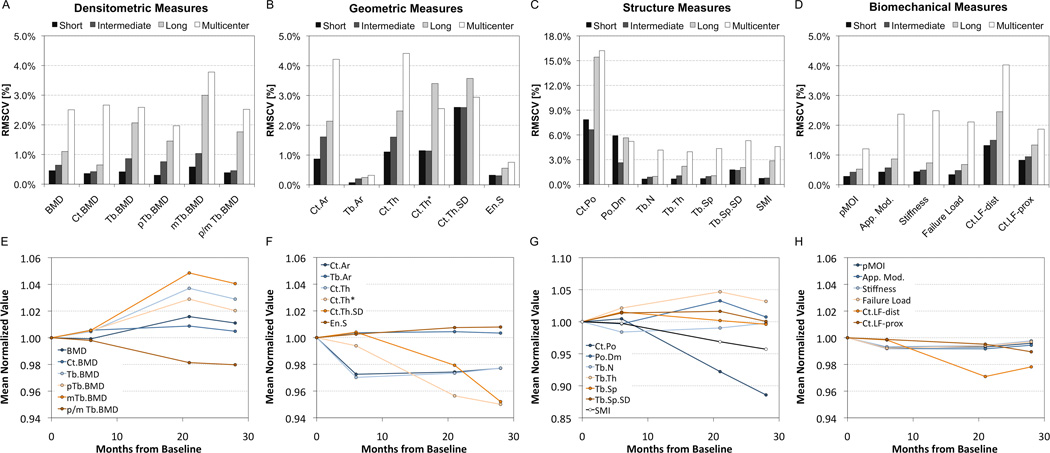
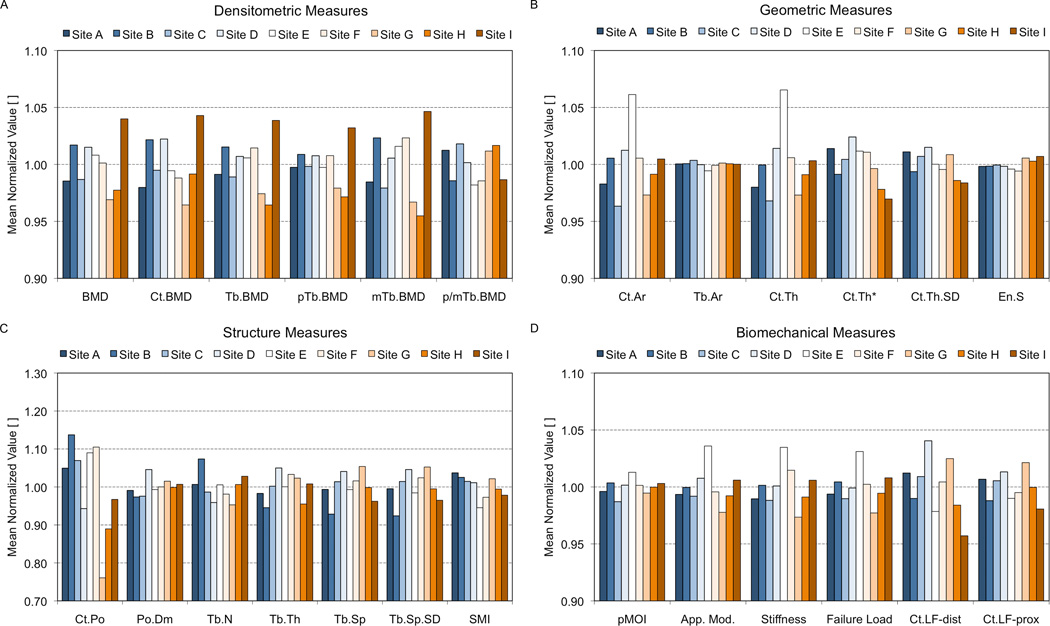
High-resolution peripheral quantitative computed tomography (HR-pQCT) has recently been introduced as a clinical research tool for in vivo assessment of bone quality. The utility of this technology to address important skeletal health questions requires translation to standardized multicenter data pools. Our goal was to evaluate the feasibility of pooling data in multicenter HR-pQCT imaging trials. Reproducibility imaging experiments were performed using structure and composition-realistic phantoms constructed from cadaveric radii. Single-center precision was determined by repeat scanning over short-term (<72 hours), intermediate-term (3-5 months), and long-term intervals (28 months). Multicenter precision was determined by imaging the phantoms at nine different HR-pQCT centers. Least significant change (LSC) and root mean squared coefficient of variation (RMSCV) for each interval and across centers was calculated for bone density, geometry, microstructure, and biomechanical parameters. Single-center short-term RMSCVs were <1% for all parameters except cortical thickness (Ct.Th) (1.1%), spatial variability in cortical thickness (Ct.Th.SD) (2.6%), standard deviation of trabecular separation (Tb.Sp.SD) (1.8%), and porosity measures (6% to 8%). Intermediate-term RMSCVs were generally not statistically different from short-term values. Long-term variability was significantly greater for all density measures (0.7% to 2.0%; p < 0.05 versus short-term) and several structure measures: cortical thickness (Ct.Th) (3.4%; p < 0.01 versus short-term), cortical porosity (Ct.Po) (15.4%; p < 0.01 versus short-term), and trabecular thickness (Tb.Th) (2.2%; p < 0.01 versus short-term). Multicenter RMSCVs were also significantly higher than short-term values: 2% to 4% for density and micro-finite element analysis (µFE) measures (p < 0.0001), 2.6% to 5.3% for morphometric measures (p < 0.001), whereas Ct.Po was 16.2% (p < 0.001). In the absence of subject motion, multicenter precision errors for HR-pQCT parameters were generally less than 5%. Phantom-based multicenter precision was comparable to previously reported in in vivo single-center precision errors, although this was approximately two to five times worse than ex vivo short-term precision. The data generated from this study will contribute to the future design and validation of standardized procedures that are broadly translatable to multicenter study designs.
Copyright © 2013 American Society for Bone and Mineral Research.
Figures
References
-
- Boutroy S, Bouxsein ML, Munoz F, Delmas PD. In vivo assessment of trabecular bone microarchitecture by high-resolution peripheral quantitative computed tomography. J Clin Endocrinol Metab. 2005;90(12):6508–6515. - PubMed
-
- Burghardt AJ, Kazakia GJ, Majumdar S. A local adaptive threshold strategy for high resolution peripheral quantitative computed tomography of trabecular bone. Ann Biomed Eng. 2007;35(10):1678–1686. - PubMed
-
- Macneil JA, Boyd SK. Bone strength at the distal radius can be estimated from high-resolution peripheral quantitative computed tomography and the finite element method. Bone. 2008;42(6):1203–1213. - PubMed
-
- MacNeil JA, Boyd SK. Accuracy of high-resolution peripheral quantitative computed tomography for measurement of bone quality. Med Eng Phys. 2007;29(10):1096–1105. - PubMed
Publication types
MeSH terms
Grants and funding
LinkOut - more resources
Full Text Sources
Other Literature Sources
Medical
