

Self-organization of domain structures by DNA-loop-extruding enzymes
- PMID: 23074191
- PMCID: PMC3526278
- DOI: 10.1093/nar/gks925
Self-organization of domain structures by DNA-loop-extruding enzymes
Abstract
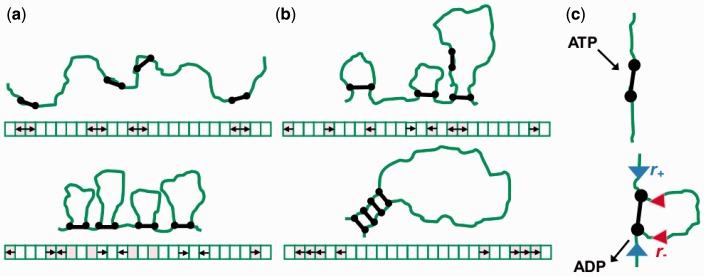
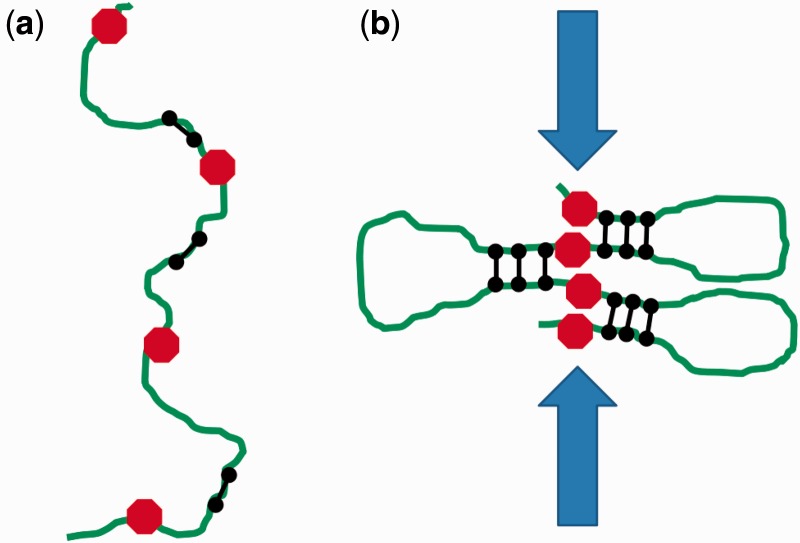
The long chromosomal DNAs of cells are organized into loop domains much larger in size than individual DNA-binding enzymes, presenting the question of how formation of such structures is controlled. We present a model for generation of defined chromosomal loops, based on molecular machines consisting of two coupled and oppositely directed motile elements which extrude loops from the double helix along which they translocate, while excluding one another sterically. If these machines do not dissociate from DNA (infinite processivity), a disordered, exponential steady-state distribution of small loops is obtained. However, if dissociation and rebinding of the machines occurs at a finite rate (finite processivity), the steady state qualitatively changes to a highly ordered 'stacked' configuration with suppressed fluctuations, organizing a single large, stable loop domain anchored by several machines. The size of the resulting domain can be simply regulated by boundary elements, which halt the progress of the extrusion machines. Possible realizations of these types of molecular machines are discussed, with a major focus on structural maintenance of chromosome complexes and also with discussion of type I restriction enzymes. This mechanism could explain the geometrically uniform folding of eukaryote mitotic chromosomes, through extrusion of pre-programmed loops and concomitant chromosome compaction.
Figures
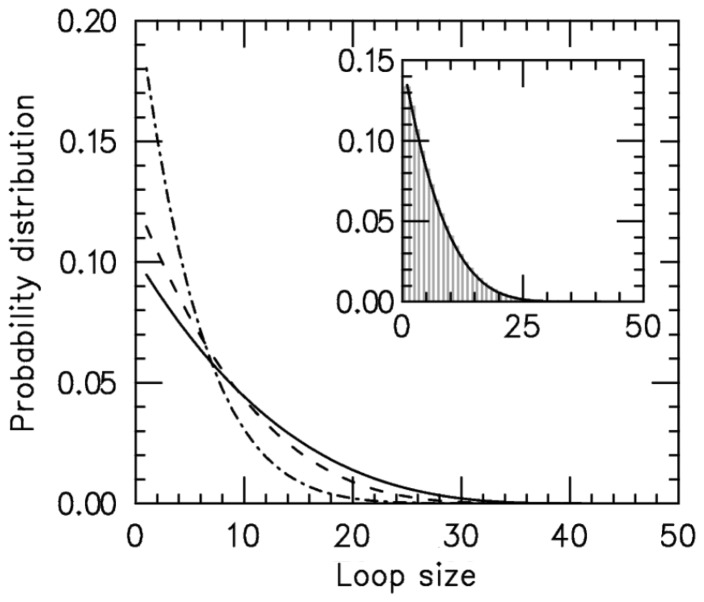
 ) increases. Main figure shows results for
  1.05 (dot-dashed line), 1.5 (dashed line) and 4.0 (solid line). Inset: comparison of steady-state loop-size distributions for exact statistical theory (solid black line) and kinetic simulation
  (gray bars); difference between them is negligibly small. The simulation was run
  times, each for a time of
  Standard errors for the histogram bars have a maximum value of
  and are invisible on this plot.
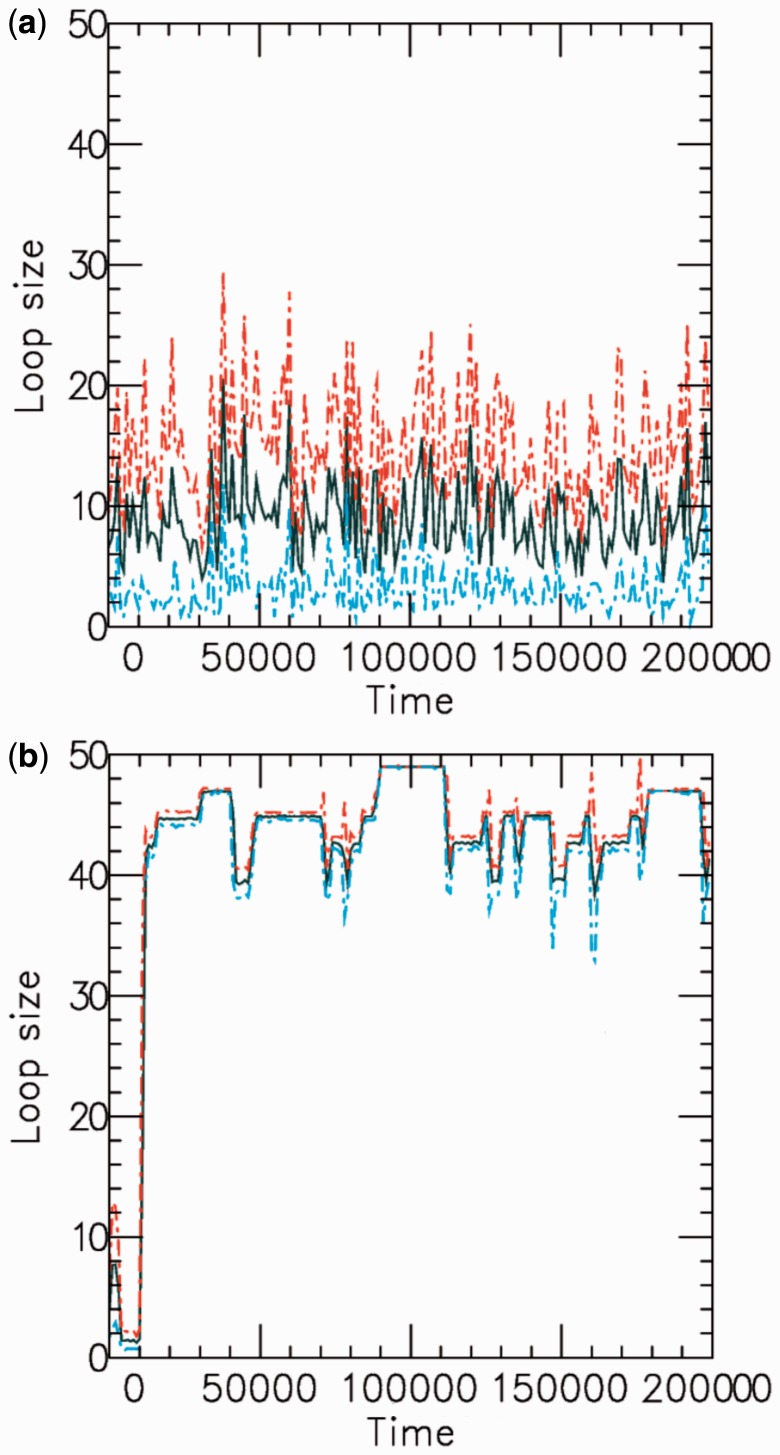
 for a (a) non-disassociating and a (b) dissociating case (
 ), for M = 5 machines on a substrate of length L = 50. The dark solid line shows the average of the sizes of the M loops, and the red and blue dashed lines indicate the width (one standard deviation) of the distribution of loop sizes subtended by the machines as a function of time. As in all cases mentioned in this article, time is in units of
  .
.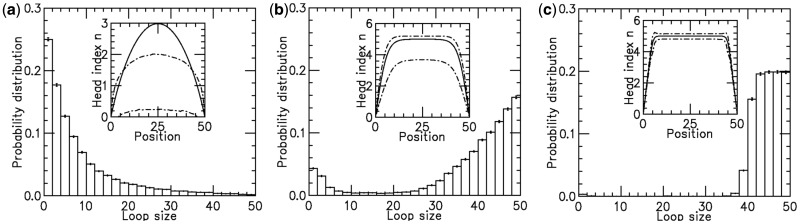
 for different motor biases
  (a), 1.50 (b) and 4.00 (c). Panels (a–c) show loop-size distributions for the simulation steady state: as bias is increased, a peak grows at
  as motor pairs begin to trap the entire domain. Each panel was computed using
  simulations each of total time
  The maximum size of the standard error bars for the histograms are
  and
and  for panels (a)–(c), respectively. The insets show the motor position (labeled ‘head index’) index
  along the lattice: dashed lines show the average ( 1 SD for the simulations (standard error bars for the insets are invisible on this plot); solid curves show average obtained from approximate effective Boltzmann description of the steady state. As bias is increased, fluctuations are suppressed and the motors become ‘stacked’.
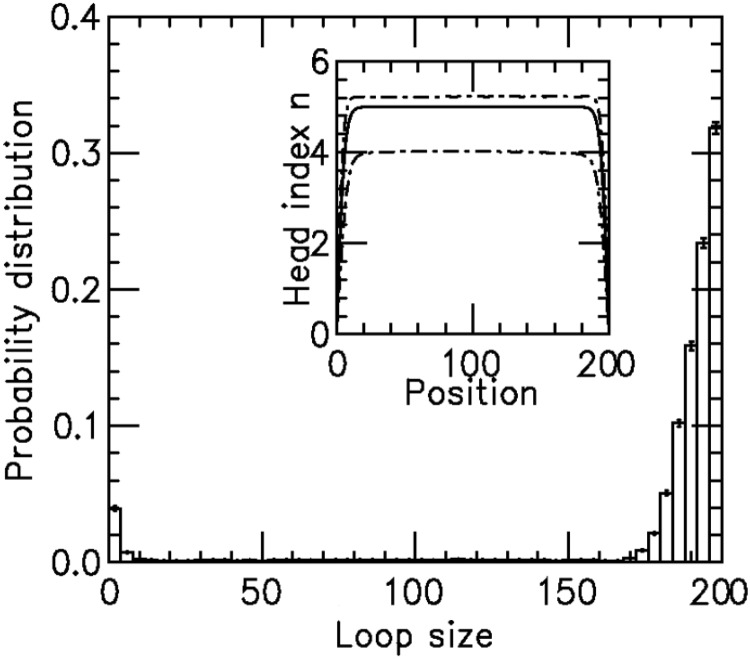
 , and M = 5 motor pairs. The simulation was run
  times, each for a time of
  The maximum size of the standard error bars is
  For the
  profile (inset, labeled ‘head index’), the solid line is the effective Boltzmann theory, dashed lines show average ± 1 SD of the simulation
  distribution; standard errors of the simulation results are negligibly small. Dissociation rate is
  .
.
References
-
- Nielsen HJ, Ottesen JR, Youngren B, Austin SJ, Hansen FG. The Escherichia coli chromosome is organized with the left and right chromosome arms in separate cell halves. Mol. Microbiol. 2006;62:331–338. - PubMed
Publication types
MeSH terms
Substances
Grants and funding
LinkOut - more resources
Full Text Sources
Other Literature Sources
