. 2012 Nov;14(11):1367-78.
doi: 10.1093/neuonc/nos262. Epub 2012 Oct 16.

Osteopontin increases heme oxygenase-1 expression and subsequently induces cell migration and invasion in glioma cells

Affiliations

Osteopontin increases heme oxygenase-1 expression and subsequently induces cell migration and invasion in glioma cells

Dah-Yuu Lu et al. Neuro Oncol. 2012 Nov.

Abstract

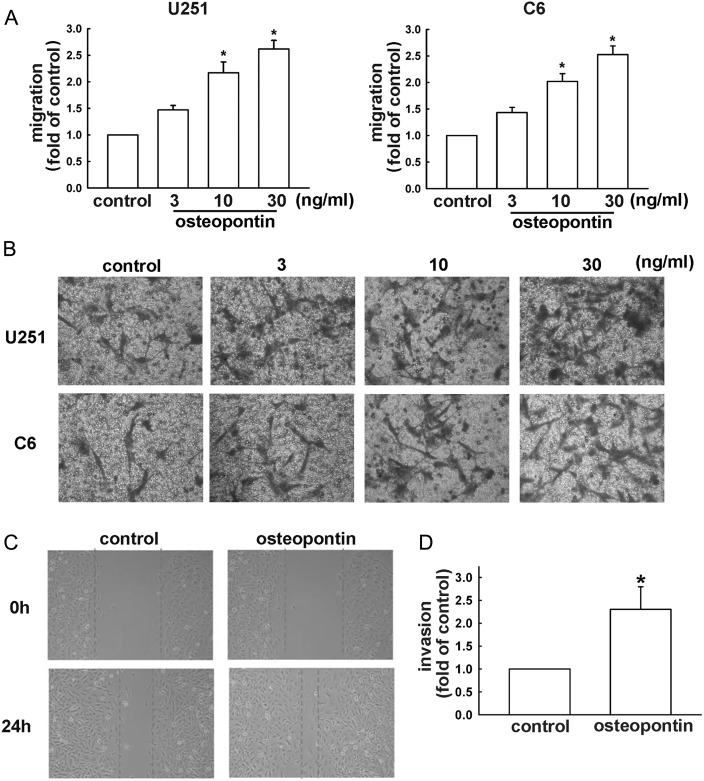
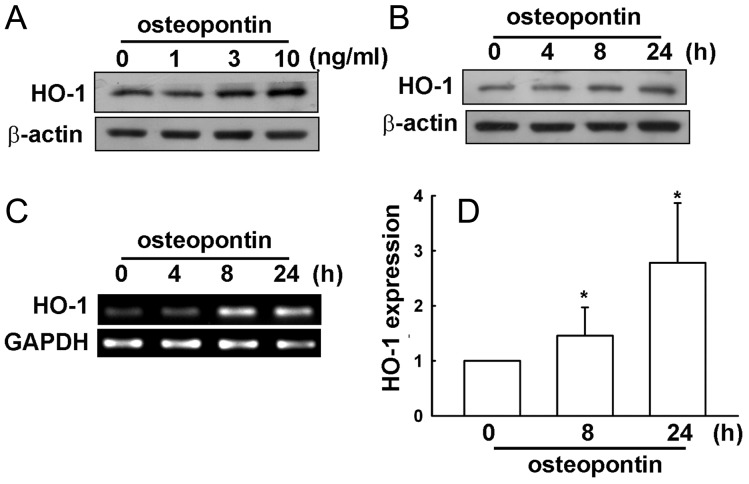
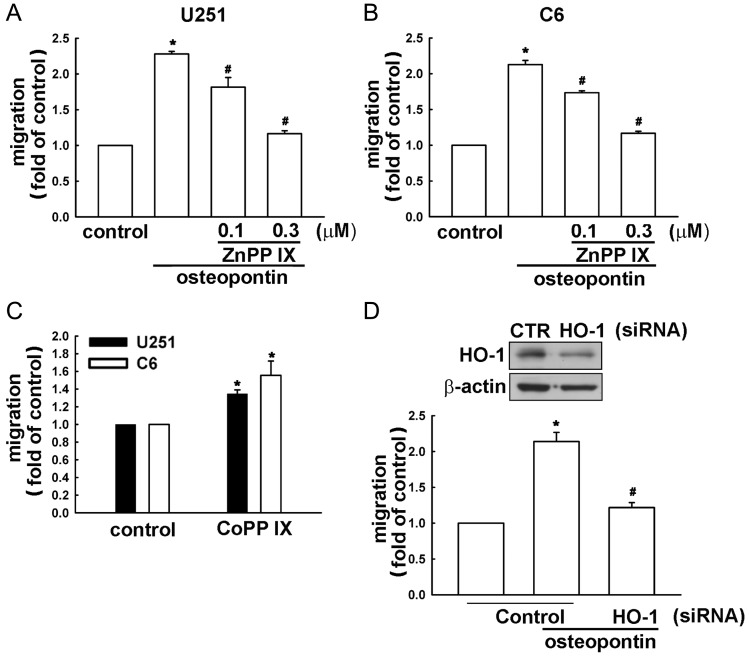
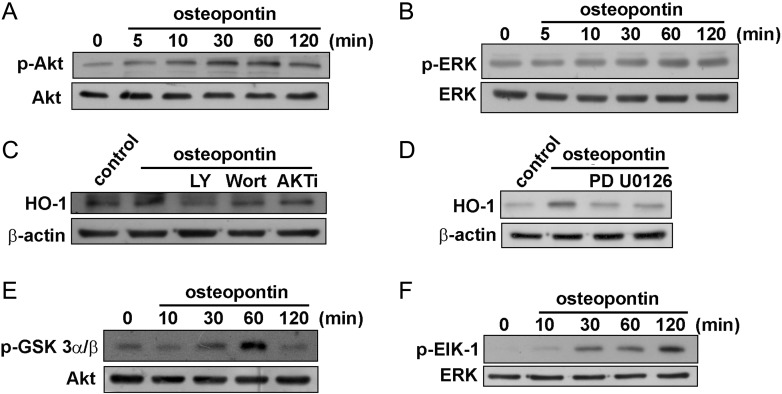
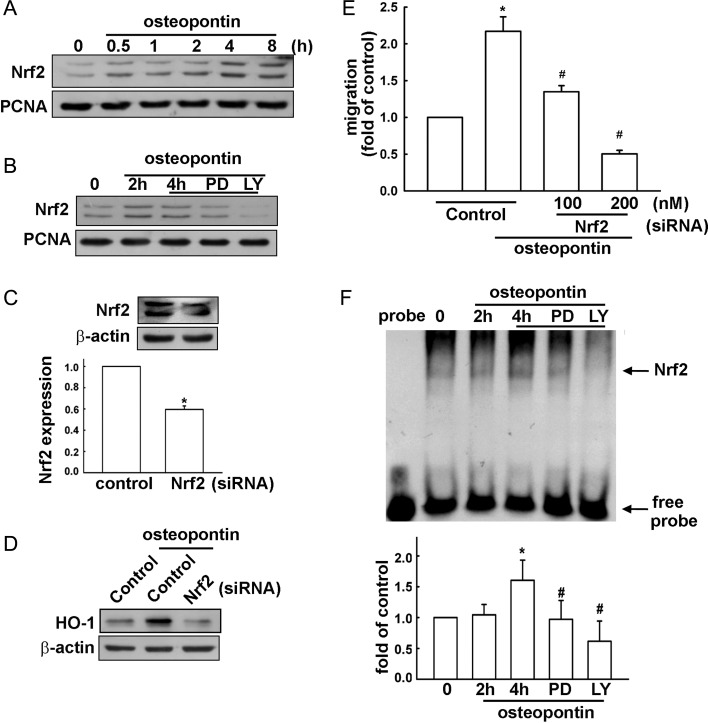
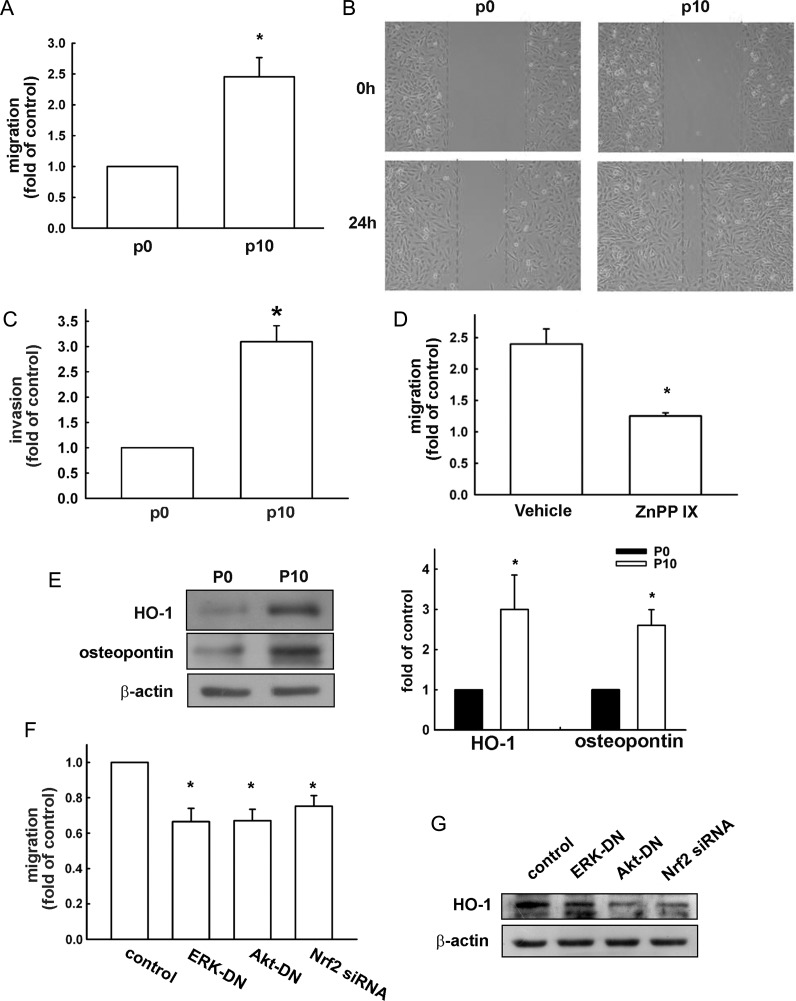
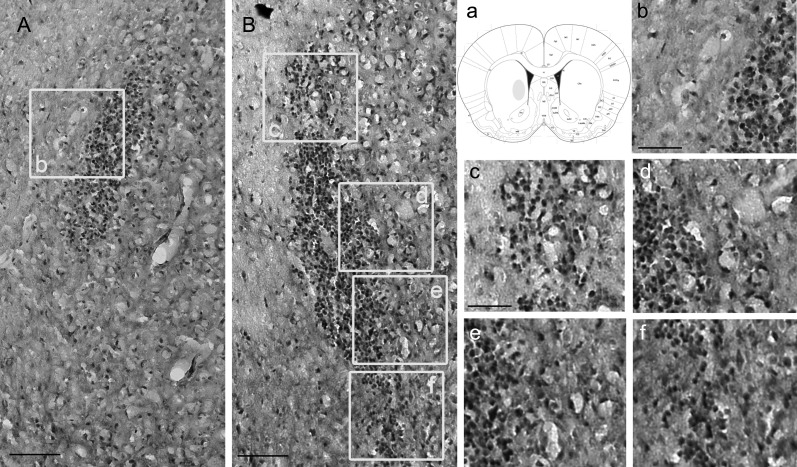
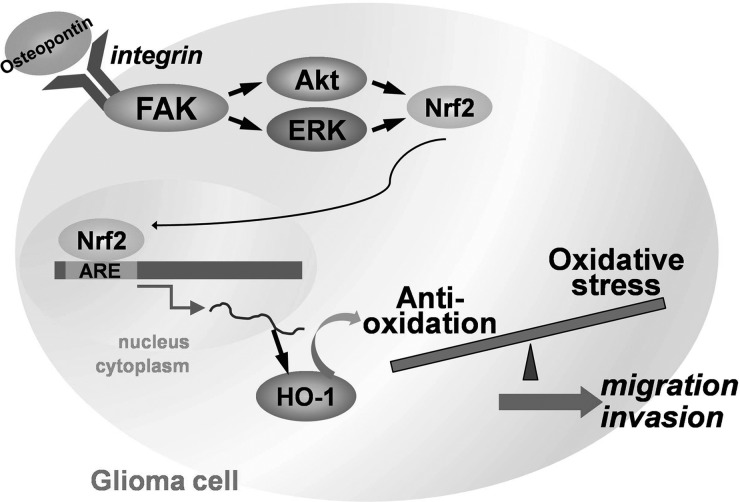
Malignant gliomas are associated with high morbidity and mortality because they are highly invasive into surrounding brain tissue, making complete surgical resection impossible. Osteopontin is abundantly expressed in the brain and is involved in cell adhesion, migration, and invasion. The aim of the present study was to investigate the mechanisms of glioma cell migration. Migration and invasion activity were determined by transwell and wound-healing assays. Gene and protein expressions were analyzed by reverse transcription-PCR, real time-PCR, and Western blotting. Nrf2-DNA binding activity was determined by electrophoretic mobility shift assay. Establishment of migration-prone sublines were performed to select highly migratory glioma. An intracranial xenograft mouse model was used for the in vivo study. Application of recombinant human osteopontin enhanced the migration of glioma cells. Expression of heme oxygenase (HO)-1 mRNA and protein also increased in response to osteopontin stimulation. Osteopontin-induced increase in cell migration was antagonized by HO-1 inhibitor or HO-1 small interfering (si)RNA. Osteopontin-mediated HO-1 expression was reduced by treatment with MEK/ERK and phosphatidylinositol 3-kinase/Akt inhibitors, as well as siRNA against Nrf2. Furthermore, osteopontin stimulated Nrf2 accumulation in the nucleus and increased Nrf2-DNA binding activity. In migration-prone sublines, cells with greater migration ability had higher osteopontin and HO-1 expression, and zinc protoporphyrin IX treatment could effectively reduce the enhanced migration ability. In an intracranial xenograft mouse model, transplantation of migration-prone subline cells exhibited higher cell migration than parental tumor cells. These results indicate that osteopontin activates Nrf2 signaling, resulting in enhanced HO-1 expression and cell migration in glioma cells.


Figures

Fig. 1.
Fig. 1.
Osteopontin induces the migration activity of glioma cells. By using a cell culture insert system, in vitro migration activities were examined. (A) After incubating cells with various concentrations of osteopontin for 24 h, we found that osteopontin induced migration activity in U251 and C6 cells. Results are expressed as means ± SEM of 3 independent experiments. (B) Cells were treated with various concentrations of osteopontin for 24 h. The migrated cells were visualized by phase-contrast imaging. (C) Cells were seeded on the migration insert for 24 h and treated with or without osteopontin (10 ng/mL) for another 24 h. The migrated cells were determined by wound-healing assay and visualized by phase-contrast imaging. (D) Treatment with osteopontin (10 ng/mL) enhanced invasion of U251 cells. Results are expressed as means ± SEM of 3 independent experiments. *P < .05 compared with control group.
Fig. 2.
Fig. 2.
Osteopontin increases HO-1 upregulation in U251 glioma cells. Cells were stimulated with osteopontin with various concentrations (1, 3, or 10 ng/mL for 24 h; A) or with a concentration of 10 ng/mL for indicated time periods (4, 8, and 24 h; B). After cell lysate extracts were collected, HO-1 protein levels were determined by using Western blot analysis. (C) Cells were treated with osteopontin (10 ng/mL), and HO-1 mRNA expression was analyzed by RT-PCR. (D) mRNA expression was quantitated by real time–PCR. Results are expressed as means ± SEM of 3 independent experiments. *P < .05 compared with control group.
Fig. 3.
Fig. 3.
Osteopontin-directed glioma cell migration involves HO-1 expression. (A and B) Cells were treated with ZnppIX (0.1 or 0.3 μM) for 30 min, followed by stimulation with osteopontin (10 ng/mL). (C) Cells were stimulated with CoPPIX for 24 h. (D, lower panel) Cells were pretransfected with control or HO-1 siRNA for 24 h, followed by stimulation with osteopontin (10 ng/mL) for another 24 h. In vitro migration activities were examined after osteopontin treatment for 24 h. Results are expressed as means ± SEM of 3 independent experiments. *P < .05 compared with the control group; #P < .05 compared with the osteopontin treatment group. Cells were pretransfected with control or HO-1 siRNA for 24 h, and protein expression was determined by Western blot (D, upper panel).
Fig. 4.
Fig. 4.
Involvement of PI3K/Akt in osteopontin-induced HO-1 expression in U251 glioma cells. Cells were incubated with osteopontin for indicated time periods. The phosphorylation of Akt (A) and ERK (B) were determined by Western blot analysis. (C and D) Cells were pre-incubated with LY294002, wortmannin, Akt inhibitor (AKT i), or PD98059 or U0126 for 30 min followed by stimulation with osteopontin for 24 h, and HO-1 protein expression was analyzed by Western blot. (E and F) Cells were incubated with osteopontin for indicated time periods, and cell lysates were then immunoprecipitated with GSK3- or Elk-1–fusion protein agarose beads. One set of immunoprecipitates was subjected to 10% SDS-PAGE and analyzed by immunoblotting with the anti-phospho-GSK3α/β antibody or anti-phospho-Elk-1 antibody. Equal amounts of the immunoprecipitated kinase complex presented in each kinase assay were confirmed by immunoblotting of Akt or ERK. Results are expressed as 4 independent experiments.
Fig. 5.
Fig. 5.
Osteopontin-induced HO-1 upregulation involves Nrf2 activation in U251 glioma cells. (A) Cells were treated with osteopontin for the indicated time periods, and the level of nuclear Nrf2 expression was determined by immunoblotting with Nrf2-specific antibody. (B) Cells were treated with ERK or Akt inhibitors for 30 min followed by stimulation with osteopontin for 4 h, and the level of nuclear Nrf2 expression was determined by immunoblotting with Nrf2 specific antibody. Cells were transfected with control or Nrf2 siRNA for 24 h, and Nrf2 (C) and HO-1 protein expressions (D) were determined by Western blot; osteropontin-induced cell migration was measured in the transwell assay (E). Results are expressed as means ± SEM of 3 independent experiments. *P < .05 compared with the control group; #P < .05 compared with the osteopontin treatment group. (F) Nuclear extracts were collected from cells treated with osteopontin for the indicated time periods (2 h or 4 h), and the binding of Nrf2 to the Nrf2-DNA binding element was examined by EMSA analysis. Lane 1 was loaded without nuclear extracts (probe). Cells were pretreated with PD98059 or LY294002, were treated with osteopontin for 4 h, and were then analyzed by EMSA. The quantitative data are shown in the lower panel. *P < .05 compared with the control group; #P < .05 compared with the osteopontin treatment for 4 h. Note that osteopontin increases the binding of Nrf2 to the Nrf2-DNA binding element, and treatment with PD98059 and LY294002 reduced osteopontin-increased DNA binding activity of Nrf2. Results are expressed as means ± SEM of 3 independent experiments. *P < .05 compared with the control group; #P < .05 compared with the osteopontin treatment for the 4 h group.
Fig. 6.
Fig. 6.
Upregulation of osteopontin and HO-1 expression in migration-prone cells. (A) After 10 rounds of selection of U251 cells by a cell culture insert system, the migration-prone subline (P10) exhibited higher migration ability than the original U251 cells. Results are expressed as means ± SEM of 3 independent experiments. *P < .05 compared with the original group (P0). (B) The original U251 cells (P0) and the migration-prone subline (P10) were seeded for 24 h, and cell migration was determined by wound-healing assay and visualized by phase-contrast imaging. (C) The migration-prone subline (P10) exhibited higher invasion ability than the original U251 cells. Results are expressed as means ± SEM of 3 independent experiments. *P < .05 compared with the control group. (D) Treatment with ZnPPIX (0.3 μM) for 24 h reduced the migration ability of the migration-prone subline (P10) compared with the vehicle treatment. Results are expressed as means ± SEM of 3 independent experiments. *P < .05 compared with the control group (vehicle treatment). (E) The cell lysates of P10 and the original U251 glioma cells (P0) were collected after 24 h of culturing, and osteopontin and HO-1 protein levels were determined using Western blot analysis. Note that P10 expressed higher osteopontin and HO-1 protein levels. The quantitative results are shown in the right panel. Results are expressed as means ± SEM of 3 independent experiments. *P < .05 compared with the P0 group. P10 cells were pretransfected with ERK-DN, Akt-DN, or Nrf-2 siRNA for 24 h, cell migration activity was determined by a cell culture insert system (F), and HO-1 expression was examined by Western blot (G).
Fig. 7.
Fig. 7.
High migration activity of human glioma cells correlated with cell invasiveness in vivo. After 10 rounds of selection of U251 cells by a cell culture insert system, the migration-prone subline (P10; B) and the original group (P0; A) were implanted into nude mice intracranially at the site indicated as a; mice were killed 28 days after implantation, and representative sections were stained with hematoxylin. Scale bar = 200 μm in A, B. Higher magnification of the migration-prone subline P0 are shown in b. Higher magnification of the migration-prone subline P10 is shown in c, d, e, and f (n = 3 mice in each group). Scale bar = 100 μm in bf.
Fig. 8.
Fig. 8.
Schematic diagram of the signaling pathways involved in osteopontin-induced inflammatory mediator expression in human glioma cells. Treatment of cells with osteopontin might bind with osteopontin receptor to activate ERK and Akt signaling pathways, which leads to HO-1 expression and increases the cell migration of human glioma.

References

    1. Louis DN, Ohgaki H, Wiestler OD, et al. The 2007 WHO classification of tumours of the central nervous system. Acta Neuropathol. 2007;114(2):97–109. - PMC - PubMed
    1. Molina JR, Hayashi Y, Stephens C, Georgescu MM. Invasive glioblastoma cells acquire stemness and increased Akt activation. Neoplasia. 2010;12(6):453–463. - PMC - PubMed
    1. Huang Z, Cheng L, Guryanova OA, Wu Q, Bao S. Cancer stem cells in glioblastoma—molecular signaling and therapeutic targeting. Protein Cell. 2010;1(7):638–655. - PMC - PubMed
    1. Taylor LP. Diagnosis, treatment, and prognosis of glioma: five new things. Neurology. 2010;75(18 Suppl 1):S28–32. - PubMed
    1. Stupp R, Mason WP, van den Bent MJ, et al. Radiotherapy plus concomitant and adjuvant temozolomide for glioblastoma. N Engl J Med. 2005;352(10):987–996. - PubMed

Publication types