. 2012 Dec 7;287(50):41875-87.
doi: 10.1074/jbc.M112.421552. Epub 2012 Oct 16.

Phosphoenolpyruvate carboxykinase and glucose-6-phosphatase are required for steroidogenesis in testicular Leydig cells

Affiliations

Phosphoenolpyruvate carboxykinase and glucose-6-phosphatase are required for steroidogenesis in testicular Leydig cells

Seung Won Ahn et al. J Biol Chem. .

Abstract

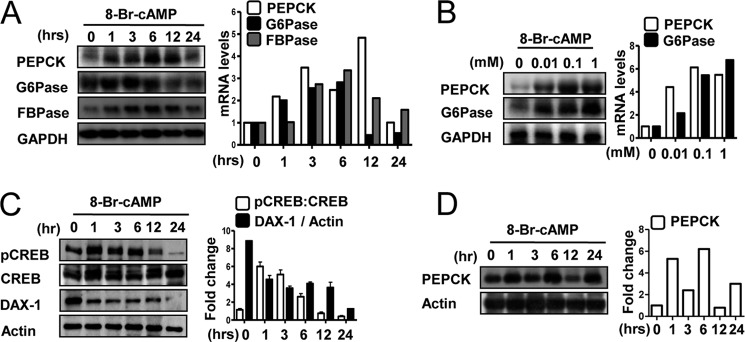
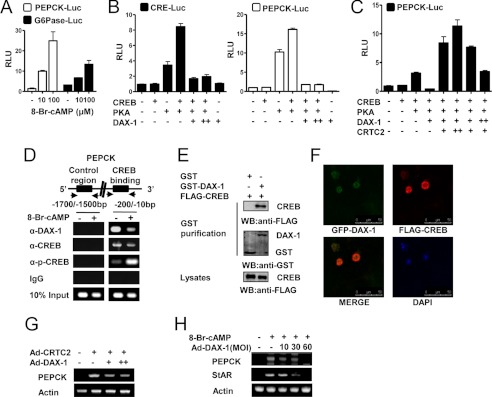
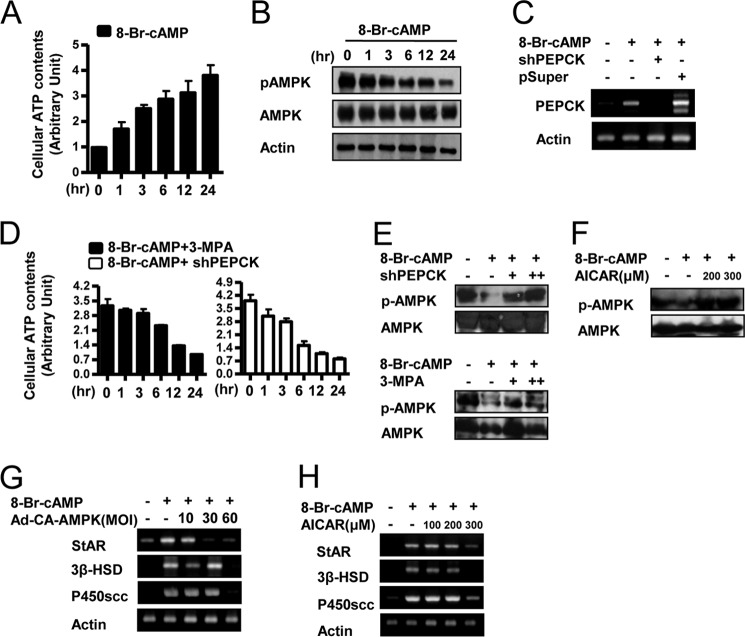
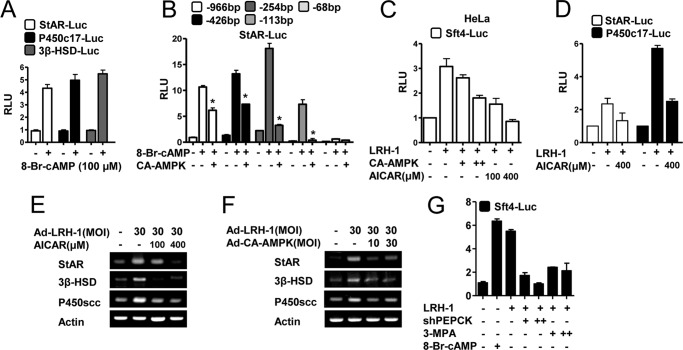
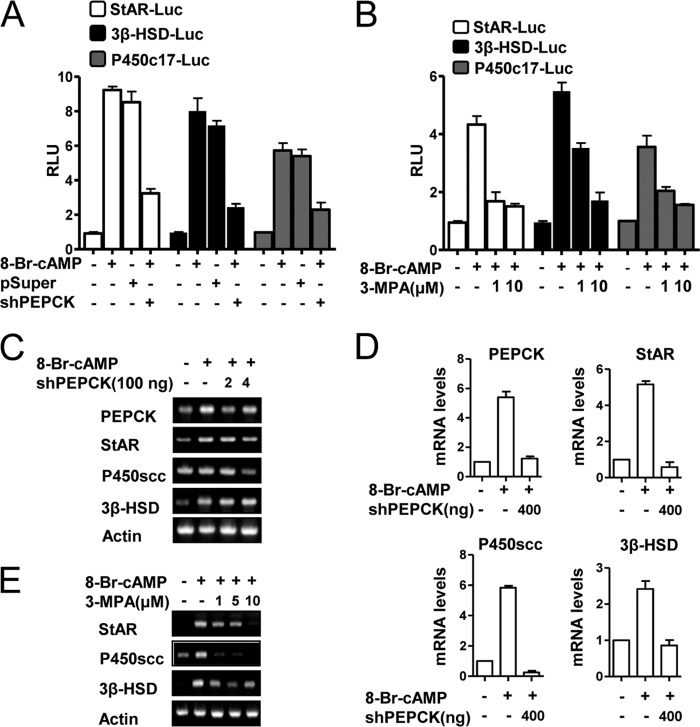
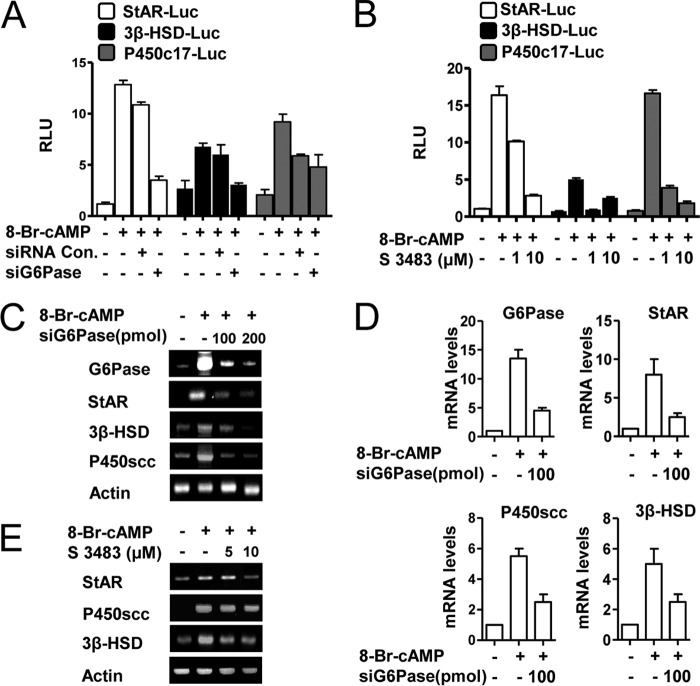
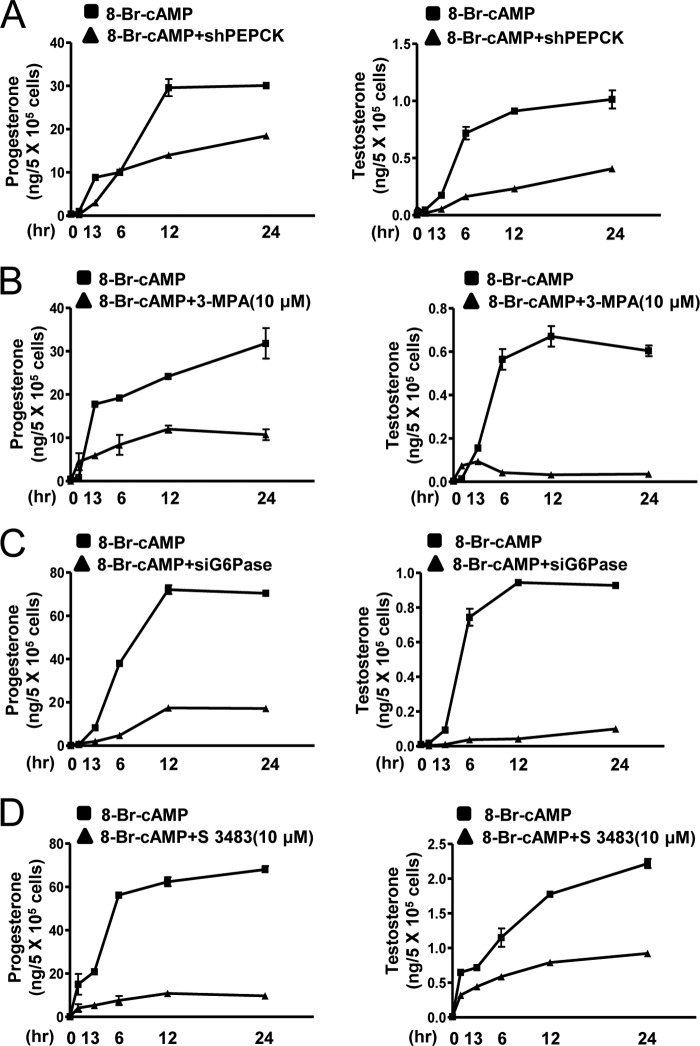
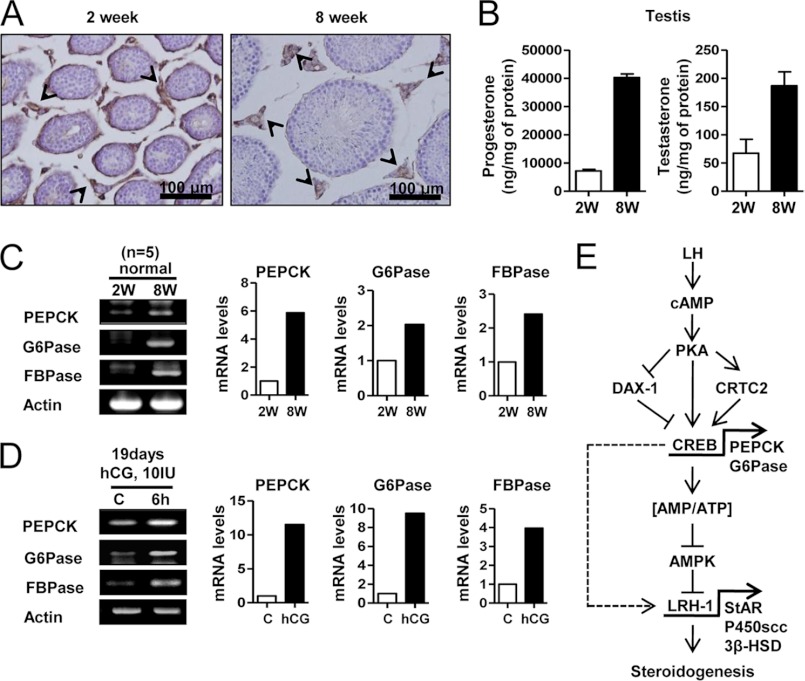
Cyclic AMP (cAMP) induces steroidogenic enzyme gene expression and stimulates testosterone production in Leydig cells. Phosphoenolpyruvate carboxykinase (PEPCK) is expressed in Leydig cells, but its role has not been defined. In this study, we found that PEPCK and glucose-6-phosphatase (Glc-6-Pase) are increased significantly following cAMP treatment of mouse Leydig cells. Moreover, cAMP treatment increased recruitment of the cAMP-response element-binding transcription factor and decreased recruitment of the corepressor DAX-1 on the pepck promoter. Furthermore, cAMP induced an increase in ATP that correlated with a decrease in phospho-AMP-activated protein kinase (AMPK). In contrast, knockdown or inhibition of PEPCK decreased ATP and increased phospho-AMPK. Treatment with an AMPK activator or overexpression of the constitutively active form of AMPK inhibited cAMP-induced steroidogenic enzyme promoter activities and gene expression. Liver receptor homolog-1 (LRH-1) was involved in cAMP-induced steroidogenic enzyme gene expression but was inhibited by AMPK activation in Leydig cells. Additionally, inhibition or knockdown of PEPCK and Glc-6-Pase decreased cAMP-mediated induction of steroidogenic enzyme gene expression and steroidogenesis. Finally, pubertal mouse (8-week-old) testes and human chorionic gonadotropin-induced prepubertal mouse testes showed increased PEPCK and Glc-6-Pase gene expression. Taken together, these results suggest that induction of PEPCK and Glc-6-Pase by cAMP plays an important role in Leydig cell steroidogenesis.


Figures

FIGURE 1.
FIGURE 1.
cAMP induces PEPCK, Glc-6-Pase, and FBPase gene expression in Leydig cells. A, MA-10 cells were cultured in 0.5% charcoal-stripped horse serum and glucose-free medium supplemented with 20 mm sodium lactate, 1 mm sodium pyruvate, and 15 mm HEPES and treated with 8-Br-cAMP (100 μm) for the indicated time period. Total RNA was isolated for Northern hybridization, and PEPCK, Glc-6-Pase, and FBPase gene expression was analyzed and normalized to GAPDH gene expression. Results are representative of three independently performed experiments. B, MA-10 cells were treated with 8-Br-cAMP for 6 h in a dose-dependent manner. Total RNA was isolated for Northern hybridization, and PEPCK and Glc-6-Pase gene expressions were analyzed and normalized to GAPDH gene expression. Results are representative of three independently performed experiments. C, MA-10 cells were treated with 8-Br-cAMP (100 μm) for the indicated time period and harvested for Western blot analysis using the indicated antibodies (pCREB, CREB, DAX-1, and actin). Results are representative of three independently performed experiments. D, MA-10 cells were treated with 8-Br-cAMP (100 μm) for the indicated time period and harvested for Western blot analysis using the indicated antibodies (PEPCK and actin). Results are representative of three independently performed experiments.
FIGURE 2.
FIGURE 2.
DAX-1 represses cAMP-induced PEPCK gene expression in Leydig cells. A, MA-10 cells were transfected with PEPCK-Luc (200 ng) and Glc-6-Pase-Luc (200 ng), respectively. Twenty four hours after the transfection, MA-10 cells were cultured in 0.5% charcoal-stripped horse serum and glucose-free medium supplemented with 20 mmol/liter sodium lactate, 1 mmol/liter sodium pyruvate, and 15 mmol/liter HEPES, followed by cAMP treatment at the indicated concentrations for 12 h. Experiments were performed in triplicate, and data are expressed in relative luciferase units (RLU) and as the fold activation relative to the control, representing mean ± S.D. of three individual experiments. B, cells were transfected with CRE-Luc (200 ng), PEPCK-Luc (200 ng), CREB (200 ng), PKA (200 ng), and DAX-1 (200 ng) as indicated. Experiments were performed in triplicate, and data are expressed in relative luciferase units (RLU) and as the fold activation relative to the control. Data represent mean ± S.D. of three individual experiments. C, MA-10 cells were transfected with PEPCK-Luc (200 ng), CREB (200 ng), PKA (200 ng), DAX-1 (200 ng), and CRTC2 (200 ng) as indicated. Experiments were performed in triplicate, and data are expressed in RLU and as the fold activation relative to the control. Data represent mean ± S.D. of three individual experiments. D, MA-10 cells were serum-starved for 12 h followed by cAMP (100 μm) for 12 h. Soluble chromatin was prepared and immunoprecipitated with antibodies against DAX-1, CREB, p-CREB, or IgG only as indicated. Soluble chromatin (10%) was used as input. PCR was performed to determine and quantify CREB binding to the endogenous PEPCK promoter. E, 293T cells were cotransfected with FLAG-CREB expression vectors together with GST DAX-1 (pEBG-DAX-1) or GST alone (pEBG) as a control. The complex formation (top panels, GST purification) and FLAG-CREB (5 μg) used for the in vivo binding assay (bottom panel, lysate) were determined by anti-FLAG antibody immunoblot (WB). The same blot was stripped and reprobed with an anti-GST antibody (middle panel) to confirm the expression levels of the GST fusion protein (GST-DAX-1) and the GST control (GST). F, HeLa cells were transiently transfected with pEGFP-DAX-1 and pCDNA3/FLAG-CREB. The yellow stain in the merged image depicts colocalization of DAX-1 and CREB (×400). Data shown are representative cells from one of three independent experiments. DAPI, 4′,6-diamidino-2-phenylindole dihydrochloride. G, MA-10 cells were infected with the CRTC2 (30 m.o.i.) and DAX-1 (10, 30 m.o.i.) adenoviruses. Total RNA was isolated for semiquantitative RT-PCR analysis. Data represent mean ± S.D. of three individual experiments. H, MA-10 cells were infected with DAX-1 adenovirus at an m.o.i. (MOI) of 10, 30, or 60 for 24 h followed by cAMP (100 μm) treatment for 12 h. Total RNA was isolated for semiquantitative RT-PCR analysis. Data represent mean ± S.D. of three individual experiments.
FIGURE 3.
FIGURE 3.
AMPK regulates cAMP-induced steroidogenic gene expression. A, MA-10 cells were treated with cAMP (100 μm) for the indicated time period; cell lysates were extracted, and a cellular ATP assay was performed. Results are representative of three independently performed experiments. B, MA-10 cells were treated with cAMP (100 μm) for the indicated time period; cell lysates were extracted, and Western blot analyses were performed using the indicated antibodies. Results are representative of three independently performed experiments. C, MA-10 cells were transfected with shPEPCK (200 ng) or pSuper vector (200 ng) prior to 8-Br-cAMP (100 μm) treatment. Total RNA was isolated for semiquantitative RT-PCR analysis. Data represent mean ± S.D. of three individual experiments. D, MA-10 cells were incubated with cAMP (100 μm) and then added 3-MPA (10 μm) or shPEPCK (200 ng); cell lysates were extracted, and a cellular ATP assay was performed. Results are representative of three independently performed experiments. E, MA-10 cells were transfected with shPEPCK (200 ng) or pretreated with 3-MPA (10 μm) prior to 8-Br-cAMP (100 μm) treatment. Cells lysates were extracted, and Western blot analyses were performed using p-AMPK and AMPK antibodies. Results are representative of three independently performed experiments. F, MA-10 cells were pretreated with AICAR (200 or 300 μm) prior to cAMP (100 μm) treatment. Cells lysates were extracted, and Western blot analyses were performed using p-AMPK and AMPK. Results are representative of three independently performed experiments. G, MA-10 cells were infected with the CA-AMPK adenovirus at an m.o.i. (MOI) of 10, 30, or 60 for 24 h followed by cAMP (100 μm) treatment for 12 h. Total RNA was isolated for semiquantitative RT-PCR analysis. Data represent mean ± S.D. of three individual experiments. H, MA-10 cells were treated with AICAR (100, 200, or 300 μm) for 12 h followed by a preceding 12 h cAMP (100 μm) treatment. Total RNA was isolated for semiquantitative RT-PCR analysis. Data represent mean ± S.D. of three individual experiments.
FIGURE 4.
FIGURE 4.
AMPK negatively regulates LRH-1-mediated steroidogenic gene promoter activities and gene expression. A, MA-10 cells were transfected with StAR-Luc (200 ng), P450c17-Luc (200 ng), and 3β-HSD-Luc (200 ng), respectively. Twenty four hours after the transfection, MA-10 cells were cultured in 0.5% charcoal-stripped horse serum and glucose-free medium supplemented with 20 mmol/liter sodium lactate, 1 mmol/liter sodium pyruvate, and 15 mmol/liter HEPES, followed by cAMP treatment at the indicated concentrations for 12 h. Experiments were performed in triplicate, and data are expressed in relative luciferase units (RLU) and as the fold activation relative to the control, representing mean ± S.D. of three individual experiments. B, MA-10 cells were transfected with several deletion constructs of StAR-Luc (200 ng) with or without CA-AMPK and treated with 8-Br-cAMP as indicated for 24 h. Experiments were performed in triplicate, and data are expressed in relative luciferase units (RLU) and as the fold activation relative to the control, representing mean ± S.D. of three individual experiments. *, p < 0.001 compared with untreated control and cAMP treated cells. C, HeLa cells were transfected with Sft4-Luc (200 ng), LRH-1 (200 ng), and CA-AMPK (100 or 200 ng) and were then treated with AICAR (100 or 400 μm). Experiments were performed in triplicate, and data are expressed in RLU and as the fold activation relative to the control. Data represent mean ± S.D. of three individual experiments. D, MA-10 cells were transfected with StAR-Luc (200 ng), P450c17-Luc (200 ng), and LRH-1 (200 ng) as indicated, with or without AICAR (400 μm). Experiments were performed in triplicate, and data are expressed in RLU and as the fold activation relative to the control. Data represent mean ± S.D. of three individual experiments. E and F, MA-10 cells were infected with the LRH-1 adenovirus (30 m.o.i.) for 24 h followed by AICAR (100 and 400 μm) treatment for 12 h or adenovirus CA-AMPK overexpression (10 or 30 m.o.i.). Total RNA was isolated for semiquantitative RT-PCR analysis. Data represent mean ± S.D. of three individual experiments. G, MA-10 cells were transfected with Sft4-Luc (200 ng), LRH-1 (200 ng), and shPEPCK (200 ng) and treated with 3-MPA (10 or 20 μm) or 8-Br-cAMP (100 μm). Experiments were performed in triplicate, and data are expressed in RLU and as the fold activation relative to the control. Data represent mean ± S.D. of three individual experiments.
FIGURE 5.
FIGURE 5.
PEPCK plays a role in cAMP-induced steroidogenic gene expression. A, MA-10 cells were transfected with StAR-Luc (200 ng), 3β-HSD-Luc (200 ng), P450c17-Luc (200 ng), shPEPCK (200 ng), and pSuper vector (200 ng) for 24 h after transfection; MA-10 cells were serum-starved followed by cAMP (100 μm) treatment. Experiments were performed in triplicate, and data are expressed in relative luciferase units (RLU) and as the fold activation relative to the control. Data represent mean ± S.D. of three individual experiments. B, MA-10 cells were transfected with StAR-Luc (200 ng), 3β-HSD-Luc (200 ng), and P450c17-Luc (200 ng) for 12 h after transfection. MA-10 cells were serum-starved and pretreated with 3-MPA (1 and 10 μm) for 2 h, followed by treatment with cAMP (100 μm). Experiments were performed in triplicate, and data are expressed in relative luciferase units and as the fold activation relative to the control. Data represent mean ± S.D. of three individual experiments. C, MA-10 cells were transfected with shPEPCK (200 or 400 ng) for 24 h after transfection, followed by treatment with cAMP (100 μm) for 12 h. Total RNA was isolated for semiquantitative RT-PCR analysis. Data represent mean ± S.D. of three individual experiments. D, RNA was isolated from C samples for real time PCR analysis. PEPCK, StAR, P450scc, and 3β-HSD were evaluated. Data represent mean ± S.D. of three individual experiments. E, MA-10 cells were pretreated with 3-MPA (1, 5, and 10 μm) for 2 h, followed by treatment with cAMP (100 μm) for 12 h. Total RNA was isolated for semiquantitative RT-PCR analysis. Data represent mean ± S.D. of three individual experiments.
FIGURE 6.
FIGURE 6.
Glc-6-Pase plays a role in cAMP-induced steroidogenic gene expression. A, MA-10 cells were transfected with StAR-Luc (200 ng), 3β-HSD-Luc (200 ng), P450c17-Luc (200 ng), siGlc-6-Pase (100 pmol), and siRNA (100 pmol) for 24 h after transfection. Cells were serum-starved followed by cAMP treatment (100 μm). Experiments were performed in triplicate, and data are expressed in relative luciferase units (RLU) and as the fold activation relative to the control. Data represent mean ± S.D. of three individual experiments. B, MA-10 cells were transfected with StAR-Luc (200 ng), 3β-HSD-Luc (200 ng), and P450c17-Luc (200 ng) for 12 h after transfection. MA-10 cells were serum-starved and pretreated with S 3483 (1 and 10 μm) for 2 h, followed by treatment with cAMP (100 μm). Experiments were performed in triplicate, and data are expressed in relative luciferase units and as the fold activation relative to the control. Data represent mean ± S.D. of three individual experiments. C, MA-10 cells were transfected with siGlc-6-Pase (100 or 200 pmol) for 24 h after transfection, followed by treatment with cAMP (100 μm) for 12 h. Total RNA was isolated for semiquantitative RT-PCR analysis. Data represent mean ± S.D. of three individual experiments. D, total RNA was isolated from C samples for real time PCR analysis. Glc-6-Pase, StAR, P450scc and 3β-HSD were evaluated. Data represent mean ± S.D. of three individual experiments. E, MA-10 cells were pretreated with S 3483 (5 or 10 μm) for 2 h, followed by treatment with cAMP (100 μm) for 12 h. Total RNA was isolated for semiquantitative RT-PCR analysis. Data represent mean ± S.D. of three individual experiments.
FIGURE 7.
FIGURE 7.
PEPCK and Glc-6-Pase play a significant role in cAMP-induced steroidogenesis. A and B, MA-10 cells were transfected with shPEPCK (200 ng) or treated with 3-MPA (10 μm) and cultured in the presence of cAMP (100 μm) for the indicated time period, and media were collected for progesterone (left panel) and testosterone (right panel) measurement by RIA. Each point represents the average concentration of progesterone and testosterone per cell from three independent experiments. Data are representative of two independently conducted experiments. C and D, MA-10 cells were transfected with siGlc-6-Pase (100 pmol) or treated with S 3483 (10 μm) and cultured in the presence of cAMP (100 μm) for the indicated time period, and media were collected for progesterone (left panel) and testosterone (right panel) measurement by RIA. Each point represents the average amount of progesterone and testosterone per cell in three independent experiments. Data are representative of two independently conducted experiments.
FIGURE 8.
FIGURE 8.
LH increases PEPCK, Glc-6-Pase, and FBPase in mouse testis. A, testes were collected from 2- and 8-week-old C57BL/6J mice for immunohistochemistry assay. The arrowheads show the PEPCK stain in testis. B, testis samples from A was used for RIA. Each point represents the average concentration of progesterone and testosterone from three independent experiments. Data are representative of two independently conducted experiments. C, total RNA was isolated for semiquantitative RT-PCR analysis and real time PCR from 2- and 8-week-old mouse testes. Data represent mean ± S.D. of three individual experiments. D, 19-day-old C57BL/6J mice were injected with hCG (10 IU) for 6 h, and the testes were isolated for semiquantitative RT-PCR analysis and real time PCR. Data represent mean ± S.D. of three individual experiments. E, LH/cAMP/PKA signaling pathway increased expression of PEPCK and Glc-6-Pase via CREB activation, leading to an increased cellular ATP level. Subsequently, AMPK activation decreased in Leydig cells, thereby increasing LRH-1 gene expression, which positively regulates StAR, P450scc, and 3β-HSD steroidogenic enzyme gene expression. Therefore, these effects increase steroidogenesis in mouse testicular Leydig cells.

Similar articles

Cited by

References

    1. Yánez A. J., Nualart F., Droppelmann C., Bertinat R., Brito M., Concha I. I., Slebe J. C. (2003) Broad expression of fructose-1,6-bisphosphatase and phosphoenolpyruvate carboxykinase provide evidence for gluconeogenesis in human tissues other than liver and kidney. J. Cell. Physiol. 197, 189–197 - PubMed
    1. Hanson R. W., Reshef L. (2003) Glyceroneogenesis revisited. Biochimie 85, 1199–1205 - PubMed
    1. Pilkis S. J., Granner D. K. (1992) Molecular physiology of the regulation of hepatic gluconeogenesis and glycolysis. Annu. Rev. Physiol. 54, 885–909 - PubMed
    1. Hanson R. W., Reshef L. (1997) Regulation of phosphoenolpyruvate carboxykinase (GTP) gene expression. Annu. Rev. Biochem. 66, 581–611 - PubMed
    1. Shaywitz A. J., Greenberg M. E. (1999) CREB. A stimulus-induced transcription factor activated by a diverse array of extracellular signals. Annu. Rev. Biochem. 68, 821–861 - PubMed

Publication types

MeSH terms