. 2012 Nov 30;287(49):40938-55.
doi: 10.1074/jbc.M112.392076. Epub 2012 Oct 16.

Vascular endothelial growth factor-dependent spinogenesis underlies antidepressant-like effects of enriched environment

Affiliations

Vascular endothelial growth factor-dependent spinogenesis underlies antidepressant-like effects of enriched environment

Yu-Fei Huang et al. J Biol Chem. .

Abstract

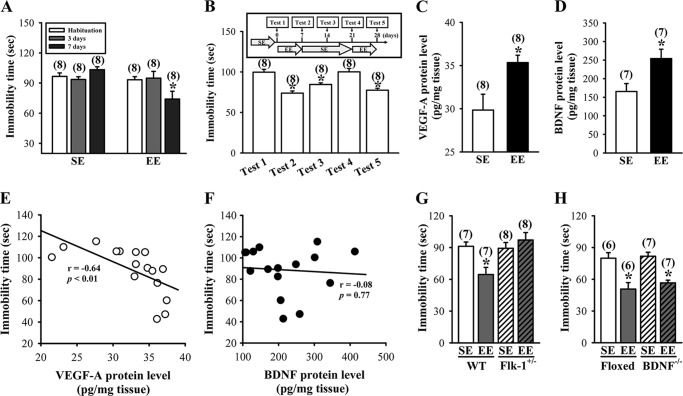
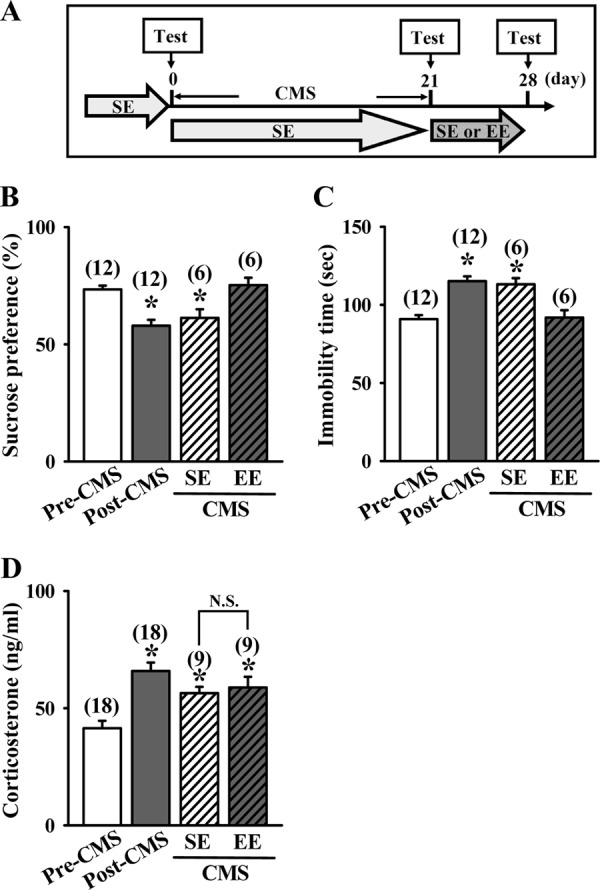
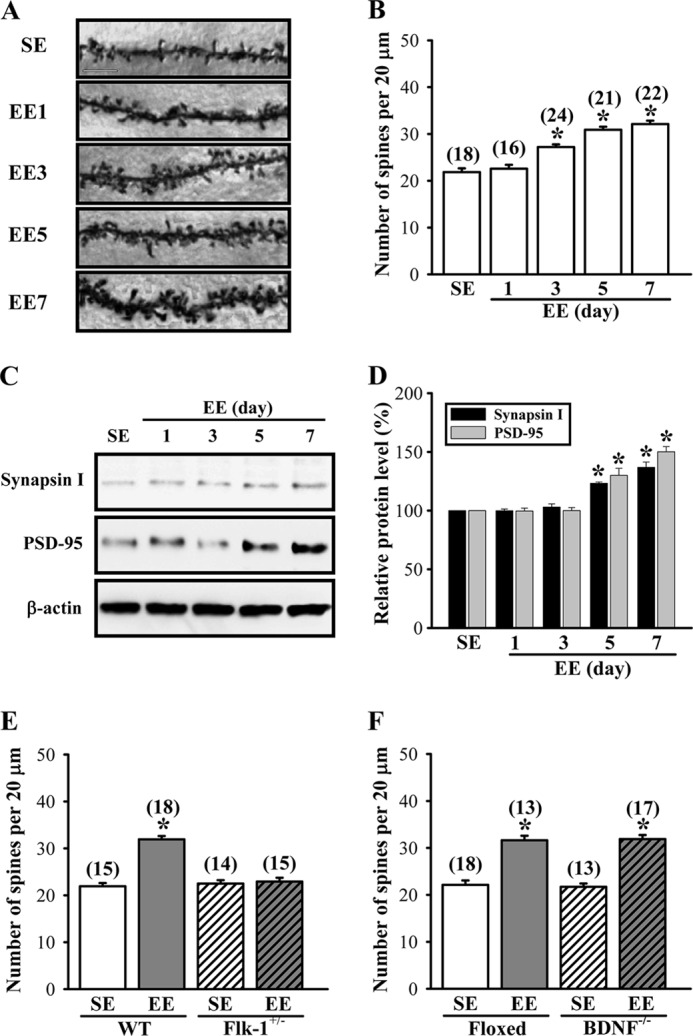
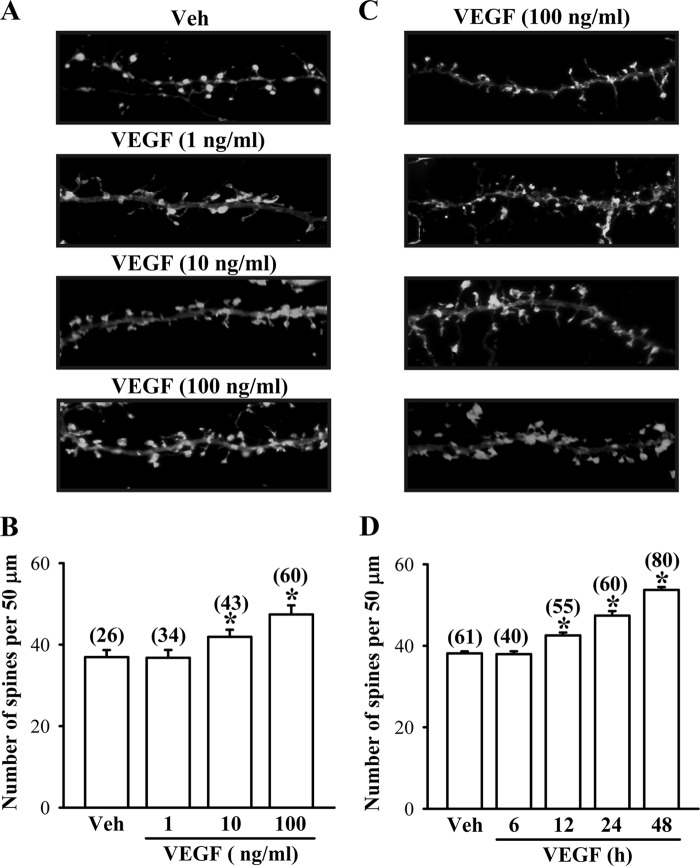
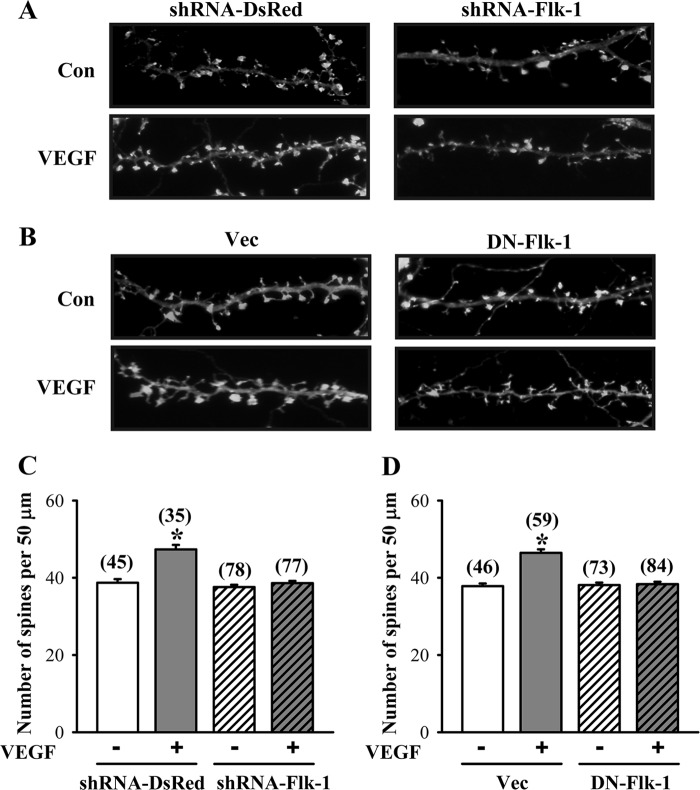
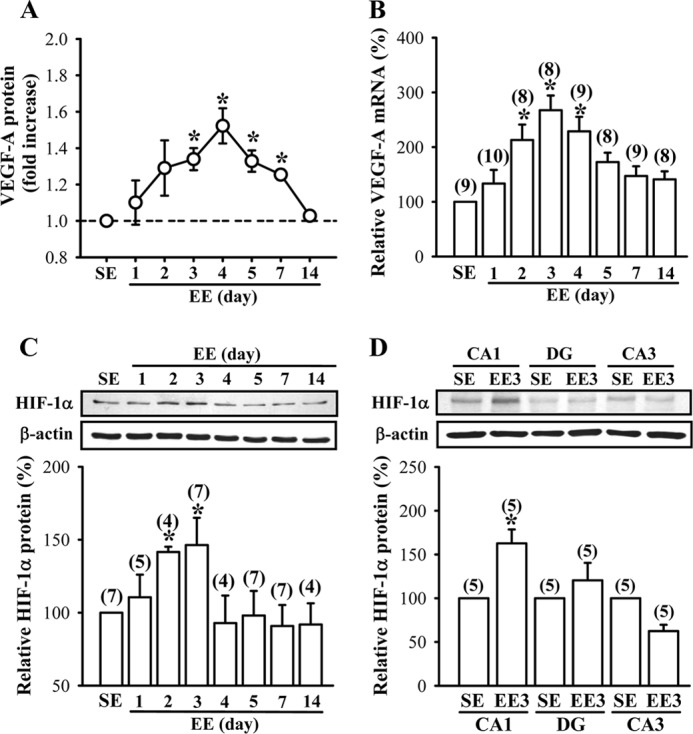
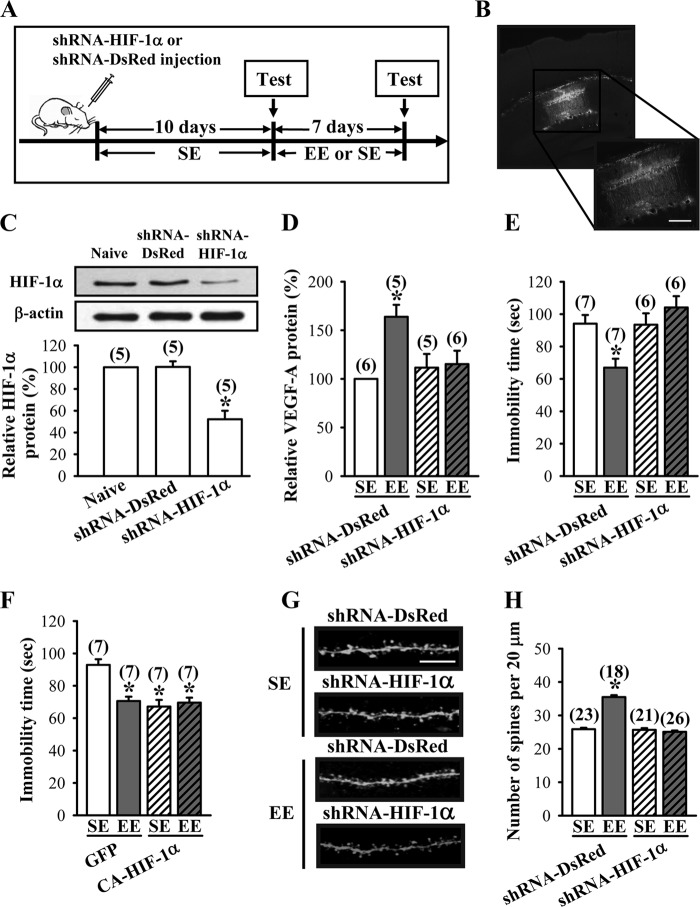
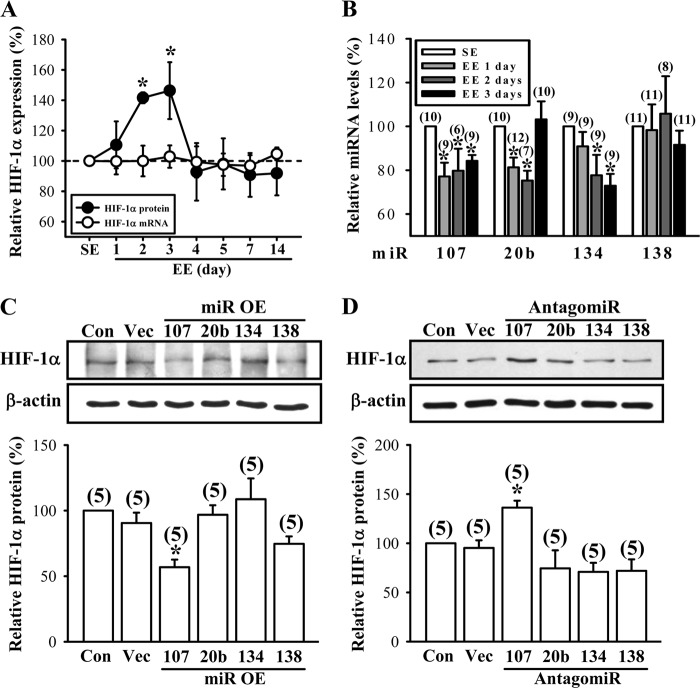
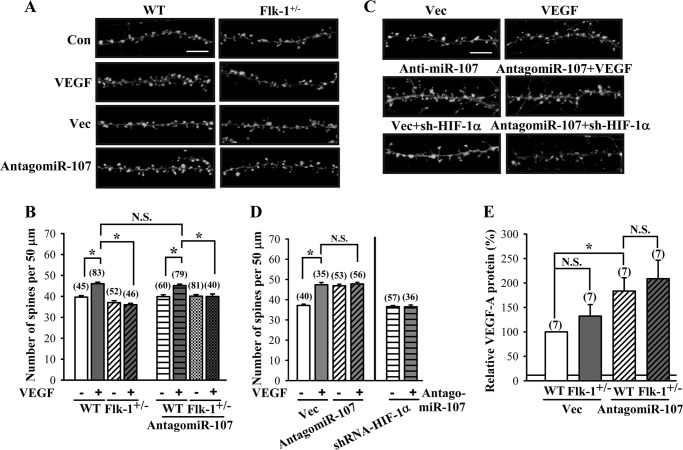
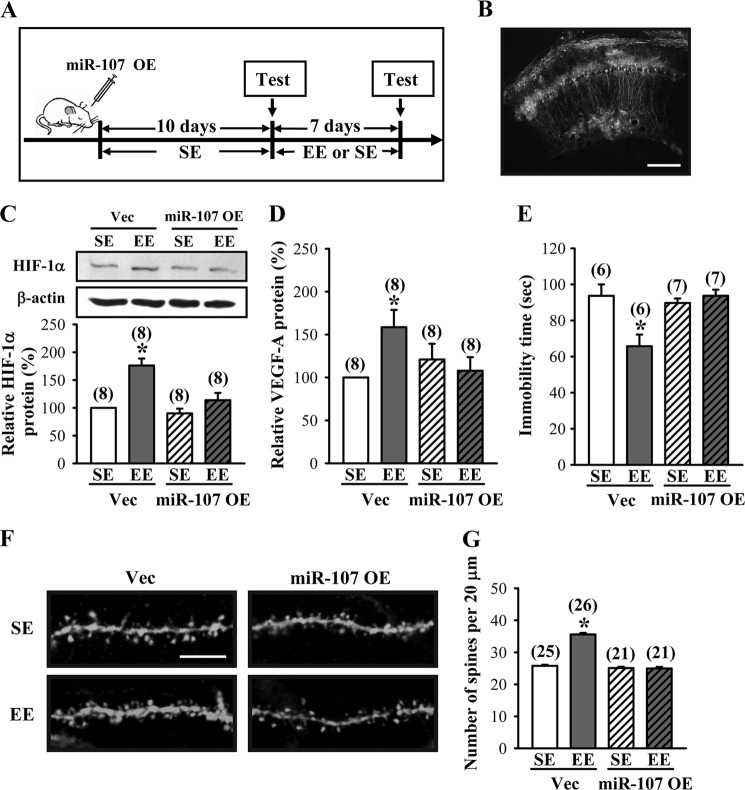
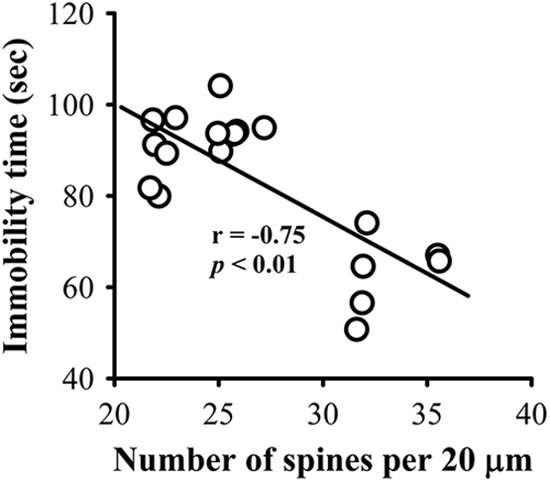
Current antidepressant treatments remain limited by poor efficacy and a slow onset of action. Increasing evidence demonstrates that enriched environment (EE) treatment can promote structural and behavioral plasticity in the brain and dampen stress-induced alterations of neuroplasticity. Here, we have examined whether short term exposure to EE is able to produce antidepressant-like effects. Our results show that housing adult mice in an EE cage for 7 days led to antidepressant-like behavioral profiles and a significant increase in the number of dendritic spines in hippocampal CA1 pyramidal neurons. These EE-induced antidepressant-like effects are primarily attributed to increased vascular endothelial growth factor (VEGF) expression through a hypoxia-inducible factor-1α (HIF-1α)-mediated transcriptional mechanism. Blockade of HIF-1α synthesis by lentiviral infection with HIF-1α small hairpin RNAs completely blocked the increase in expression of VEGF and the antidepressant-like effects induced by EE. Moreover, no significant antidepressant-like effects were observed with EE treatment in VEGF receptor 2 (Flk-1) knock-out mice. The increase in HIF-1α expression in the hippocampus induced by EE was associated with a decrease in endogenous levels of microRNA-107 (miR-107). Overexpression of miR-107 in the hippocampus completely blocked EE-induced HIF-1α expression and the antidepressant-like effects. These results support a model in which the down-regulation of miR-107, acting through HIF-1α, mediates VEGF-dependent spinogenesis to underlie the EE-induced antidepressant-like effects.


Figures

FIGURE 1.
FIGURE 1.
Short term exposure to EE produced antidepressant-like effects. A, depressive-like behaviors were measured by the TST. The immobility time during a 3-min TST was measured in mice after housing in an SE or EE for a period of 3 or 7 days. B, schematic representation of the experimental designs for examining the lasting antidepressant-like effects by EE. The antidepressant-like effects in the TST were still evident 7 days following EE treatment and were able to be restored upon re-exposure to EE. C, levels of VEGF-A proteins in the hippocampus of mice subjected to SE or EE for 7 days. D, levels of BDNF proteins in the hippocampus of mice subjected to SE or EE for 7 days. E, correlation analysis of VEGF-A levels in the hippocampus of mice and the immobility time in the TST. F, correlation analysis of BDNF levels in the hippocampus of mice and the immobility time in the TST. G, immobility time in the TST for wild type (WT) or heterozygous Flk-1 knock-out (Flk-1+/−) mice subjected to SE or EE for 7 days. H, immobility time in the TST for homozygous BDNF-floxed or BDNF conditional knock-out (BDNF−/−) mice subjected to SE or EE for 7 days. The total number of animals examined is indicated by n in parentheses. Data are presented as means ± S.E. *, p < 0.05 compared with SE group.
FIGURE 2.
FIGURE 2.
EE treatment leads to antidepressant-like effects in chronic mild stress model. A, schematic representation of the experimental designs for examining the EE-induced antidepressant-like effects in mice subjected to a 21-day CMS before SE or EE treatment. B, depressive-like behaviors were measured by the SPT. Preference ratios for sucrose solution over water were measured in CMS mice after housing in an SE or EE for a period of 7 days. C, depressive-like behaviors were measured by the TST. The immobility time during a 3-min TST was measured in CMS mice after housing in an SE or EE for a period of 7 days. D, plasma corticosterone levels were measured in CMS mice before and after housing in an SE or EE for a period of 7 days. The total number of animals examined is indicated by n in parentheses. Data are presented as means ± S.E. *, p < 0.05 compared with pre-exposed CMS (Pre-CMS) group.
FIGURE 3.
FIGURE 3.
EE increases the number of dendritic spines in hippocampal CA1 pyramidal neurons. A and B, representative images and summary graph showing the number of Golgi-impregnated hippocampal CA1 neuronal dendritic spines in mice subjected to SE or EE for 1–7 days. Scale, 10 μm. C and D, representative immunoblot and corresponding densitometric analysis showing the expression levels of synapsin I and PSD-95 in the synaptoneurosomal fractions prepared from hippocampal CA1 tissues of mice subjected to SE or EE for 1–7 days. E, summary graph showing the number of dendritic spines of hippocampal CA1 pyramidal neurons in WT or Flk-1+/− mice subjected to SE or EE for 7 days. F, summary graph showing the number of dendritic spines of hippocampal CA1 pyramidal neurons in BDNF-floxed or BDNF−/− mice subjected to SE or EE for 7 days. The total number of dendrites examined is indicated by n in parentheses. Data are presented as means ± S.E. *, p < 0.05 compared with SE group.
FIGURE 4.
FIGURE 4.
VEGF stimulates spinogenesis in primary cultures of mouse hippocampal neurons. A and B, representative images and summary graph showing the number of dendritic spines in hippocampal neuronal cultures in response to vehicle (Veh) or VEGF (1–100 ng/ml) treatment for 24 h. C and D, representative images and summary graph showing the number of dendritic spines in hippocampal neuronal cultures in response to VEGF (100 ng/ml) treatment for 6–48 h. The total number of dendrites examined is indicated by n in parentheses. Data are presented as means ± S.E. *, p < 0.05 compared with vehicle group.
FIGURE 5.
FIGURE 5.
VEGF stimulates spinogenesis through the activation of Flk-1 receptors. A and C, representative images and summary graph showing the number of dendritic spines in shRNA-DsRed- or shRNA-Flk-1-transfected hippocampal neuronal cultures in response to VEGF (100 ng/ml) treatment for 24 h. B and D, representative images and summary graph showing the number of dendritic spines in vector (Vec)- or DN-Flk-1-transfected hippocampal neuronal cultures in response to VEGF (100 ng/ml) treatment for 24 h. The total number of dendrites examined is indicated by n in parentheses. Data are presented as means ± S.E. *, p < 0.05 compared with vehicle group. Con, control.
FIGURE 6.
FIGURE 6.
EE stimulates VEGF production by an up-regulation of HIF-1α. A, time course of EE-induced VEGF-A secretion in the hippocampus. B, time course of EE-induced VEGF-A mRNA expression in the hippocampus. The samples in A and B were collected from the same mice. C, representative immunoblots and corresponding densitometric analysis showing HIF-1α protein expression in the hippocampus of mice subjected to SE or EE for 1–14 days. D, representative immunoblots and corresponding densitometric analysis showing HIF-1α protein expression in the CA1, CA3, and dentate gyrus (DG) areas of the hippocampus of mice subjected to SE or EE for 3 days. The total number of animals examined is indicated by n in parentheses. Data are presented as means ± S.E. *, p < 0.05 compared with SE group.
FIGURE 7.
FIGURE 7.
HIF-1α is essential for EE-induced antidepressant-like effects. A, schematic representation of the experimental designs for examining the EE-induced antidepressant-like effects in mice receiving bilateral intrahippocampal injections of shRNA-DsRed or shRNA-HIF-1α before SE or EE treatment. B, representative images showing the delivery of EGFP shRNA-HIF-1α in the CA1 region of the dorsal hippocampus. Scale, 200 μm. C, representative immunoblots and corresponding densitometric analysis showing HIF-1α protein expression in hippocampal CA1 region of mice with or without (naive) intrahippocampal injections of shRNA-DsRed or shRNA-HIF-1α and subsequently subjected to EE for 7 days. D, levels of VEGF-A proteins in the hippocampus of shRNA-DsRed- or shRNA-HIF-1α-treated mice subjected to SE or EE for 7 days. E, immobility time in the TST for shRNA-DsRed- or shRNA-HIF-1α-treated mice subjected to SE or EE for 7 days. F, immobility time in the TST for GFP- or CA-HIF-1α-treated mice subjected to SE or EE for 7 days. G and H, representative images and summary graph showing the number of dendritic spines of hippocampal CA1 pyramidal neurons in shRNA-DsRed- or shRNA-HIF-1α-treated mice subjected to SE or EE for 7 days. Scale, 5 μm. The total number of animals or neurons examined is indicated by n in parentheses. Data are presented as means ± S.E. *, p < 0.05 compared with SE group.
FIGURE 8.
FIGURE 8.
miR-107 negatively regulates EE-induced HIF-1α protein expression. A, time course of changes in the expression of HIF-1α mRNAs and proteins in the hippocampus of mice subjected to SE or EE for 1–14 days. B, expression levels of miR-107, miR-20b, miR-134, and miR-138 in the hippocampus of mice subjected to SE or EE for 1–3 days. C, representative immunoblots and corresponding densitometric analysis showing that HIF-1α protein expression in hippocampal neuronal cultures was specifically decreased by overexpression (OE) of miR-107. D, representative immunoblots and corresponding densitometric analysis showing that HIF-1α protein expression in hippocampal neuronal cultures was specifically increased after transfection with antagomiR-107. The total number of animals examined or experiments performed is indicated by n in parentheses. Data are presented as means ± S.E. *, p < 0.05 compared with SE or control (Con) group. Vec, vector.
FIGURE 9.
FIGURE 9.
Inhibition of miR-107 increases dendritic spine number through the activation of VEGF/Flk-1 signaling. A and B, representative images and summary graph showing the number of dendritic spines in hippocampal neuronal cultures from WT or Flk-1+/− mice subjected to VEGF (100 ng/ml) treatment for 24 h or transfection with antagomiR-107. Con, control; Vec, vector. C and D, representative images and summary graph showing the number of dendritic spines in antagomiR-107-transfected neuronal cultures subjected to VEGF treatment or shRNA-HIF-1α co-transfection. E, levels of VEGF-A protein secretion in hippocampal neuronal cultures from WT or Flk-1+/− mice in response to Vec or antagomiR-107 treatments. The total number of dendrites examined or experiments performed is indicated by n in parentheses. Data are presented as means ± S.E. *, p < 0.05. N.S., not significant.
FIGURE 10.
FIGURE 10.
Role of miR-107 in EE-induced antidepressant-like effects. A, schematic representation of the experimental designs for examining the EE-induced antidepressant-like effects in mice receiving bilateral hippocampal overexpression (OE) of miR-107 before SE or EE treatment. B, representative image showing the delivery of EGFP miR-107 in the CA1 region of the dorsal hippocampus. Scale bar, 200 μm. C, representative immunoblots and corresponding densitometric analysis showing HIF-1α protein expression in hippocampal CA1 region of mice with hippocampal overexpression of vector (Vec) or miR-107 and subsequently subjected to EE for 7 days. D, levels of VEGF-A proteins in the hippocampus of vector- or miR-107-overexpressing mice subjected to SE or EE for 7 days. E, immobility time in the TST for vector- or miR-107-overexpressing mice subjected to SE or EE for 7 days. F and G, representative images and summary graph showing the number of dendritic spines of hippocampal CA1 pyramidal neurons in vector- or miR-107-overexpressing mice subjected to SE or EE for 7 days. Scale bar, 5 μm. The total number of animals or neurons examined is indicated by n in parentheses. Data are presented as means ± S.E. *, p < 0.05 compared with SE group.
FIGURE 11.
FIGURE 11.
Correlation between the number of dendritic spines and antidepressant-like effects. Correlation analysis of the spine numbers of hippocampal CA1 pyramidal neurons and the immobility time in the TST (n = 19).

Similar articles

Cited by

References

    1. Wong M. L., Licinio J. (2001) Research and treatment approaches to depression. Nat. Rev. Neurosci. 2, 343–351 - PubMed
    1. Kessler R. C., Berglund P., Demler O., Jin R., Koretz D., Merikangas K. R., Rush A. J., Walters E. E., Wang P. S. (2003) The epidemiology of major depressive disorder. Results from the National Comorbidity Survey Replication (NCS-R). JAMA 289, 3095–3105 - PubMed
    1. Trivedi M. H., Greer T. L., Grannemann B. D., Church T. S., Galper D. I., Sunderajan P., Wisniewski S. R., Chambliss H. O., Jordan A. N., Finley C., Carmody T. I. (2006) TREAD. Treatment with exercise augmentation for depression. Study rationale and design. Clin. Trials 3, 291–305 - PubMed
    1. Li N., Lee B., Liu R. J., Banasr M., Dwyer J. M., Iwata M., Li X. Y., Aghajanian G., Duman R. S. (2010) mTOR-dependent synapse formation underlies the rapid antidepressant effects of NMDA antagonists. Science 329, 959–964 - PMC - PubMed
    1. Li N., Liu R. J., Dwyer J. M., Banasr M., Lee B., Son H., Li X. Y., Aghajanian G., Duman R. S. (2011) Glutamate N-methyl-d-aspartate receptor antagonists rapidly reverse behavioral and synaptic deficits caused by chronic stress exposure. Biol. Psychiatry 69, 754–761 - PMC - PubMed

Publication types

MeSH terms