

Separating Fluid Shear Stress from Acceleration during Vibrations in Vitro: Identification of Mechanical Signals Modulating the Cellular Response
- PMID: 23074384
- PMCID: PMC3466610
- DOI: 10.1007/s12195-012-0231-1
Separating Fluid Shear Stress from Acceleration during Vibrations in Vitro: Identification of Mechanical Signals Modulating the Cellular Response
Abstract
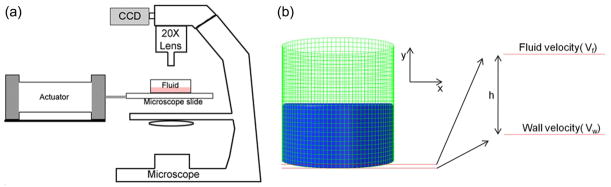
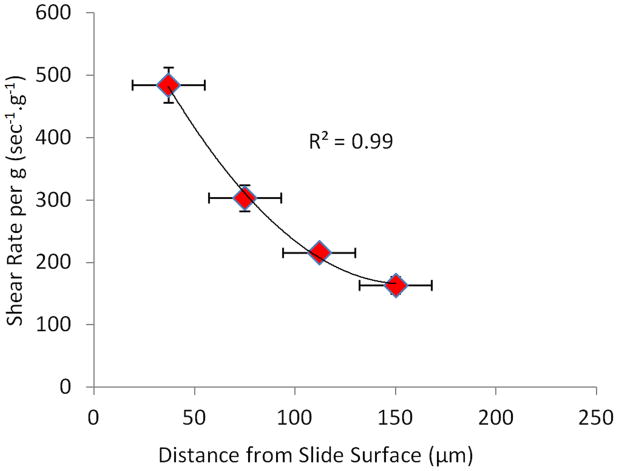
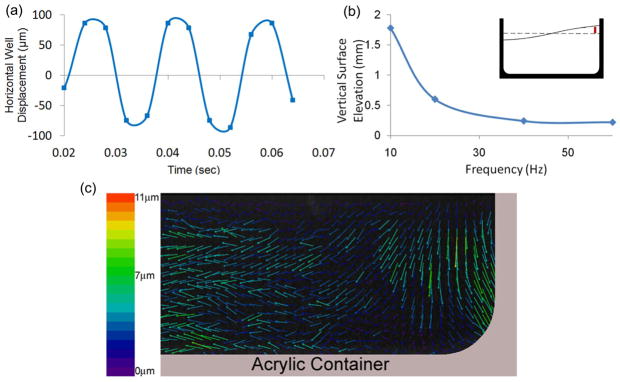
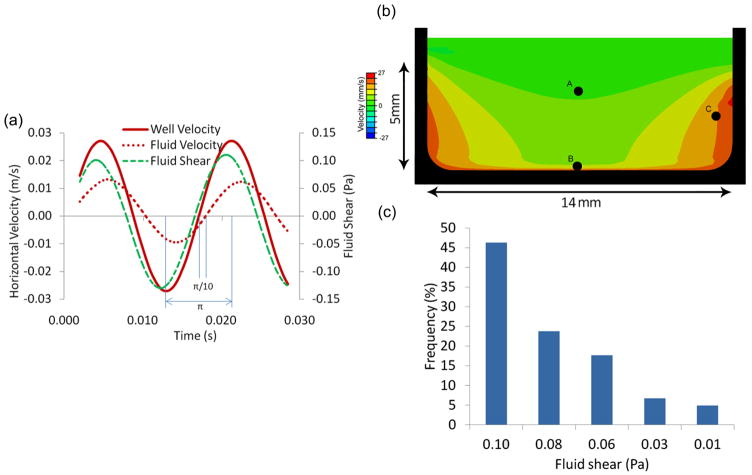
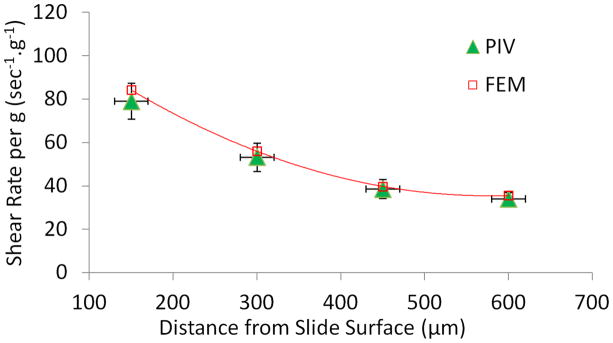
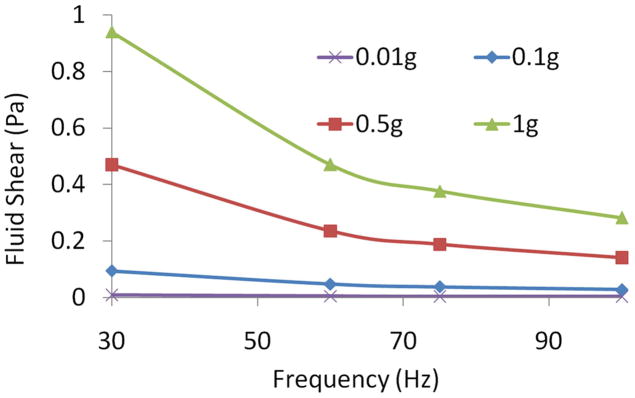
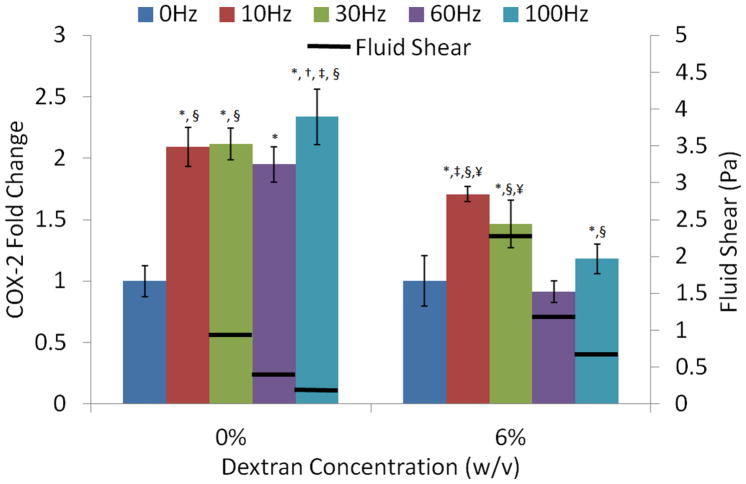
The identification of the physical mechanism(s) by which cells can sense vibrations requires the determination of the cellular mechanical environment. Here, we quantified vibration-induced fluid shear stresses in vitro and tested whether this system allows for the separation of two mechanical parameters previously proposed to drive the cellular response to vibration - fluid shear and peak accelerations. When peak accelerations of the oscillatory horizontal motions were set at 1g and 60Hz, peak fluid shear stresses acting on the cell layer reached 0.5Pa. A 3.5-fold increase in fluid viscosity increased peak fluid shear stresses 2.6-fold while doubling fluid volume in the well caused a 2-fold decrease in fluid shear. Fluid shear was positively related to peak acceleration magnitude and inversely related to vibration frequency. These data demonstrated that peak shear stress can be effectively separated from peak acceleration by controlling specific levels of vibration frequency, acceleration, and/or fluid viscosity. As an example for exploiting these relations, we tested the relevance of shear stress in promoting COX-2 expression in osteoblast like cells. Across different vibration frequencies and fluid viscosities, neither the level of generated fluid shear nor the frequency of the signal were able to consistently account for differences in the relative increase in COX-2 expression between groups, emphasizing that the eventual identification of the physical mechanism(s) requires a detailed quantification of the cellular mechanical environment.
Figures
Similar articles
-
Vibration induced osteogenic commitment of mesenchymal stem cells is enhanced by cytoskeletal remodeling but not fluid shear.J Biomech. 2013 Sep 3;46(13):2296-302. doi: 10.1016/j.jbiomech.2013.06.008. Epub 2013 Jul 17. J Biomech. 2013. PMID: 23870506 Free PMC article.
-
Gap junctional communication in osteocytes is amplified by low intensity vibrations in vitro.PLoS One. 2014 Mar 10;9(3):e90840. doi: 10.1371/journal.pone.0090840. eCollection 2014. PLoS One. 2014. PMID: 24614887 Free PMC article.
-
Vibration of osteoblastic cells using a novel motion-control platform does not acutely alter cytosolic calcium, but desensitizes subsequent responses to extracellular ATP.J Cell Physiol. 2020 Jun;235(6):5096-5110. doi: 10.1002/jcp.29378. Epub 2019 Nov 6. J Cell Physiol. 2020. PMID: 31696507
-
Fluid shear stress in trabecular bone marrow due to low-magnitude high-frequency vibration.J Biomech. 2012 Aug 31;45(13):2222-9. doi: 10.1016/j.jbiomech.2012.06.020. Epub 2012 Jul 9. J Biomech. 2012. PMID: 22784651 Clinical Trial.
-
Modeling the mechanical consequences of vibratory loading in the vertebral body: microscale effects.Biomech Model Mechanobiol. 2008 Jun;7(3):191-202. doi: 10.1007/s10237-007-0085-y. Epub 2007 May 23. Biomech Model Mechanobiol. 2008. PMID: 17520305
Cited by
-
Vertical Vibration of Mouse Osteoblasts Promotes Cellular Differentiation and Cell Cycle Progression and Induces Aging In Vitro.Biomedicines. 2023 Feb 3;11(2):444. doi: 10.3390/biomedicines11020444. Biomedicines. 2023. PMID: 36830981 Free PMC article.
-
[Influences of vibration on rapid osteogenic response of osteoblasts].Hua Xi Kou Qiang Yi Xue Za Zhi. 2017 Feb 1;35(1):68-72. doi: 10.7518/hxkq.2017.01.010. Hua Xi Kou Qiang Yi Xue Za Zhi. 2017. PMID: 28326730 Free PMC article. Chinese.
-
Increased deformations are dispensable for cell mechanoresponse in engineered bone analogs mimicking aging bone marrow.bioRxiv [Preprint]. 2023 Oct 26:2023.09.24.559187. doi: 10.1101/2023.09.24.559187. bioRxiv. 2023. Update in: Mechanobiol Med. 2025 Mar;3(1):100097. doi: 10.1016/j.mbm.2024.100097. PMID: 37905032 Free PMC article. Updated. Preprint.
-
Vibration induced osteogenic commitment of mesenchymal stem cells is enhanced by cytoskeletal remodeling but not fluid shear.J Biomech. 2013 Sep 3;46(13):2296-302. doi: 10.1016/j.jbiomech.2013.06.008. Epub 2013 Jul 17. J Biomech. 2013. PMID: 23870506 Free PMC article.
-
Vibro-Acoustic Platelet Activation: An Additive Mechanism of Prothrombosis with Applicability to Snoring and Obstructive Sleep Apnea.Bioengineering (Basel). 2023 Dec 12;10(12):1414. doi: 10.3390/bioengineering10121414. Bioengineering (Basel). 2023. PMID: 38136005 Free PMC article.
References
-
- Bacabac RG, et al. Bone cell responses to high-frequency vibration stress: does the nucleus oscillate within the cytoplasm? FASEB J. 2006;20:858. - PubMed
-
- Bauer HF, Eidel W. Oscillations of a viscous liquid in a cylindrical container. Aerospace Science and Technology. 1997;1:519.
-
- Chen DJ, Chiang FP, Tan YS, Don HS. Digital Speckle-Displacement Measurementt Using a Complex Spectrum Method. Applied Optics. 1993;32:1839. - PubMed
-
- Chen W, Haroun MA, Liu F. Large amplitude liquid sloshing in seismically excited tanks. Earthq Eng Struct Dyn. 1996;25:653.
Grants and funding
LinkOut - more resources
Full Text Sources
Research Materials
