

The probability of genetic parallelism and convergence in natural populations
- PMID: 23075840
- PMCID: PMC3497250
- DOI: 10.1098/rspb.2012.2146
The probability of genetic parallelism and convergence in natural populations
Abstract
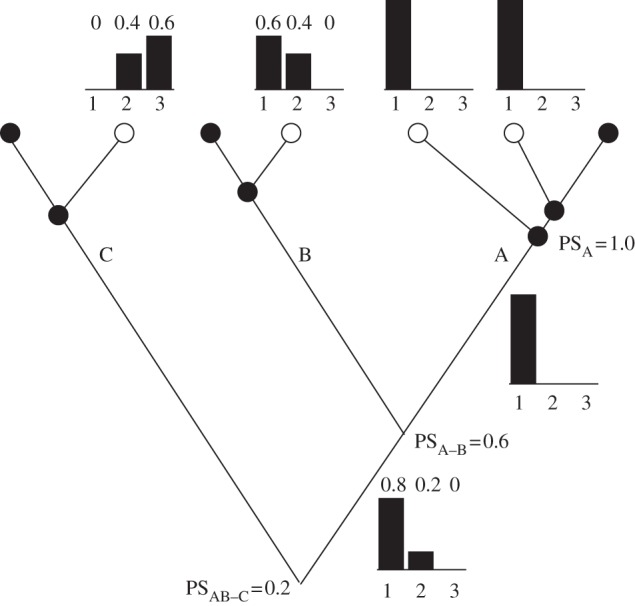
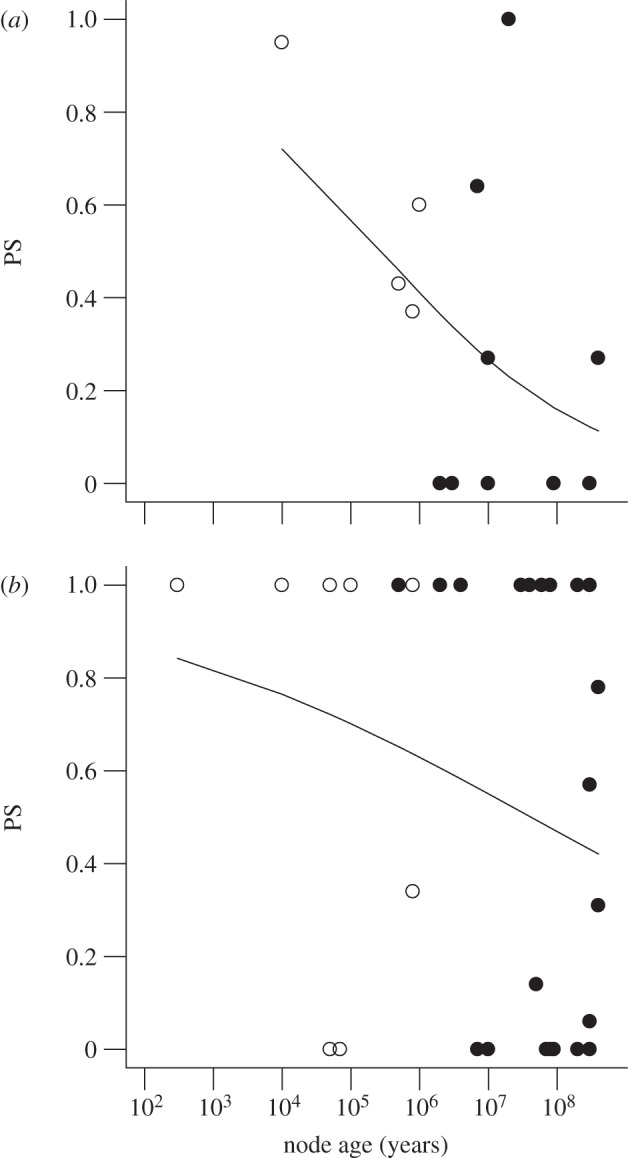
Genomic and genetic methods allow investigation of how frequently the same genes are used by different populations during adaptive evolution, yielding insights into the predictability of evolution at the genetic level. We estimated the probability of gene reuse in parallel and convergent phenotypic evolution in nature using data from published studies. The estimates are surprisingly high, with mean probabilities of 0.32 for genetic mapping studies and 0.55 for candidate gene studies. The probability declines with increasing age of the common ancestor of compared taxa, from about 0.8 for young nodes to 0.1-0.4 for the oldest nodes in our study. Probability of gene reuse is higher when populations begin from the same ancestor (genetic parallelism) than when they begin from divergent ancestors (genetic convergence). Our estimates are broadly consistent with genomic estimates of gene reuse during repeated adaptation to similar environments, but most genomic studies lack data on phenotypic traits affected. Frequent reuse of the same genes during repeated phenotypic evolution suggests that strong biases and constraints affect adaptive evolution, resulting in changes at a relatively small subset of available genes. Declines in the probability of gene reuse with increasing age suggest that these biases diverge with time.
Figures
References
-
- Endler J. A. 1986. Natural selection in the wild. Princeton, NJ: Princeton University Press
-
- Harvey P. H., Pagel M. D. 1991. The comparative method in evolutionary biology. Oxford, UK: Oxford University Press
-
- Schluter D. 2000. The ecology of adaptive radiation. Oxford, UK: Oxford University Press
-
- Losos J. B. 2011. Convergence, adaptation, and constraint. Evolution 65, 1827–184010.1111/J.1558-5646.2011.01289.X (doi:10.1111/J.1558-5646.2011.01289.X) - DOI - DOI - PubMed
-
- Orr H. A. 2005. The probability of parallel evolution. Evolution 59, 216–22010.1111/j.0014-3820.2005.tb00907.x (doi:10.1111/j.0014-3820.2005.tb00907.x) - DOI - DOI - PubMed
Publication types
MeSH terms
Grants and funding
LinkOut - more resources
Full Text Sources