. 2013 Jan;109(2):603-20.
doi: 10.1152/jn.00528.2012. Epub 2012 Oct 17.

Reliable evaluation of the quantal determinants of synaptic efficacy using Bayesian analysis

Affiliations

Reliable evaluation of the quantal determinants of synaptic efficacy using Bayesian analysis

G S Bhumbra et al. J Neurophysiol. 2013 Jan.

Abstract

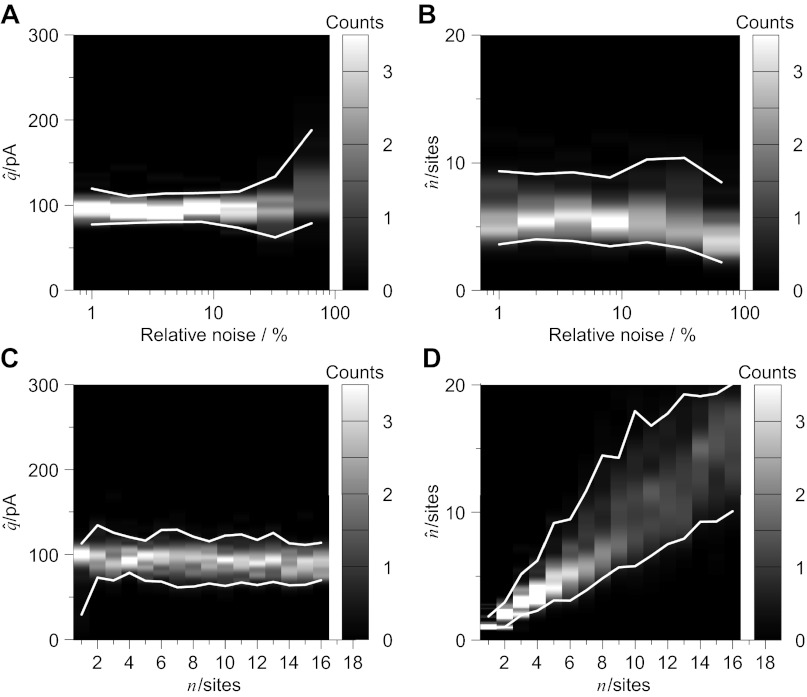
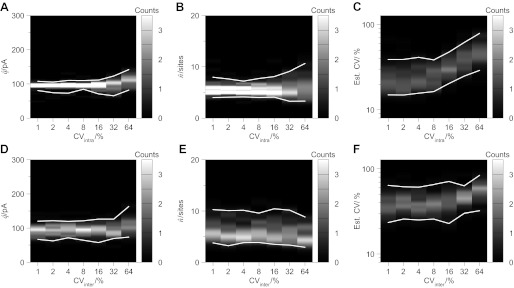
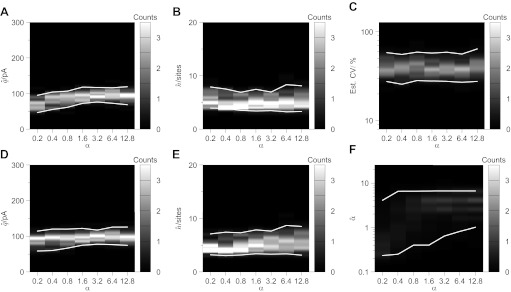
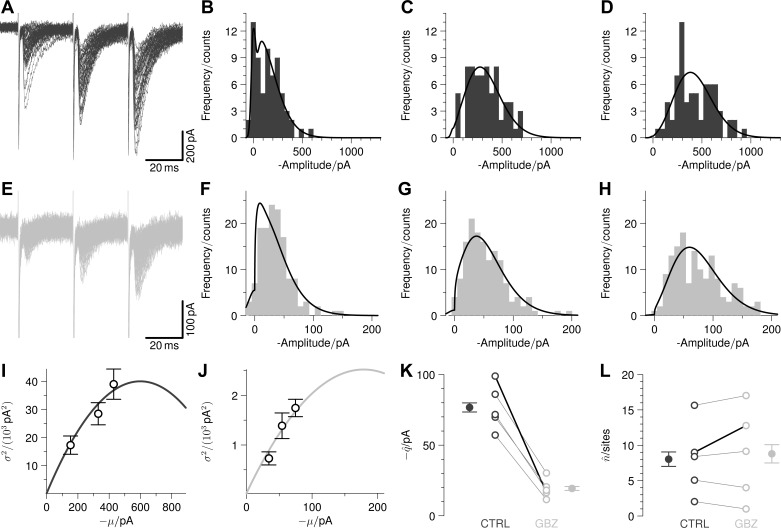
Communication between neurones in the central nervous system depends on synaptic transmission. The efficacy of synapses is determined by pre- and postsynaptic factors that can be characterized using quantal parameters such as the probability of neurotransmitter release, number of release sites, and quantal size. Existing methods of estimating the quantal parameters based on multiple probability fluctuation analysis (MPFA) are limited by their requirement for long recordings to acquire substantial data sets. We therefore devised an algorithm, termed Bayesian Quantal Analysis (BQA), that can yield accurate estimates of the quantal parameters from data sets of as small a size as 60 observations for each of only 2 conditions of release probability. Computer simulations are used to compare its performance in accuracy with that of MPFA, while varying the number of observations and the simulated range in release probability. We challenge BQA with realistic complexities characteristic of complex synapses, such as increases in the intra- or intersite variances, and heterogeneity in release probabilities. Finally, we validate the method using experimental data obtained from electrophysiological recordings to show that the effect of an antagonist on postsynaptic receptors is correctly characterized by BQA by a specific reduction in the estimates of quantal size. Since BQA routinely yields reliable estimates of the quantal parameters from small data sets, it is ideally suited to identify the locus of synaptic plasticity for experiments in which repeated manipulations of the recording environment are unfeasible.


Figures

Fig. 1.
Fig. 1.
A realistic mixture model to describe the amplitude distribution of evoked responses comprises a minimum of three elements. First, a probability mass function must be assigned for the mixture weights; the example illustrated in A shows a binomial distribution that describes the probability of observing i Bernoulli successes from six release sites each with a release probability of 0.35. The second is the density function used to model baseline noise, such the normal distribution shown in B with a zero mean and a variance of 625 pA2 (standard deviation 25 pA). Finally, a probability density function is required to characterize the amplitude distribution of a uniquantal event; here we use a gamma distribution and illustrate an example in C with a gamma shaping parameter of γ = 11.1̄ and gamma scaling parameter of λ = 9 pA, corresponding to a mean quantal size of q = 100 pA since q = γλ. Quantal likelihood function expressed in Eq. 8 combines the three components as illustrated in D (solid line) with the dashed and dotted lines showing the normal and individual gamma components respectively.
Fig. 2.
Fig. 2.
Compared with multiple fluctuation probability analysis (MPFA), Bayesian quantal analysis (BQA) yields more accurate estimates of the quantal size q and number of release sites n for small data sets. Computer simulations (q = 100 pA, n = 6 sites, CVintra = 0.3, baseline noise= 0 ± 25 pA) were used to generate 60 data for each of two conditions of release probability (P1 = 0.1 fixed, P2 variable) over a specific range (0.05 ≤ ΔP ≤ 0.8 with increment 0.01). Gaussian-smoothed histograms from 100 simulations illustrate the estimates obtained from MPFA for the quantal size (A) and number of release sites (B) with the 95% confidence limits shown in white (in both plots the y-axis is truncated); corresponding plots for BQA are shown (without truncation) in C and D. Representative examples of mean-variance plots are shown in EP = 0.2) and FP = 0.7). The simulated release probabilities and the correct parabolae predicted theoretically from the parameters used for the computer simulations are shown as dotted lines, the best-fit parabolae for MPFA represented as dashed lines, and the parabolae projected by BQA overlayed as solid lines.
Fig. 3.
Fig. 3.
Bayesian quantal analysis combines information from the amplitude distributions of all data from every condition of release probability to yield accurate estimates of the quantal parameters with small data sets (here taken from the data illustrated in Fig. 2F). The conditional posterior distributions for the quantal size q and maximal response r (where r = nq) are illustrated for the data simulated at a low (P1 = 0.1; A) and high (P2 = 0.8, B) release probabilities (q = 100 pA, n =6 release sites). With the use of the product rule, the joint posterior distribution for both parameters could be calculated (C) and marginalized by sum rule to evaluate the marginal posteriors for the quantal size (D) and maximal response (E). BQA also characterizes the variability of the quantal events, here using a gamma shaping parameter γ (see text), to allow its estimation from its respective marginal posterior (F). G and H: distribution of the data (bin width = 20 pA) for the two conditions of release probability with their projected profile by the model overlayed a solid line.
Fig. 4.
Fig. 4.
Whereas MPFA requires data sets acquired at high release probabilities or of a large size for accurate estimation of the number of the release sites, BQA does not. Computer simulations (q = 100 pA, n = 6 sites, CVintra = 0.3, baseline noise= 0 ± 25 pA) were used to generate 60 data for each condition of release probability. Gaussian-smoothed histograms from 100 simulations illustrate the estimates obtained from MPFA for the quantal size (A) and number of release sites (B) with the 95% confidence limits shown in white (in both plots the y-axis is truncated) for data simulated with three conditions of release probability [P1 = 0.1 fixed, P3 = P1 + ΔP, P2 = ½(P1 + P3)] over a specific range (0.05 ≤ ΔP ≤ 0.8 with increment 0.01). Corresponding plots for BQA are shown (without truncation) in C and D. Using only two conditions (ΔP = 0.5), we assessed the effects of increasing the lower probability (0.10 ≤ P1 ≤ 0.40, increment 0.01) on MPFA estimates of quantal size (E) and number of release sites (F, truncated) as well as the BQA estimates (G and H). To assess the effects of the data size, the release probabilities for the two conditions was fixed (to P1 = 0.1 and P2 = 0.6) while adjusting the size of the data set for each condition (30 ≤ |xk| ≤ 120, increment 2). Gaussian-smoothed histograms are shown for the MPFA estimates for the quantal size (I) and number of release sites (J, truncated), and for the equivalent plots for BQA (without truncation) in K and L.
Fig. 5.
Fig. 5.
BQA is robust to increases in the relative noise and number of release sites. Computer simulations (see Fig. 4) were undertaken with either changes in baseline noise (relative to the quantal size) or number of release sites. Increases in relative noise did not preclude estimation of quantal size (A) and number of release sites (B). Changes in the simulated number of release sites had no discernible effect on the estimated quantal size (C) yet were well detected by BQA (D).
Fig. 6.
Fig. 6.
BQA is robust to sources of variability in quantal events. Computer simulations (see Fig. 4) were undertaken with either changes in the intrasite coefficient of variation (Gaussian distributed) or intersite coefficient of variation (gamma-distributed, superimposing a preexisting Gaussian intrasite coefficient of variation of 30%). While very low intrasite coefficients of variation improved the accuracy of estimates of the quantal size (A) and number of release sites (B), estimates were robust with high variability. Changes in intrasite variability were detected by BQA estimates (C). Increases in intersite variability (superimposing a 30% intrasite variability) had no discernible effect on the estimated quantal size (D) and number of release sites (E) yet they were detected by BQA (F).
Fig. 7.
Fig. 7.
BQA is robust to heterogeneity in the release probabilities across different release sites. Computer simulations (q = 100 pA, n = 6 sites, CVintra = 0.3, baseline noise= 0 ± 25 pA) were used to generate 60 data for 3 conditions of mean release probability (P1 = 0.1, P2 = 0.5, P3 = 0.9) in which the distribution of probability across release sites conformed to a beta distribution of variable homogenity α. Increases in homogenity showed only marginal effects on the estimates obtained from a BQA model, that assumed homogeneous probability of release, for the quantal size (a), number of release sites (B), and quantal variability (C); effects were minimal from α ≥ 0.4. BQA incorporating a beta probability density function to model heterogeneous probabilities of release yielded accurate estimates for both quantal size (D) and number of release sites (E) throughout the entire range of homogeneity and changes in heterogeneity were detected (F).
Fig. 8.
Fig. 8.
BQA correctly showed that the effects of gabazine (SR-95531) on glycinergic synapses on lumbar motoneurones result in a reduction in quantal size without affecting the number release sites. Responses to trains of three stimulation pulses in control conditions are shown in dark grey (representative traces overlayed in A; stimulus artifacts truncated), with the corresponding distributions of all evoked responses represented as histograms (B–D). Attenuated responses (E) and associated distributions (F–H) in the presence of 100 μM gabazine are shown in light grey. Mean variance plots in control conditions (I) and in the presence of gabazine (J) are illustrated overlayed with the parabolae calculated from the BQA estimates showing a reduction in quantal size (from −98.9 to −16.4 pA) with little change in number of release sites (from 9.0 sites to 12.8 sites). Group comparisons (with means ± SE) of the quantal size (K) and number of release sites (L) between control conditions (dark grey: CTRL) and in the presence of gabazine (light grey: GBZ) are shown with the lines for the illustrated example emboldened in black.

References

    1. Beato M. The time course of transmitter at glycinergic synapses onto motoneurons. J Neurosci 28: 7412–7425, 2008 - PMC - PubMed
    1. Bekkers J. Quantal analysis of synaptic transmission in the central nervous system. Curr Opin Neurobiol 4: 360–365, 1994 - PubMed
    1. Bekkers J, Clements J. Quantal amplitude and quantal variance of strontium-induced asynchronous epscs in rat dentate granule neurons. J Physiol 516: 227–248, 1999 - PMC - PubMed
    1. Bekkers J, Richerson G, Stevens C. Origin of variability in quantal size in cultured hippocampal neurons and hippocampal slices. Proc Natl Acad Sci USA 87: 5359–5362, 1990 - PMC - PubMed
    1. Bennett M, Florin T. A statistical analysis of the release of acetylcholine at newly formed synapses in striated muscle. J Physiol 238: 93–107, 1974 - PMC - PubMed

Publication types

LinkOut - more resources