

Metabotropic glutamate receptors and glutamate transporters shape transmission at the developing retinogeniculate synapse
- PMID: 23076103
- PMCID: PMC3545160
- DOI: 10.1152/jn.00897.2012
Metabotropic glutamate receptors and glutamate transporters shape transmission at the developing retinogeniculate synapse
Abstract
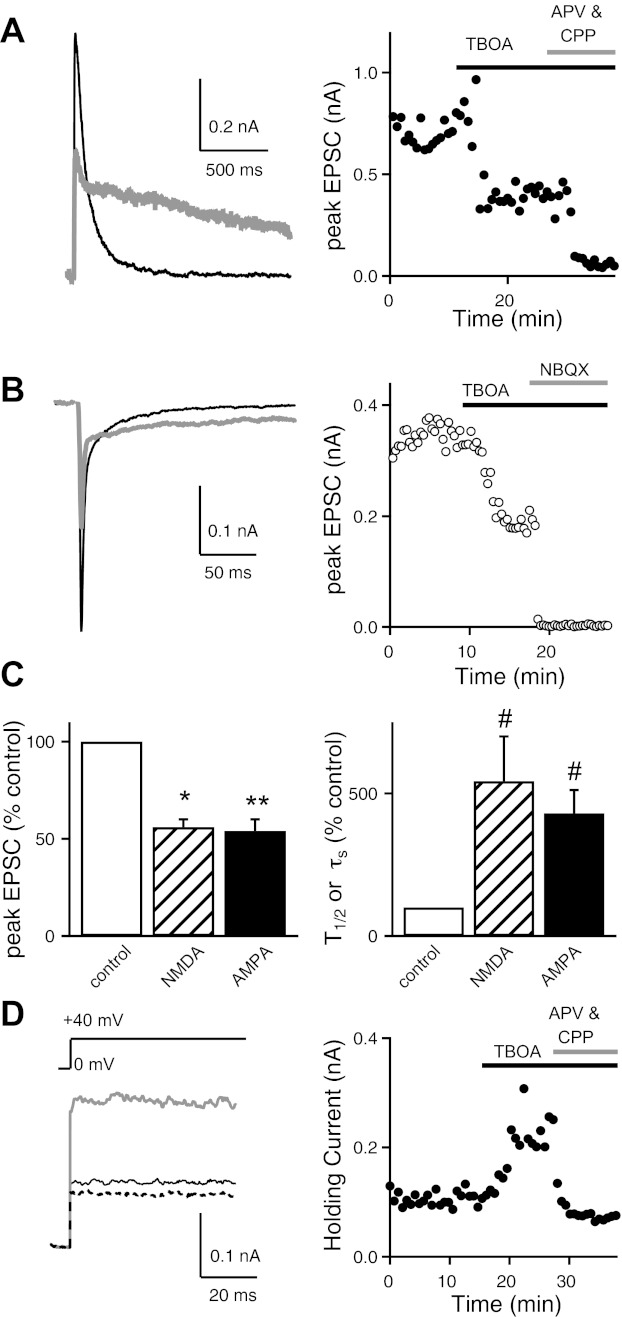
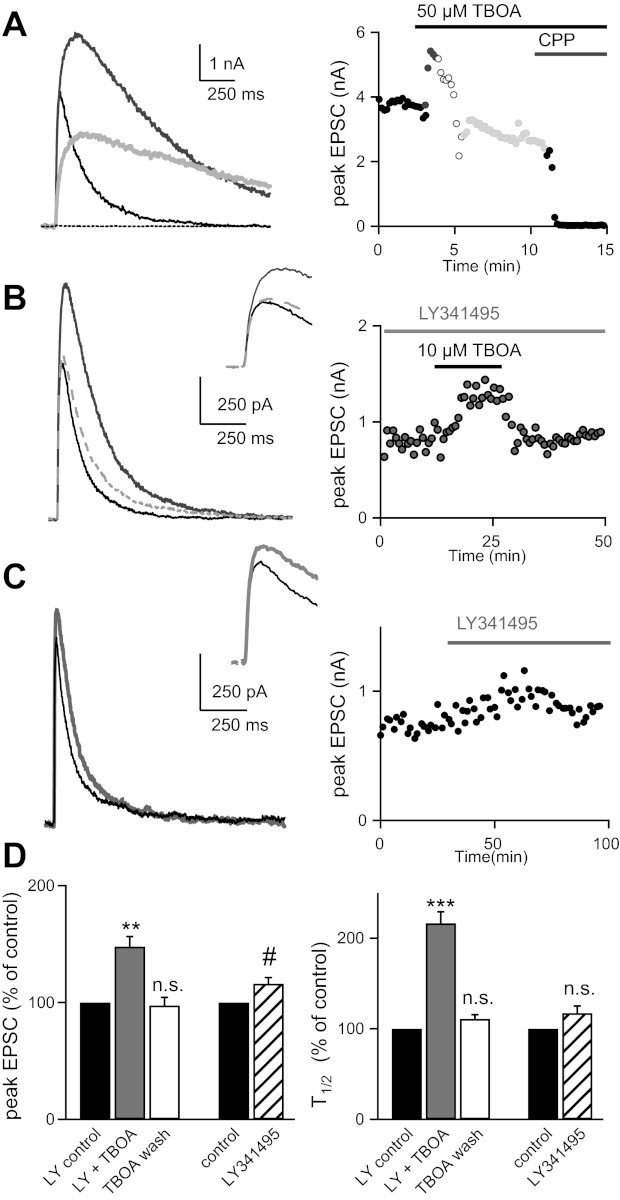
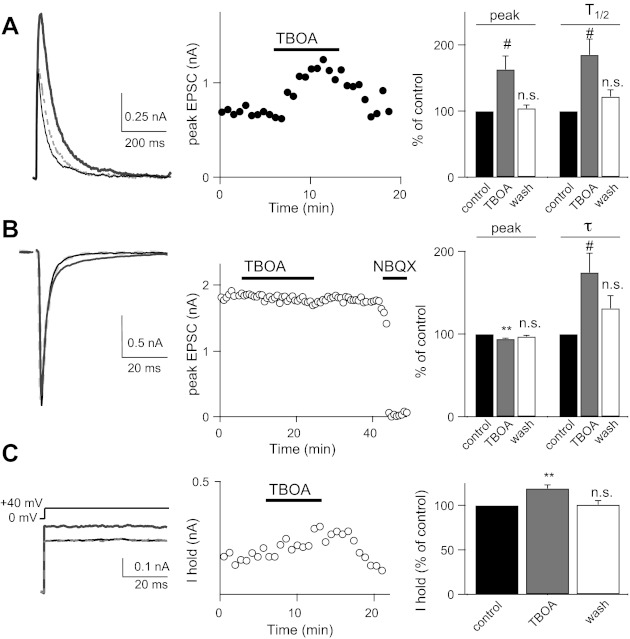
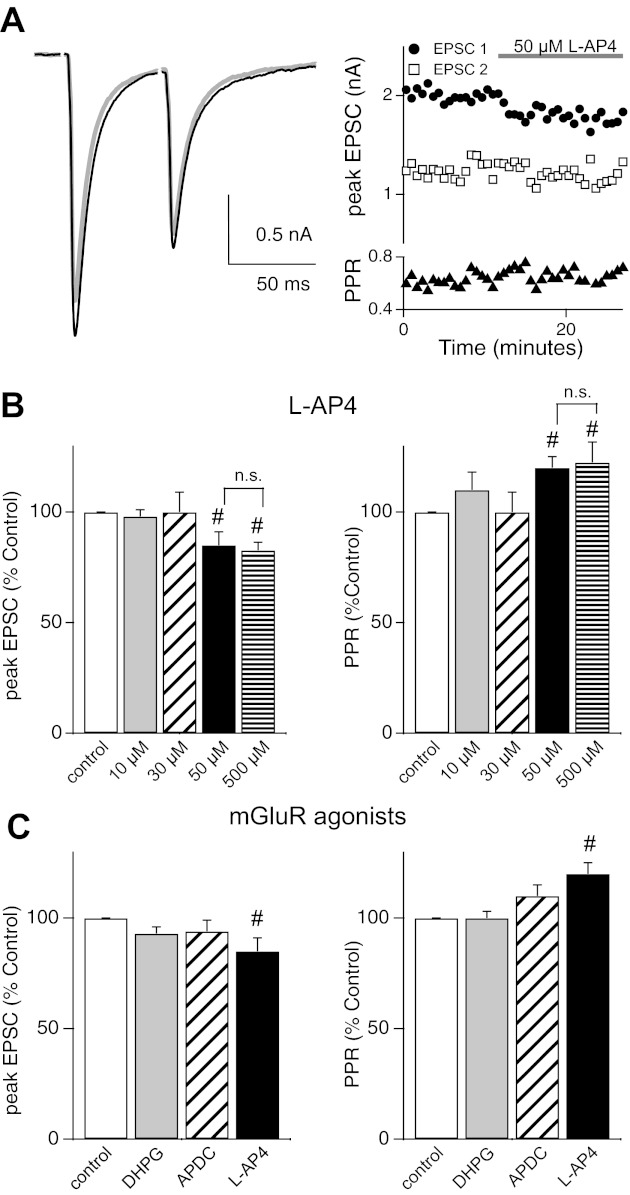
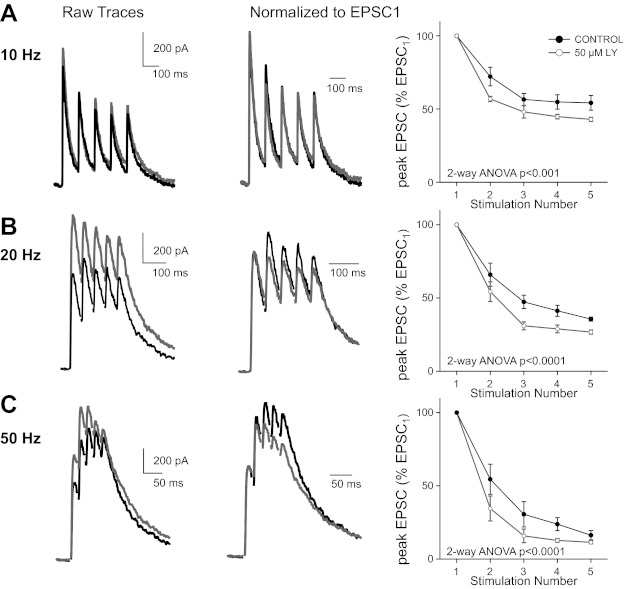
Over the first few postnatal weeks, extensive remodeling occurs at the developing murine retinogeniculate synapse, the connection between retinal ganglion cells (RGCs) and the visual thalamus. Although numerous studies have described the role of activity in the refinement of this connection, little is known about the mechanisms that regulate glutamate concentration at and around the synapse over development. Here we show that interactions between glutamate transporters and metabotropic glutamate receptors (mGluRs) dynamically control the peak and time course of the excitatory postsynaptic current (EPSC) at the immature synapse. Inhibiting glutamate transporters by bath application of TBOA (DL-threo-β-benzyloxyaspartic acid) prolonged the decay kinetics of both α-amino-3-hydroxy-5-methyl-4-isoxazolepropionic acid receptor (AMPAR) and N-methyl-D-aspartate receptor (NMDAR) currents at all ages. Moreover, at the immature synapse, TBOA-induced increases in glutamate concentration led to the activation of group II/III mGluRs and a subsequent reduction in neurotransmitter release at RGC terminals. Inhibition of this negative-feedback mechanism resulted in a small but significant increase in peak NMDAR EPSCs during basal stimulation and a substantial increase in the peak with coapplication of TBOA. Activation of mGluRs also shaped the synaptic response during high-frequency trains of stimulation that mimic spontaneous RGC activity. At the mature synapse, however, the group II mGluRs and the group III mGluR7-mediated response are downregulated. Our results suggest that transporters reduce spillover of glutamate, shielding NMDARs and mGluRs from the neurotransmitter. Furthermore, mechanisms of glutamate clearance and release interact dynamically to control the glutamate transient at the developing retinogeniculate synapse.
Figures

Similar articles
-
Astrocyte glutamate transporters regulate metabotropic glutamate receptor-mediated excitation of hippocampal interneurons.J Neurosci. 2004 May 12;24(19):4551-9. doi: 10.1523/JNEUROSCI.5217-03.2004. J Neurosci. 2004. PMID: 15140926 Free PMC article.
-
Different roles for AMPA and NMDA receptors in transmission at the immature retinogeniculate synapse.J Neurophysiol. 2008 Feb;99(2):629-43. doi: 10.1152/jn.01171.2007. Epub 2007 Nov 21. J Neurophysiol. 2008. PMID: 18032559
-
Involvement of group I metabotropic glutamate receptors and glutamate transporters in the slow excitatory synaptic transmission in the spinal cord dorsal horn.Neuroscience. 2008 Jul 17;154(4):1372-87. doi: 10.1016/j.neuroscience.2008.04.059. Epub 2008 May 3. Neuroscience. 2008. PMID: 18554818
-
The function of metabotropic glutamate receptors in thalamus and cortex.Neuroscientist. 2014 Apr;20(2):136-49. doi: 10.1177/1073858413478490. Epub 2013 Mar 4. Neuroscientist. 2014. PMID: 23459618 Free PMC article. Review.
-
Role of glutamate in the development of visual pathways.Front Ophthalmol (Lausanne). 2023 Mar 3;3:1147769. doi: 10.3389/fopht.2023.1147769. eCollection 2023. Front Ophthalmol (Lausanne). 2023. PMID: 38983097 Free PMC article. Review.
Cited by
-
An evolving view of retinogeniculate transmission.Vis Neurosci. 2017 Jan;34:E013. doi: 10.1017/S0952523817000104. Vis Neurosci. 2017. PMID: 28965513 Free PMC article. Review.
-
Functional convergence of on-off direction-selective ganglion cells in the visual thalamus.Curr Biol. 2022 Jul 25;32(14):3110-3120.e6. doi: 10.1016/j.cub.2022.06.023. Epub 2022 Jul 5. Curr Biol. 2022. PMID: 35793680 Free PMC article.
-
Activation of both Group I and Group II metabotropic glutamatergic receptors suppress retinogeniculate transmission.Neuroscience. 2013 Jul 9;242:78-84. doi: 10.1016/j.neuroscience.2013.03.043. Epub 2013 Apr 1. Neuroscience. 2013. PMID: 23558090 Free PMC article.
-
Retinal Inputs to the Thalamus Are Selectively Gated by Arousal.Curr Biol. 2020 Oct 19;30(20):3923-3934.e9. doi: 10.1016/j.cub.2020.07.065. Epub 2020 Aug 13. Curr Biol. 2020. PMID: 32795442 Free PMC article.
-
Mechanisms regulating spill-over of synaptic glutamate to extrasynaptic NMDA receptors in mouse substantia nigra dopaminergic neurons.Eur J Neurosci. 2015 Nov;42(9):2633-43. doi: 10.1111/ejn.13075. Epub 2015 Oct 20. Eur J Neurosci. 2015. PMID: 26370007 Free PMC article.
References
-
- Aggelopoulos N, Parnavelas JG, Edmunds S. Synaptogenesis in the dorsal lateral geniculate nucleus of the rat. Anat Embryol (Berl) 180: 243–257, 1989 - PubMed
-
- Akerman CJ, Smyth D, Thompson ID. Visual experience before eye-opening and the development of the retinogeniculate pathway. Neuron 36: 869–879, 2002 - PubMed
-
- Alexander GM, Godwin DW. Presynaptic inhibition of corticothalamic feedback by metabotropic glutamate receptors. J Neurophysiol 94: 163–175, 2005 - PubMed
-
- Alexander GM, Godwin DW. Unique presynaptic and postsynaptic roles of group II metabotropic glutamate receptors in the modulation of thalamic network activity. Neuroscience 141: 501–513, 2006 - PubMed
Publication types
MeSH terms
Substances
Grants and funding
LinkOut - more resources
Full Text Sources
Other Literature Sources