

Stac3 is required for myotube formation and myogenic differentiation in vertebrate skeletal muscle
- PMID: 23076145
- PMCID: PMC3527977
- DOI: 10.1074/jbc.M112.361311
Stac3 is required for myotube formation and myogenic differentiation in vertebrate skeletal muscle
Abstract
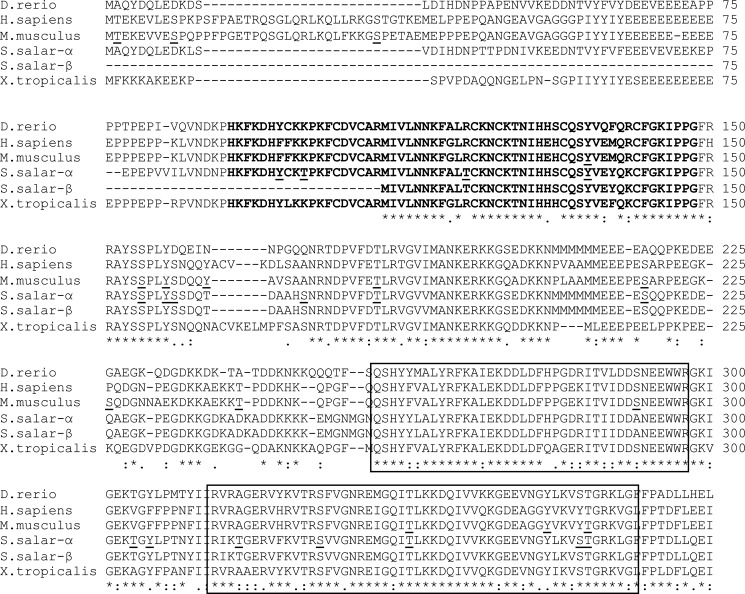
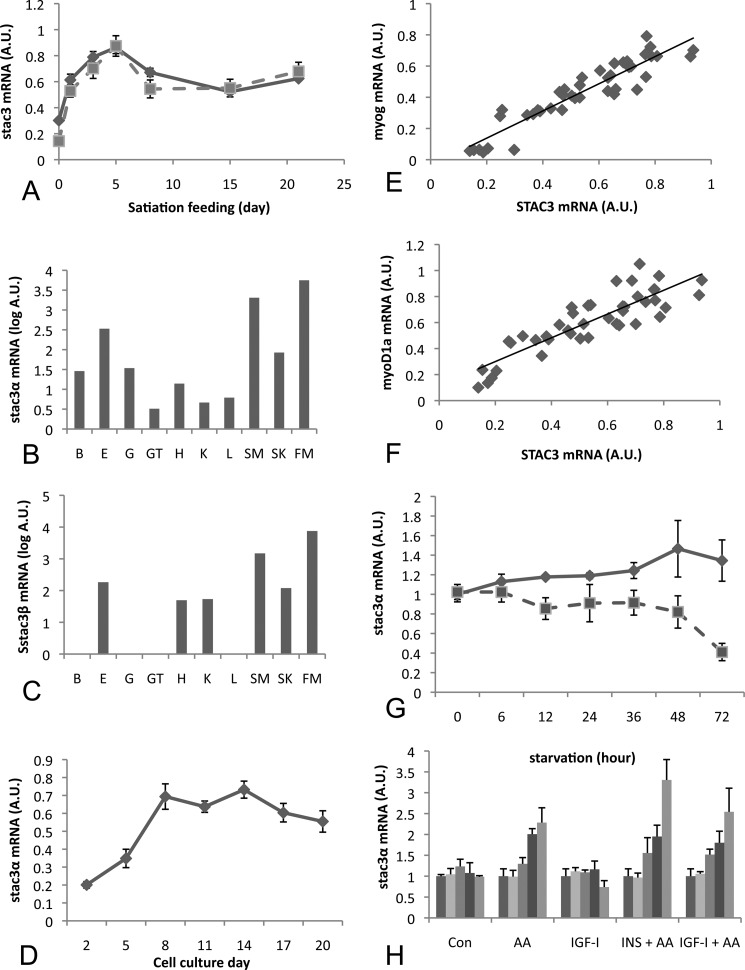
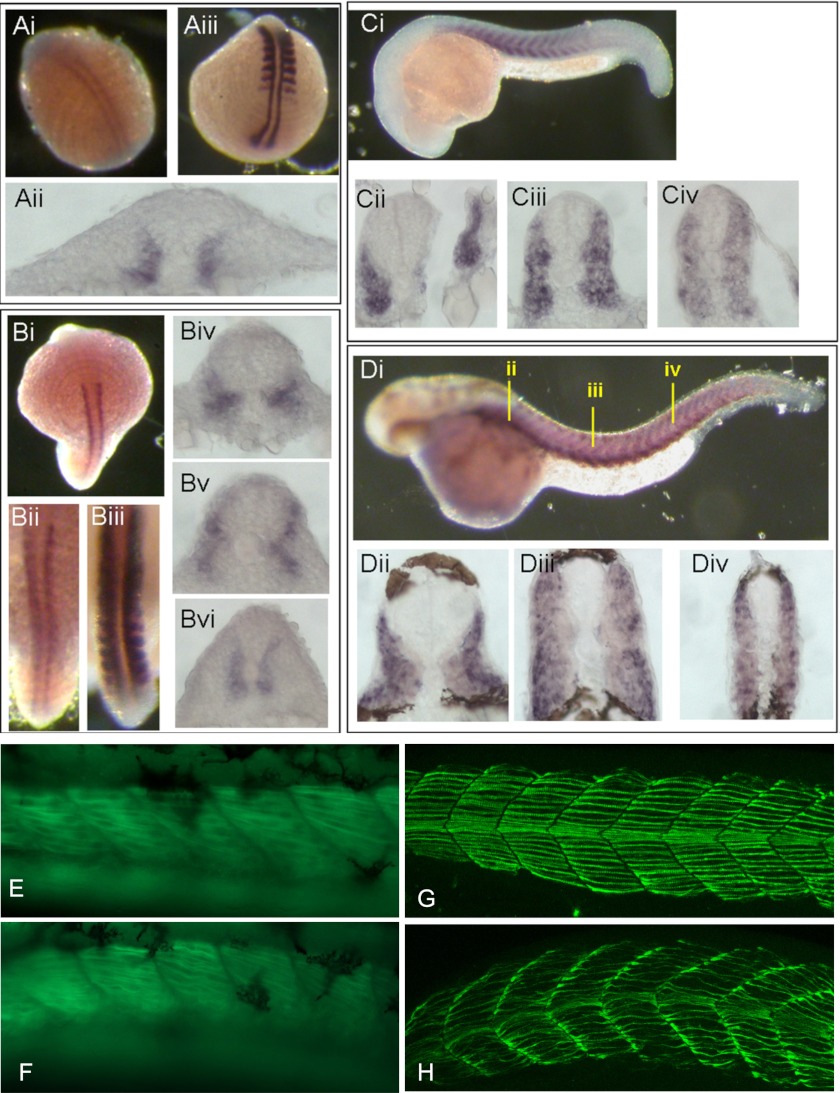
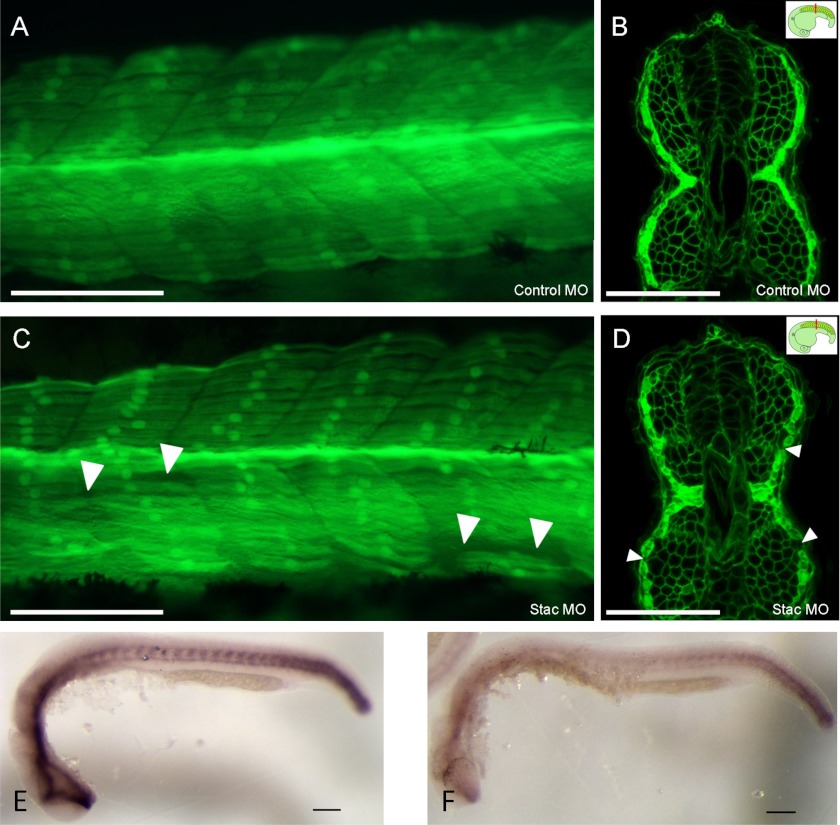
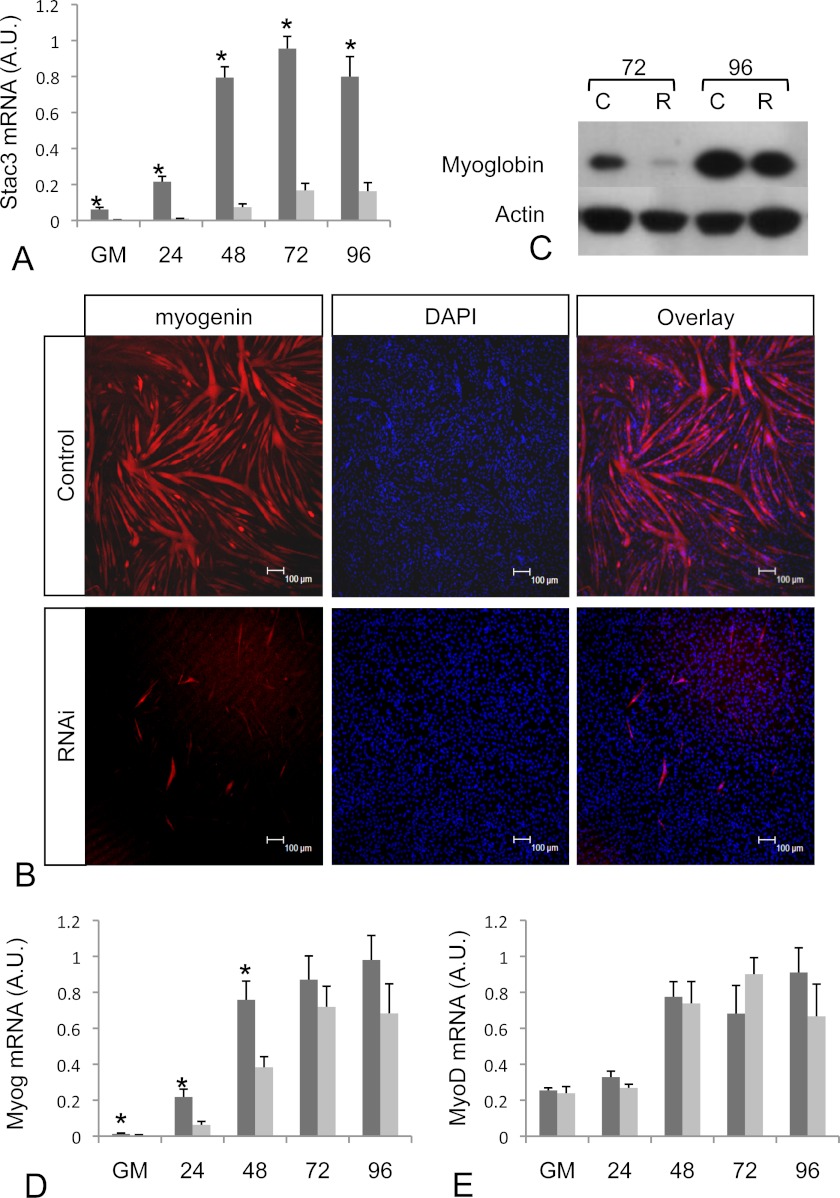
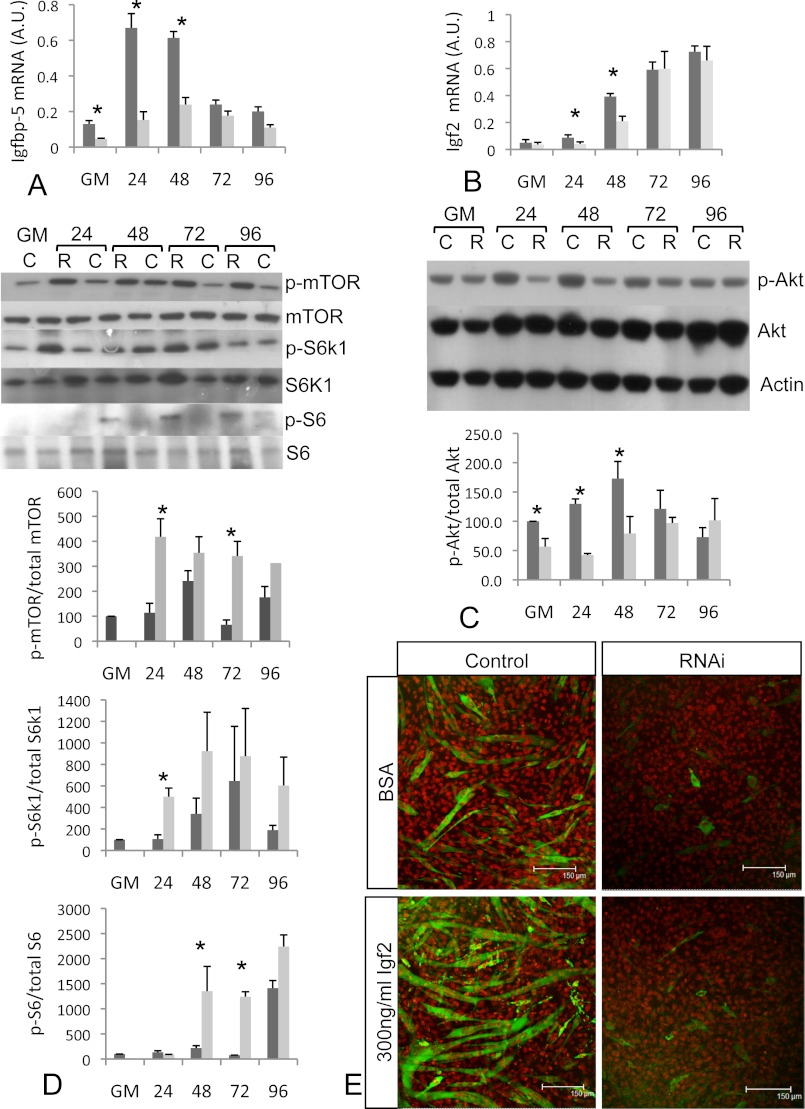
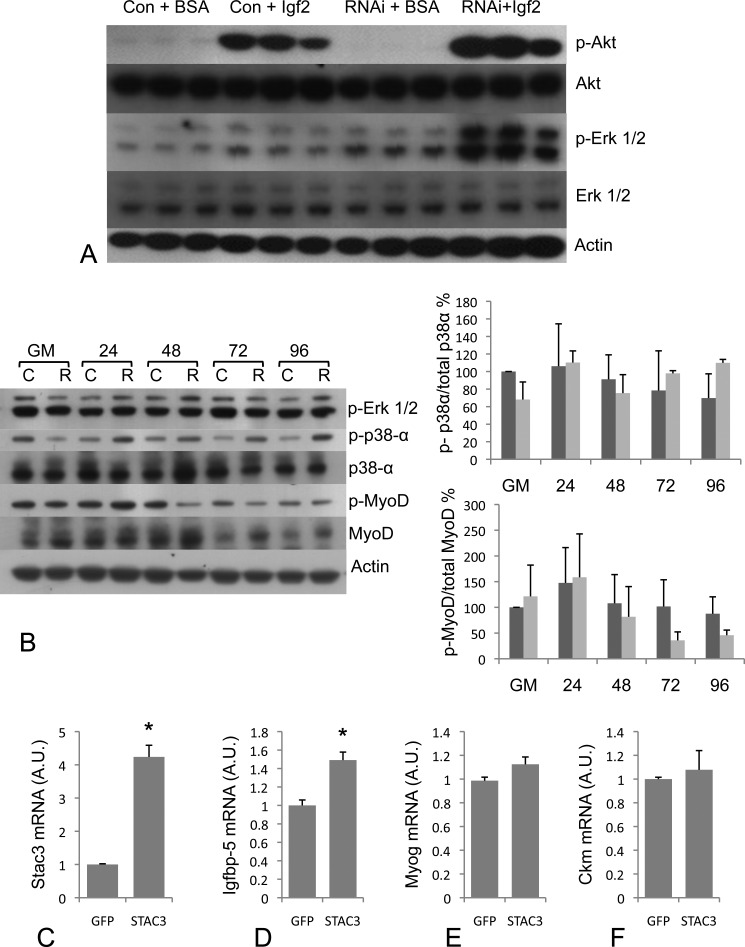
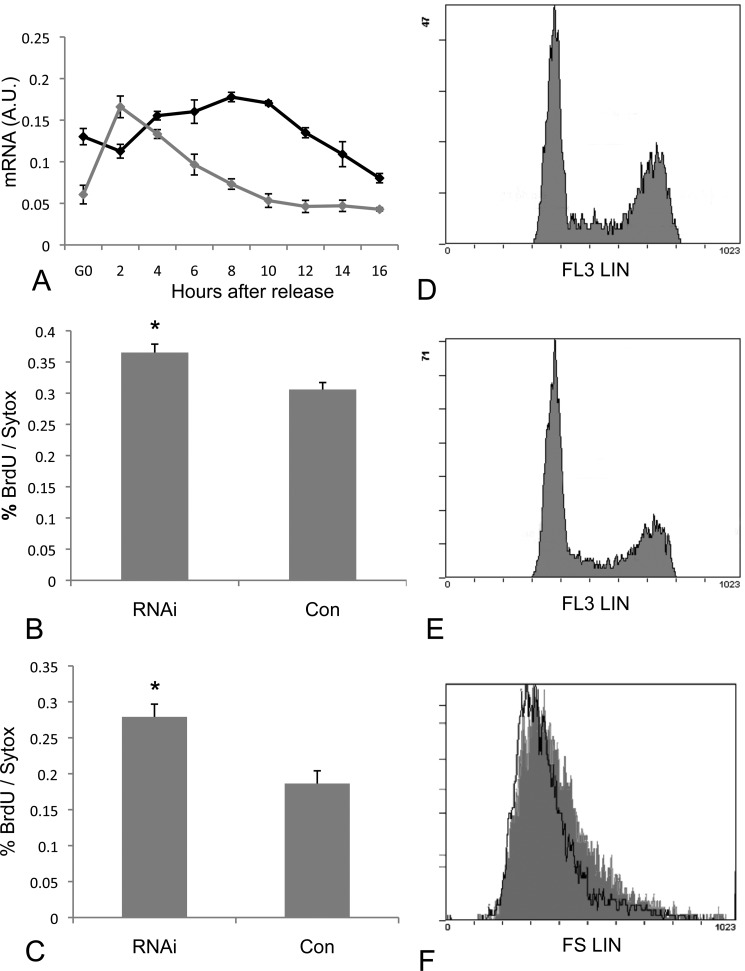
Stac3 was identified as a nutritionally regulated gene from an Atlantic salmon subtractive hybridization library with highest expression in skeletal muscle. Salmon Stac3 mRNA was highly correlated with myogenin and myoD1a expression during differentiation of a salmon primary myogenic culture and was regulated by amino acid availability. In zebrafish embryos, stac3 was initially expressed in myotomal adaxial cells and in fast muscle fibers post-segmentation. Morpholino knockdown resulted in defects in myofibrillar protein assembly, particularly in slow muscle fibers, and decreased levels of the hedgehog receptor patched. The function of Stac3 was further characterized in vitro using the mammalian C2C12 myogenic cell line. Stac3 mRNA expression increased during the differentiation of the C2C12 myogenic cell line. Knockdown of Stac3 by RNAi inhibited myotube formation, and microarray analysis revealed that transcripts involved in cell cycle, focal adhesion, cytoskeleton, and the pro-myogenic factors Igfbp-5 and Igf2 were down-regulated. RNAi-treated cells had suppressed Akt signaling and exogenous insulin-like growth factor (Igf) 2 was unable to rescue the phenotype, however, Igf/Akt signaling was not blocked. Overexpression of Stac3, which results in increased levels of Igfbp-5 mRNA, did not lead to increased differentiation. In synchronized cells, Stac3 mRNA was most abundant during the G(1) phase of the cell cycle. RNAi-treated cells were smaller, had higher proliferation rates and a decreased proportion of cells in G(1) phase when compared with controls, suggesting a role in the G(1) phase checkpoint. These results identify Stac3 as a new gene required for myogenic differentiation and myofibrillar protein assembly in vertebrates.
Figures
Similar articles
-
Stac3 inhibits myoblast differentiation into myotubes.PLoS One. 2014 Apr 30;9(4):e95926. doi: 10.1371/journal.pone.0095926. eCollection 2014. PLoS One. 2014. PMID: 24788338 Free PMC article.
-
Paralogs of Atlantic salmon myoblast determination factor genes are distinctly regulated in proliferating and differentiating myogenic cells.Am J Physiol Regul Integr Comp Physiol. 2010 Jun;298(6):R1615-26. doi: 10.1152/ajpregu.00114.2010. Epub 2010 Apr 7. Am J Physiol Regul Integr Comp Physiol. 2010. PMID: 20375265
-
Identification of the STAC3 gene as a skeletal muscle-specifically expressed gene and a novel regulator of satellite cell differentiation in cattle.J Anim Sci. 2014 Aug;92(8):3284-90. doi: 10.2527/jas.2014-7656. Epub 2014 Jun 19. J Anim Sci. 2014. PMID: 24948655
-
Divergent regulation of insulin-like growth factor binding protein genes in cultured Atlantic salmon myotubes under different models of catabolism and anabolism.Gen Comp Endocrinol. 2017 Jun 1;247:53-65. doi: 10.1016/j.ygcen.2017.01.017. Epub 2017 Jan 19. Gen Comp Endocrinol. 2017. PMID: 28109823
-
Muscle-specific gene expression and metabolic enzyme activities in Atlantic salmon Salmo salar L. fry reared under different photoperiod regimes.Comp Biochem Physiol B Biochem Mol Biol. 2020 Jan;239:110330. doi: 10.1016/j.cbpb.2019.110330. Epub 2019 Aug 26. Comp Biochem Physiol B Biochem Mol Biol. 2020. PMID: 31465878
Cited by
-
Stac3 inhibits myoblast differentiation into myotubes.PLoS One. 2014 Apr 30;9(4):e95926. doi: 10.1371/journal.pone.0095926. eCollection 2014. PLoS One. 2014. PMID: 24788338 Free PMC article.
-
Lysine and Leucine Deficiencies Affect Myocytes Development and IGF Signaling in Gilthead Sea Bream (Sparus aurata).PLoS One. 2016 Jan 25;11(1):e0147618. doi: 10.1371/journal.pone.0147618. eCollection 2016. PLoS One. 2016. PMID: 26808650 Free PMC article.
-
Structural insights into binding of STAC proteins to voltage-gated calcium channels.Proc Natl Acad Sci U S A. 2017 Nov 7;114(45):E9520-E9528. doi: 10.1073/pnas.1708852114. Epub 2017 Oct 23. Proc Natl Acad Sci U S A. 2017. PMID: 29078335 Free PMC article.
-
Stac3 is a component of the excitation-contraction coupling machinery and mutated in Native American myopathy.Nat Commun. 2013;4:1952. doi: 10.1038/ncomms2952. Nat Commun. 2013. PMID: 23736855 Free PMC article.
-
Skeletal muscle-specific T-tubule protein STAC3 mediates voltage-induced Ca2+ release and contractility.Proc Natl Acad Sci U S A. 2013 Jul 16;110(29):11881-6. doi: 10.1073/pnas.1310571110. Epub 2013 Jul 1. Proc Natl Acad Sci U S A. 2013. PMID: 23818578 Free PMC article.
References
-
- Suzuki H., Kawai J., Taga C., Yaoi T., Hara A., Hirose K., Hayashizaki Y., Watanabe S. (1996) Stac, a novel neuron-specific protein with cysteine-rich and SH3 domains. Biochem. Biophys. Res. Commun. 229, 902–909 - PubMed
-
- Legha W., Gaillard S., Gascon E., Malapert P., Hocine M., Alonso S., Moqrich A. (2010) stac1 and stac2 genes define discrete and distinct subsets of dorsal root ganglia neurons. Gene Expr. Patterns 10, 368–375 - PubMed
-
- Satoh J., Nanri Y., Yamamura T. (2006) Rapid identification of 14-3-3 proteins by protein microarray analysis. J. Neurosci. Methods 152, 278–288 - PubMed
-
- Dougherty M. K., Morrison D. K. (2004) Unlocking the code of 14-3-3. J. Cell Sci. 117, 1875–1884 - PubMed
Publication types
MeSH terms
Substances
LinkOut - more resources
Full Text Sources
Molecular Biology Databases
Miscellaneous
