. 2012 Oct 17;32(42):14489-510.
doi: 10.1523/JNEUROSCI.1256-12.2012.

Inflammatory mediators alter the astrocyte transcriptome and calcium signaling elicited by multiple G-protein-coupled receptors

Affiliations

Inflammatory mediators alter the astrocyte transcriptome and calcium signaling elicited by multiple G-protein-coupled receptors

Mary E Hamby et al. J Neurosci. .

Abstract

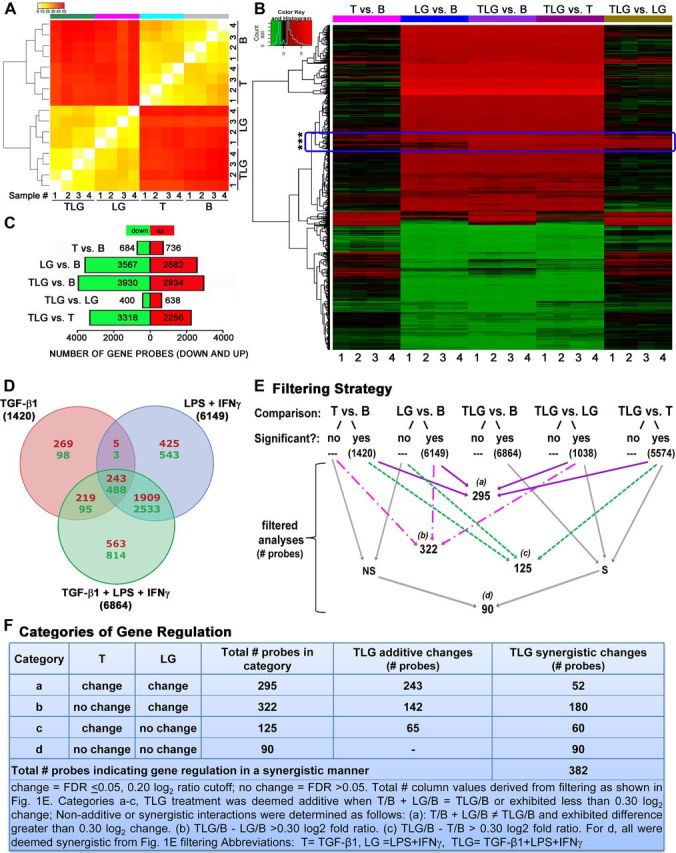
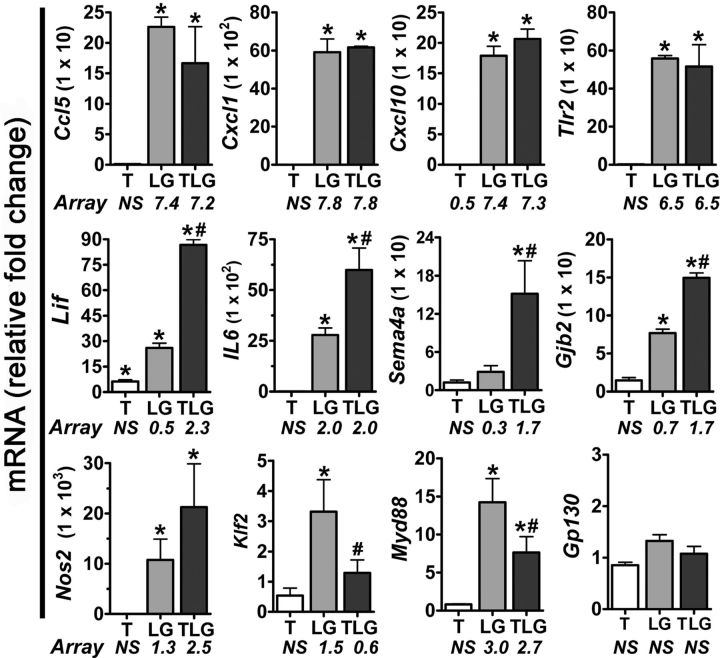
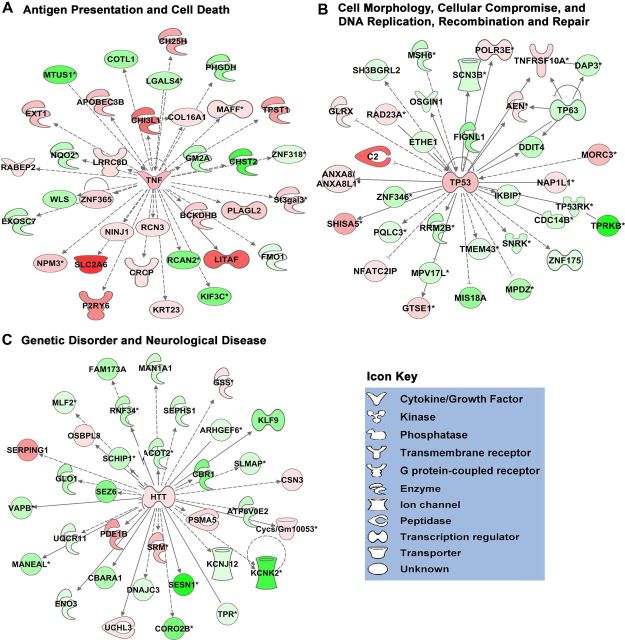
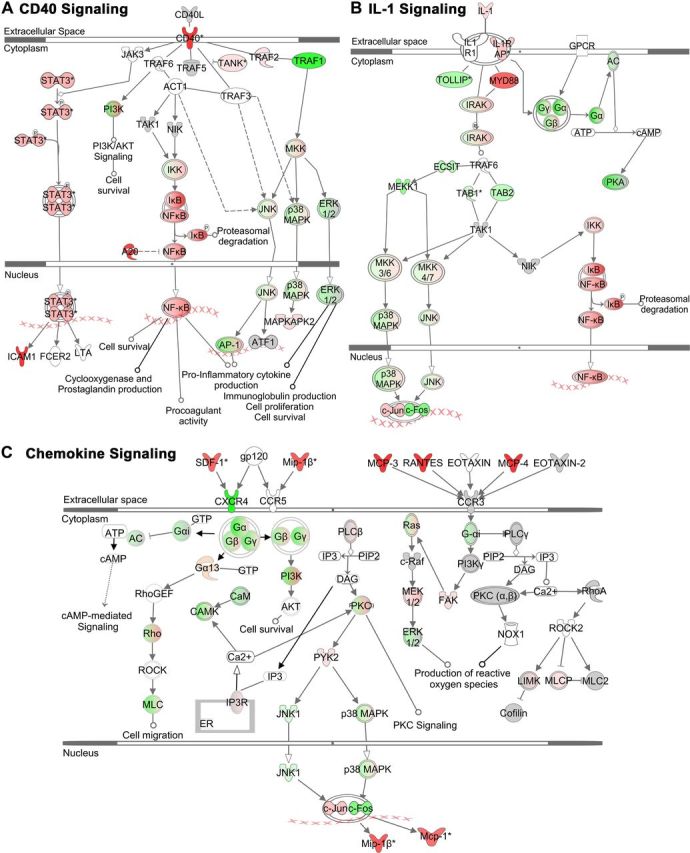
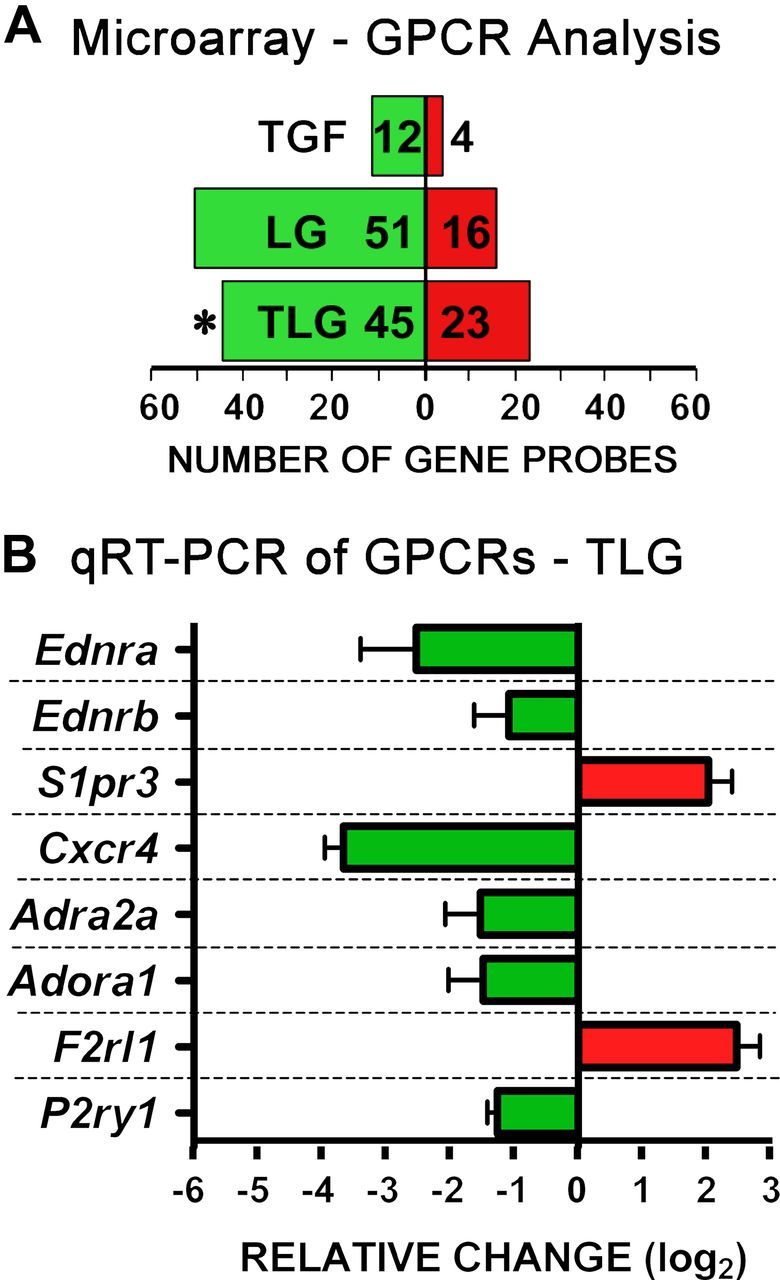
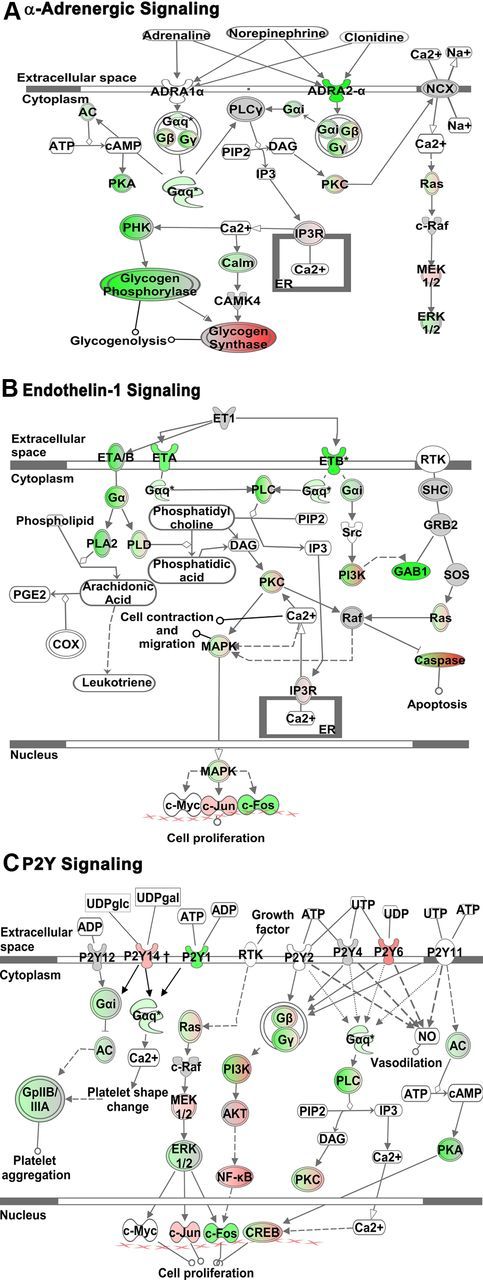
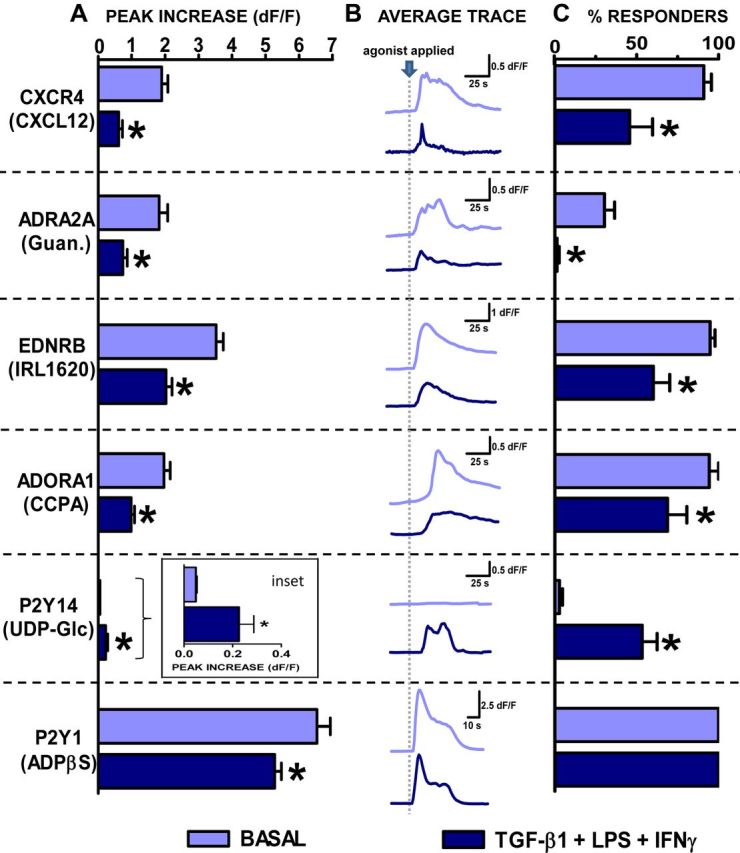
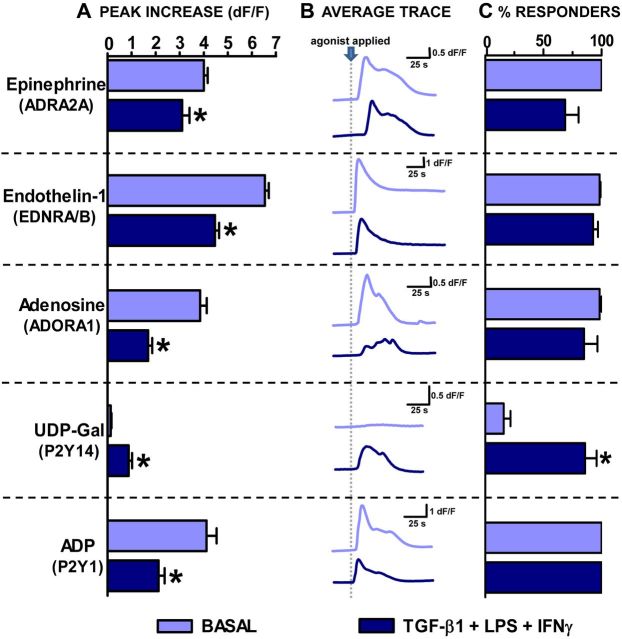
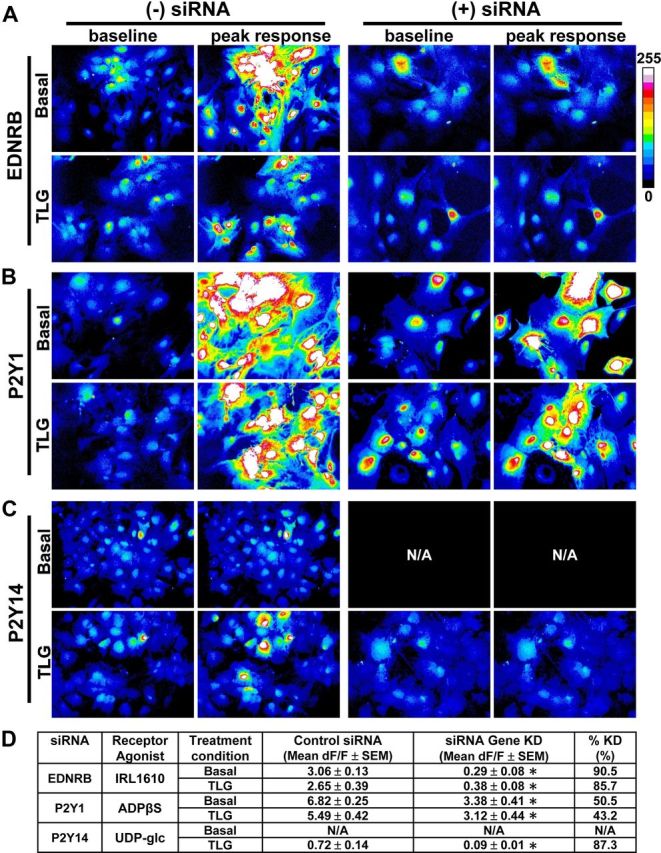
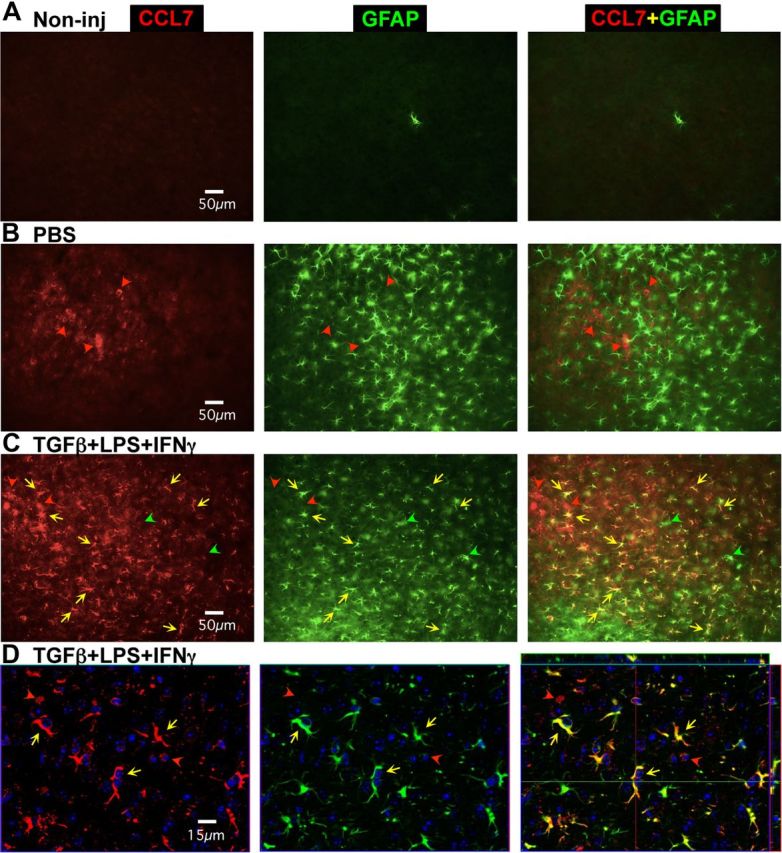
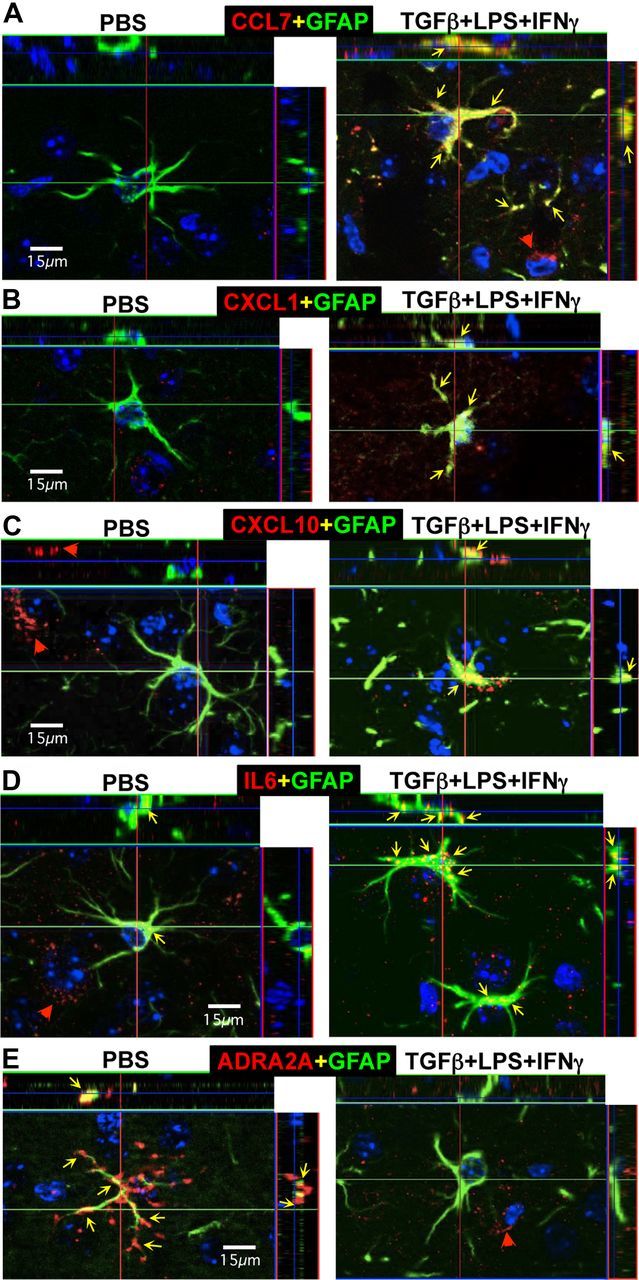
Inflammation features in CNS disorders such as stroke, trauma, neurodegeneration, infection, and autoimmunity in which astrocytes play critical roles. To elucidate how inflammatory mediators alter astrocyte functions, we examined effects of transforming growth factor-β1 (TGF-β1), lipopolysaccharide (LPS), and interferon-gamma (IFNγ), alone and in combination, on purified, mouse primary cortical astrocyte cultures. We used microarrays to conduct whole-genome expression profiling, and measured calcium signaling, which is implicated in mediating dynamic astrocyte functions. Combinatorial exposure to TGF-β1, LPS, and IFNγ significantly modulated astrocyte expression of >6800 gene probes, including >380 synergistic changes not predicted by summing individual treatment effects. Bioinformatic analyses revealed significantly and markedly upregulated molecular networks and pathways associated in particular with immune signaling and regulation of cell injury, death, growth, and proliferation. Highly regulated genes included chemokines, growth factors, enzymes, channels, transporters, and intercellular and intracellular signal transducers. Notably, numerous genes for G-protein-coupled receptors (GPCRs) and G-protein effectors involved in calcium signaling were significantly regulated, mostly down (for example, Cxcr4, Adra2a, Ednra, P2ry1, Gnao1, Gng7), but some up (for example, P2ry14, P2ry6, Ccrl2, Gnb4). We tested selected cases and found that changes in GPCR gene expression were accompanied by significant, parallel changes in astrocyte calcium signaling evoked by corresponding GPCR-specific ligands. These findings identify pronounced changes in the astrocyte transcriptome induced by TGF-β1, LPS, and IFNγ, and show that these inflammatory stimuli upregulate astrocyte molecular networks associated with immune- and injury-related functions and significantly alter astrocyte calcium signaling stimulated by multiple GPCRs.


Figures

Figure 1.
Figure 1.
Effects on astrocyte genomic profiles of treatment with TGF-β1, LPS+IFNγ, or all three stimuli combined. A, Gene array clustering of the top 1000 most variable genes shown as a colored heatmap depicting the MAD value for each interarray comparison for samples 1–4 for each treatment in astrocytes as indicated. B, basal; T, TGF-β1; LG, LPS+IFNγ; TLG, TGF-β1+LPS+IFNγ. The color map key (top left) represents a low MAD value indicating very little variability (yellow) between comparisons whereas red represents a high MAD value indicating greater differences between comparisons. Dendrogram indicates clustering of samples and treatments based on similarity. B, Heatmap indicating significant changes (FDR p value ≤ 0.05) in gene expression (black, no change; red, increase; green, decrease) due to TGF-β1 (T vs B), LPS+IFNγ (LG vs B), and TGF-β1+LPS+IFNγ (TLG vs B), compared with basal astrocytes, as well as TLG vs T and TLG versus LG. Genes are clustered by similarity. Boxed region denoted by asterisks indicates examples of genes that behaved differently across different treatment conditions. C, Total number of genes significantly (FDR p ≤ 0.05) altered (up, red; down, green) by each treatment comparison. D, Venn diagram depicts the number of genes changed in a treatment-specific and nonspecific manner. Within each segment, upper red numerical values = number of genes upregulated. Lower green numerical values = number of genes downregulated. Total numbers of genes changed are labeled outside of the Venn diagram beside its respective circle's treatment condition. E, Flow chart depicting filtering strategy conducted using statistical cutoffs to generate subsequent datasets for analysis. Numbers indicate number of probes within each filtered dataset and a–d demarcate the four new dataset categories for subsequent analysis. S, significant; NS, nonsignificant. F, Categories of additive and synergistic treatment interactions emerging from filtering strategy in E. All categories a–d had a further change from either T (c) or LG (b) or both (a, d) due to TLG treatment. Numbers of gene probes are shown indicating additive or synergistic gene regulation by TLG treatment per category. A–E, n = 4 independent samples from distinct astrocyte cultures.
Figure 2.
Figure 2.
qRT-PCR validation of microarray data. qRT-PCR was performed on untreated or treated (T, TGF-β1; LG, LPS+IFNγ; TLG, TGF-β1+LPS+IFNγ) primary mouse astrocytes. Fold change in mRNA expression was calculated relative to basal after normalization of expression to GAPDH. Data were expressed as mean relative fold change in mRNA ± SEM (n = 3 from samples independently generated from that in Fig. 1). *, Indicates a significant fold increase compared with basal, whereas # indicates a significant difference in TLG-treated astrocytes compared with LG (p ≤ 0.05) as assessed via repeated-measures ANOVA after normalizing data followed by Newman–Keuls multiple-comparison test. Significantly altered (FDR ≤ 0.05) microarray log2 ratios are provided below treatment-labeled bars.
Figure 3.
Figure 3.
Top three networks of significantly associated molecules in TGF-β1+LPS+IFNγ-treated astrocytes. A–C, Schematic diagrams of the top three predesignated Associated Molecular Networks identified using Ingenuity Pathway Analysis software (IPA; Ingenuity) as being affected by TGF-β1+LPS+IFNγ treatment of astrocytes. As defined in Table 3, the top three networks are Antigen Presentation and Cell Death (A); Cell Morphology, Cellular Compromise, and DNA Replication, Recombination, and Repair (B); and Genetic Disorder and Neurological Disease (C). Molecules are indicated by standard abbreviations. Molecular categories are indicated by icons defined in the icon key. Relative changes in gene expression are depicted by gradated shades of color coding: red, up; green, down. Direct and indirect interactions between molecules are depicted by solid and dotted lines, respectively.
Figure 4.
Figure 4.
Three IPA Canonical Signaling Pathways: CD40, IL-1, and Chemokine Signaling in TGF-β1+LPS+IFNγ-treated astrocytes. A–C, Schematic diagrams of three of the top significantly altered predesignated Canonical Signaling identified using Ingenuity Pathway Analysis software (IPA; Ingenuity) as being affected by TGF-β1+LPS+IFNγ-treatment of astrocytes. As selected from Table 5, these pathways are CD40 Signaling (A), IL-1 Signaling (B), and Chemokine Signaling (C). Molecules are indicated by standard abbreviations. Relative changes in gene expression are depicted by gradated shades of color coding: red, up; green, down; white, no change or not applicable. Direct and indirect interactions between molecules are depicted by solid and dotted lines, respectively.
Figure 5.
Figure 5.
Genome-wide analysis of differentially expressed genes encoding GPCRs and qRT-PCR validation. A, All genes designated to encode GPCRs according to the IUPHAR database were cross-referenced with our microarray dataset (Fig. 1, n = 4 from Fig. 1) and total number of gene probes showing differential expression after treatment of astrocytes with T, LG, or TLG versus B was calculated. *, A significant skew in genes differentially expressed, down versus up (p ≤ 0.05 Fisher's exact test). B, basal; T, TGF-β1; LG, LPS+IFNγ; TLG, TGF-β1+LPS+ IFNγ. B, qRT-PCR validation of a cross section of differentially expressed genes encoding GPCRs in astrocytes exposed to TLG. Data are expressed as mean fold change (log2) relative to basal + SEM (n = 3 from 3 independently generated samples from those used for gene arrays).
Figure 6.
Figure 6.
GPCR Canonical Signaling Pathways. A–C, Schematic diagrams of three significantly altered GPCR Canonical Signaling Pathways identified using Ingenuity Pathway Analysis software (IPA; Ingenuity) as being affected by TGF-β1+LPS+IFNγ-treatment of astrocytes. As selected from Table 7, these pathways are α-Adrenergic Signaling (A), Endothelin-1 Signaling (B), and P2Y Signaling (C). Molecules are indicated by standard abbreviations. Relative changes in gene expression are depicted by gradated shades of color coding: red, up; green, down; white, no change. Direct and indirect interactions between molecules are depicted by solid and dotted lines, respectively.
Figure 7.
Figure 7.
Calcium responses elicited by selective GPCR agonists in untreated and TGF-β1+LPS+IFNγ-treated astrocytes. Untreated and TGF-β1+LPS+IFNγ (TLG)-treated astrocytes were bulk loaded with the calcium indicator dye Fluo-4 and imaged before, during (30 s), and after application of agonists selective for specific GPCRs as indicated: left, CXCL12, 30 ng/ml; guanfacine HCl (Guan.), 10 μm; IRL1620, 100 nm; CCPA, 100 nm; UDP-Glc, 100 μm; and ADPβS, 10 μm. Data are represented as (A) mean peak increase in intracellular calcium levels ([Ca2+]i) (dF/F) + SEM, (B) average trace depicting [Ca2+]i (dF/F) over time (s), and (C) mean percentage cells responding + SEM. Significance (p ≤ 0.05) was assessed via (A) Mann–Whitney test or (C) unpaired t test following normalization of data. *, Indicates significantly different from untreated (basal) control. (CXCL12, n = 86–107 cells from 3 experiments; guanfacine HCl, n = 78–93 from 4 experiments; IRL1620, n = 115–146 from 3–5 experiments; CCPA, n = 83–89 from 4 experiments; UDP-Glc, n = 44–47 from 3 experiments; ADPβS, n = 67–94 from 3 experiments.)
Figure 8.
Figure 8.
Calcium responses elicited by endogenous GPCR agonists in untreated and TGF-β1+LPS+IFNγ-treated astrocytes. Untreated and TGF-β1+LPS+IFNγ (TLG)-treated astrocytes were bulk loaded with the calcium indicator dye Fluo-4 and imaged before, during (30 s), and after application of agonists (epinephrine, 100 ng/ml; endothelin-1, 100 nm; adenosine, 1 μm; UDP-Gal, 300 μm; ADP, 1 μm) as indicated (left column). Data are represented as (A) mean peak increase in intracellular calcium levels [Ca2+]i (dF/F) + SEM, (B) average trace depicting [Ca2+]i (dF/F) over time (s), and (C) Mean percentage cells responding + SEM. Significance (p ≤ 0.05) was assessed via (A) Mann–Whitney test or (C) unpaired t test following normalization of data. *, Indicates significantly different from untreated (basal) control. (Epinephrine, n = 66–85 cells from 3 experiments; endothelin-1, n = 130–133 from 3 experiments; adenosine, n = 64 from 3 experiments; UDP-Gal, n = 40–47 from 3 experiments; ADP, n = 33–35 from 3–4 experiments.)
Figure 9.
Figure 9.
Representative images of peak responses to GPCR receptor-selective agonists with or without receptor-specific siRNA knockdown. Normal nontransfected [(−) siRNA], negative control siRNA-transfected or Ednrb-, P2ry1-, or P2ry14-siRNA transfected [(+) siRNA] astrocytes were exposed to medium alone (basal) or TGF-β1+LPS+IFNγ (TLG). From 22–30 hours following administration of control medium or that containing TLG, astrocytes were bulk loaded with the calcium indicator dye Fluo-4 and imaged before, during (30 s), and after application of receptor-selective agonists: EDNRB (A), 100 nm IRL1620, P2Y1 (B), 10 μm ADPβS, P2Y14 (C), and UDP-Glc, 300 μm. Shown are representative images for baseline and the peak increase in [Ca2+]i (dF intensity), as indicated, in response to the agonist application for both basal and TLG-treated cells with and without siRNA. Each image is representative of at least three experiments. Note: Given that UDP-Glc did not elicit a response in basal astrocytes, siRNA knockdown for P2y14 in basal astrocytes was not performed as indicated via N/A. D, Quantification of functional knockdown (KD) of agonist-triggered response (i.e., KD of measured increase in [Ca2+]i) (from A–C). Results are presented as mean dF/F ± for each treatment condition and as percentage KD. *, Indicates a significant KD compared with respective control siRNA, as assessed by Mann–Whitney test (p ≤ 0.05).
Figure 10.
Figure 10.
Changes in expression of GFAP and CCL7 induced in vivo by injection of PBS or TGFβ+LPS+IFNγ into cerebral cortex. A–D, Single channel and merged two-color fluorescence survey (A–C) and detail (D) images of immunohistochemical staining for CCL7 (red) and GFAP (green) in mid-layers (3–5) of cerebral cortex of wild-type mice that were either noninjected (A) or injected with PBS (B) or TGFβ+LPS+IFNγ 5 d previously (C, D). D, Nuclei are counterstained with DAPI (blue) and the images were obtained using confocal microscopy. A, In noninjected cortex, CCL7 is not detectably expressed by any cells and GFAP is detectable in only one astrocyte in this frame. B, In PBS-injected cortex, CCL7 is expressed by a few cells that do not express GFAP (red arrowheads), whereas GFAP is detectable in many reactive astrocytes in the immediate vicinity of the injection site. C, D, In TGFβ+LPS+IFNγ-injected cortex, CCL7 is expressed both by cells that do not express GFAP (red arrowheads) as well as by many GFAP-expressing reactive astrocytes (yellow arrows). Some GFAP-expressing reactive astrocytes express little or no detectable CCL7 (green arrowheads).
Figure 11.
Figure 11.
Changes in expression of CCL7, CXCL1, CXCL10, IL-6, and ADRA2A induced in vivo in GFAP-expressing reactive astrocytes by injection of TGFβ+LPS+IFNγ into cerebral cortex. A–E, Multicolor, fluorescence, and confocal microscopic images of immunohistochemical staining for CCL7, CXCL1, CXCL10, IL-6, or ADRA2A (red), in combination with GFAP (green) and the nuclear stain, DAPI (blue), in mid-layers (3–5) of cerebral cortex of wild-type mice injected with PBS or TGFβ+LPS+IFNγ 1 d previously. Red arrowheads denote cells that express only CCL7, CXCL1, CXCL10, IL-6, or ADRA2A and do not express GFAP. Yellow arrows denote sties of coexpression of CCL7, CXCL1, CXCL10, IL-6, or ADRA2A within reactive astrocytes that also express GFAP. Note that after injection of PBS, GFAP-expressing reactive astrocytes do not express detectable levels of CCL7 (A), CXCL1 (B), and CXCL10 (C), whereas some reactive astrocytes do express small amounts of IL-6 (D) and some robustly express ADRA2A (E). After injection of TGFβ+LPS+IFNγ, many reactive astrocytes express detectable levels of CCL7 (A), CXCL1 (B), and CXCL10 (C), and upregulate expression of IL-6 (D) and markedly downregulate expression of ADRA2A (E).

References

    1. Abbracchio MP, Boeynaems JM, Barnard EA, Boyer JL, Kennedy C, Miras-Portugal MT, King BF, Gachet C, Jacobson KA, Weisman GA, Burnstock G. Characterization of the UDP-glucose receptor (re-named here the P2Y14 receptor) adds diversity to the P2Y receptor family. Trends Pharmacol Sci. 2003;24:52–55. - PMC - PubMed
    1. Ata AK, Funa K, Olsson Y. Expression of various TGF-beta isoforms and type I receptor in necrotizing human brain lesions. Acta Neuropathol. 1997;93:326–333. - PubMed
    1. Attwell D, Buchan AM, Charpak S, Lauritzen M, Macvicar BA, Newman EA. Glial and neuronal control of brain blood flow. Nature. 2010;468:232–243. - PMC - PubMed
    1. Barres BA. The mystery and magic of glia: a perspective on their roles in health and disease. Neuron. 2008;60:430–440. - PubMed
    1. Brambilla R, Bracchi-Ricard V, Hu WH, Frydel B, Bramwell A, Karmally S, Green EJ, Bethea JR. Inhibition of astroglial nuclear factor kappaB reduces inflammation and improves functional recovery after spinal cord injury. J Exp Med. 2005;202:145–156. - PMC - PubMed

Publication types

MeSH terms