. 2012 Oct 17;32(42):14752-66.
doi: 10.1523/JNEUROSCI.6175-11.2012.

Hippocampal place cells can encode multiple trial-dependent features through rate remapping

Affiliations

Hippocampal place cells can encode multiple trial-dependent features through rate remapping

Kevin Allen et al. J Neurosci. .

Abstract

The activity of hippocampal pyramidal cells reflects both the current position of the animal and information related to its current behavior. Here we investigated whether single hippocampal neurons can encode several independent features defining trials during a memory task. We also tested whether task-related information is represented by partial remapping of the place cell population or, instead, via firing rate modulation of spatially stable place cells. To address these two questions, the activity of hippocampal neurons was recorded in rats performing a conditional discrimination task on a modified T-maze in which the identity of a food reward guided behavior. When the rat was on the central arm of the maze, the firing rate of pyramidal cells changed depending on two independent factors: (1) the identity of the food reward given to the animal and (2) the previous location of the animal on the maze. Importantly, some pyramidal cells encoded information relative to both factors. This trial-type specific and retrospective coding did not interfere with the spatial representation of the maze: hippocampal cells had stable place fields and their theta-phase precession profiles were unaltered during the task, indicating that trial-related information was encoded via rate remapping. During error trials, encoding of both trial-related information and spatial location was impaired. Finally, we found that pyramidal cells also encode trial-related information via rate remapping during the continuous version of the rewarded alternation task without delays. These results suggest that hippocampal neurons can encode several task-related cognitive aspects via rate remapping.


Figures

Figure 1.
Figure 1.
Food-location conditional discrimination task. A, Schematic of the modified T-maze. The location of each inverted guillotine door used in the experiment is indicated by a dotted line. Gray circles represent the food wells. The two dotted rectangles correspond to the zones used for the analysis at the food well of the central arm (CCZ) and on the middle portion of the central arm (MCAZ). The two colored arrows indicate the correct response to perform for a rat on trials in which chocolate (Ch; red arrow) or sweet corn (Sc; blue arrow) was given as a reward on the central arm of the maze. B, Acquisition of the conditional discrimination task by three rats. Chance level is indicated by a dotted line. The recording began at the end of each learning curve, as indicated by the arrows. C, Number of trials and performance during the recording sessions used for electrophysiological analysis. Each band of the graph represents a recording session.
Figure 2.
Figure 2.
Place rate maps of pyramidal cells during a conditional discrimination task. A, Examples of place rate maps from eight pyramidal cells recorded simultaneously on the modified T-maze. The number above each map is the peak firing rate of the cell. B, Stable firing fields during the conditional discrimination task. The density plot shows the mean within-field firing rate (normalized) for blocks of four trials. Only fields located on the central arm were included. Block 0 represents the first four trials of the recording sessions. The black line indicates the mean location of the peak firing rates for each block of trials (±SEM). C, Same as B but for firing fields located on the return arms of the maze.
Figure 3.
Figure 3.
Effects of trial type and previous location in the CCZ. A, Raster plot of a pyramidal cells showing the spikes emitted while the rat was in the CCZ. The trials were sorted according to the two conditions (trial type and previous location). Within these conditions, the trials were sorted according to the time the rat spent in the CCZ. The bars representing the spikes are color-coded according to the trial type of each trial. The dotted line indicates the time at which the animal left the CCZ on each trial. B, The firing rate of four pyramidal cells that fired differently depending on the two types of food (trial type) in the CCZ. The time in the CCZ on each trial was divided in four equal time windows. For each cell, the mean time in the CCZ for trials of the two conditions is shown. C, Cumulative distributions of the F values obtained for the effect of trial type during the recording sessions (Trial type) and those obtained after shuffling the identity of the trials (Shuffled data). The dotted line indicates the 95% confidence intervals, which were calculated during the shuffling procedure (see Materials and Methods). Larger F values were seen in the recording sessions as compared with what would be obtained by chance. D, Previous location modulates firing rate. Raster plot of the spikes from a pyramidal cell in the CCZ. The bars representing the spikes are color-coded according to the previous location of the animal on each trial. E, Four cells showing a significant effect of the previous location of the animal on the firing rate when the rat was in the CCZ. For each cell, the mean time in the CCZ for trials of the two conditions is shown. F, Cumulative distributions of F values as shown in C but now for the effect of the previous location. G, Conjunctive effects of trial type and previous location. Raster plot showing the spikes of a cell on trials sorted according to the trial type and the previous location. H, Four cells showing significant changes in firing rate related to both the trial type and the previous location of the animal. For each cell, the mean time in the CCZ for trials of the four conditions is shown. I, Proportion of the pyramidal cells with a significant effect of trial type, previous location, or both (conjunctive), on their firing rate in the CCZ.
Figure 4.
Figure 4.
Effect of the trial type and previous location when the rat is in the MCAZ. A, Trial type modulation of firing rate. Examples of two pyramidal cells showing significant changes in the firing rate depending on the trial type. The density plots show place rate maps of the cells in the MCAZ for the two trial types (S, sweet corn; C, chocolate). The number above each density plot is the peak firing rate of the cell in the MCAZ. The graphs show the mean firing rate (±SEM) of the same cells in a linear representation of the MCAZ. B, Cumulative distributions of the F values obtained for the effect of trial type during recording sessions and those obtained after shuffling the identity of the trials (Shuffled data). C, The previous location of the animal affects firing rate in the MCAZ. The place rate maps of two pyramidal cells affected by the previous location of the animal (L, left; R, right) are shown. D, Cumulative distributions of the F values obtained for the effect of previous location during recording sessions and those obtained after shuffling the identity of the trials. E, Four cells affected by both the trial type and the previous location of the animal. The firing rate of the cells is shown for the four possible combinations of trials (C-L: chocolate, right; C-R: chocolate, right; S-L: sweet corn, left; S-R: sweet corn, right). F, Proportion of the pyramidal cells with a significant effect of trial type, previous location, or both (conjunctive), on the firing rate of the cells in the MCAZ.
Figure 5.
Figure 5.
Different network states characterized periods in the CCZ and the MCAZ. A, Power spectra performed on 500 ms epochs with different theta/delta ratios. A clear theta peak is observed for epochs with a theta/delta ratio larger than 1.5. B, Distribution of theta/delta ratios during the recording sessions. Approximately 60% of the recording sessions were considered as theta epochs when using a theta/delta ratio of 1.5 as detection threshold. C, Representation of the maze, the conditional cue zone (red dotted rectangle), and the middle central arm zone (black dotted rectangle). D, Power spectra for the time periods in which the rat was in the CCZ or the MCAZ. E, Mean theta/delta ratio when the rat was in the CCZ or the MCAZ. F, Mean theta vector length for the spikes of pyramidal cells (Pyr.) and interneurons (Int.) when the rat was in the CCZ or the MCAZ. G, Probability of firing at different theta phase for pyramidal cells and interneurons in the CCZ and the MCAZ. H, Spike-time autocorrelation for pyramidal cells and interneurons in the CCZ and the MCAZ. *p < 0.01.
Figure 6.
Figure 6.
Effect of trial type and previous location on spatial coding in the MCAZ. A, Cumulative distribution of the place field similarity as expressed by the correlation coefficients between the place rate maps of the MCAZ for the two types of trials (top) or the different previous locations (bottom). The distributions were not significantly different from these obtained after shuffling the trial identity. B, Place-theta phase relationship for cells showing a significant effect of Trial-Type, Previous-Location, or an interaction of these two factors. When significant interactions were detected, conditions with the highest and lowest firing rate were considered. B1, Top, Mean linear firing rate maps within the place field for conditions associated with high firing rate (high rate trials) and low rate (low rate trials). Bottom, Mean place-phase maps showing theta phase precession. Theta phase precession was observed in both conditions. B2, Mean phase of the spikes for six equal sections of the place fields for different conditions. B3, Mean circular-linear correlation between theta phase and location for spikes during trials with high and low firing rate. C, Example of reconstruction of the position of the rat on two different trials. D, Reconstruction of the position in the MCAZ from one recording session. The predicted position was strongly correlated to the recorded location of the animal. This relationship was similar for reconstruction made with trials of the same or different type. E, Effect of the trial type or the previous location on the position reconstruction error in the MCAZ. The median was obtained from each recording session and the mean across the sessions was calculated. There was no difference between reconstructions made with trials of the same or different trial types or previous location. F, Simulation performed in which the firing fields of different proportions of place cells were randomly moved within the MCAZ. Reconstruction error significantly increased when only 10% of the firing fields moved (p < 0.015), suggesting that the reconstruction method would be sensitive to a displacement of few firing fields across the different task conditions.
Figure 7.
Figure 7.
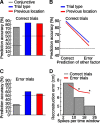
Prediction of the trial type, previous location, and current position based on cell activity during correct and error trials. A, Prediction accuracy for the trial type and previous location using the firing rate of a group of cells during correct trials. Prediction of conjunctive information means that both the trial type and the previous location were predicted successfully. Chance levels are indicated with dotted lines. The prediction accuracy was significantly above chance levels. B, The prediction accuracy for the two factors on correct trials covaried. The prediction accuracy for one factor was above chance level only on trials where the other factor could be predicted successfully. C, The prediction for the trial type and the previous location on the error trials. Prediction accuracy on error trials was not significantly different from chance levels. D, Reconstruction of the animal position on correct and error trials for reconstruction time windows with different number of spikes. The spatial reconstruction was significantly impaired on error trials only when >10 spikes were recorded during the reconstruction time window. *p < 0.01.
Figure 8.
Figure 8.
Trial-related changes in firing rate during rewarded alternation without delays. A, Schematic of the continuous version of the rewarded alternation task without delays on the modified T-maze. The location of each inverted guillotine door used in the experiment is indicated by a dotted line. Gray circles represent the food wells. The dotted rectangle corresponds to the zone used for the analysis on the central arm. The two colored arrows indicate the two trial types (left-to-right in blue and right-to-left in red). B, Number of trials and performance during the recording sessions used for electrophysiological analysis. Each band of the graph represents a recording session. C, Examples of four pyramidal cells showing significant changes in the firing rate depending on the trial type. The density plots show place rate maps of the cells on the central arm for the two trial types (L-R, left-to-right; R-L, right-to-left). The number above each density plot is the peak firing rate of the cell. The graphs show the mean firing rate (±SEM) of the same cells in a linear representation of the central arm. D, Cumulative distribution of the F values obtained for the effect of trial type during recording sessions and that obtained after shuffling the identity of the trials. E, Cumulative distribution of the place field similarity, expressed as the correlation coefficients between the place rate maps of the central arm of the maze for the two types of trials. The distribution was not significantly different from that obtained after shuffling the trial identity. F, Reconstruction of the position on the central arm of the maze from one recording session. The predicted position was strongly correlated to the recorded location of the rat. G, Effect of the trial type (left-to-right and right-to-left) on the position reconstruction error. The median was obtained from each recording session and the mean across the sessions was calculated. There was no difference between reconstructions made with trials of the same or different (Diff.) trial types. H, Simulation in which the firing fields of different proportions of place cells were randomly moved within the central arm zone.

References

    1. Ainge JA, Tamosiunaite M, Woergoetter F, Dudchenko PA. Hippocampal CA1 place cells encode intended destination on a maze with multiple choice points. J Neurosci. 2007a;27:9769–9779. - PMC - PubMed
    1. Ainge JA, van der Meer MA, Langston RF, Wood ER. Exploring the role of context-dependent hippocampal activity in spatial alternation behavior. Hippocampus. 2007b;17:988–1002. - PubMed
    1. Ainge JA, Tamosiunaite M, Wörgötter F, Dudchenko PA. Hippocampal place cells encode intended destination, and not a discriminative stimulus, in a conditional T-maze task. Hippocampus. 2012;22:534–543. - PubMed
    1. Bahar AS, Shirvalkar PR, Shapiro ML. Memory-guided learning: CA1 and CA3 neuronal ensembles differentially encode the commonalities and differences between situations. J Neurosci. 2011;31:12270–12281. - PMC - PubMed
    1. Bower MR, Euston DR, McNaughton BL. Sequential-context-dependent hippocampal activity is not necessary to learn sequences with repeated elements. J Neurosci. 2005;25:1313–1323. - PMC - PubMed

Publication types