

Neighborhood determinants of 2009 pandemic A/H1N1 influenza vaccination in Montreal, Quebec, Canada
- PMID: 23077284
- PMCID: PMC3662406
- DOI: 10.1093/aje/kws154
Neighborhood determinants of 2009 pandemic A/H1N1 influenza vaccination in Montreal, Quebec, Canada
Abstract
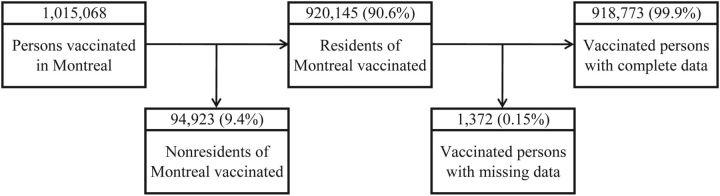
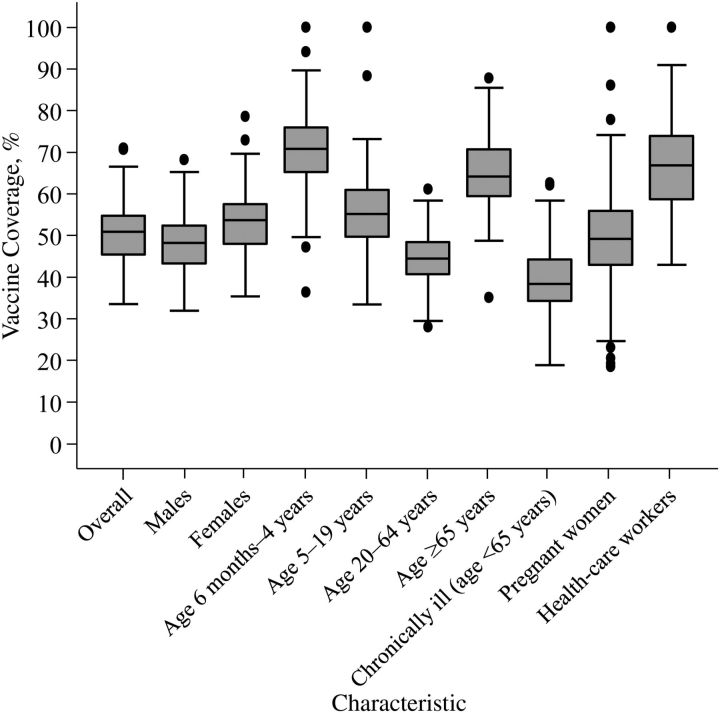
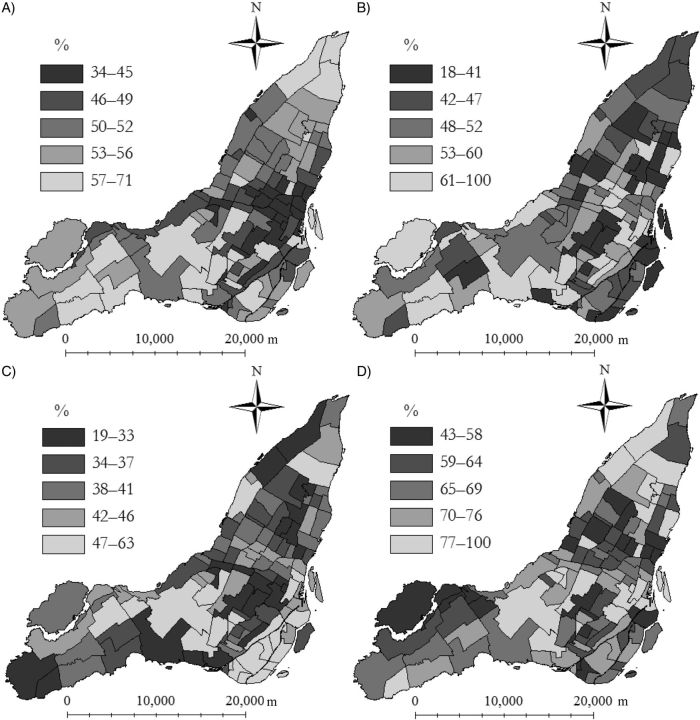
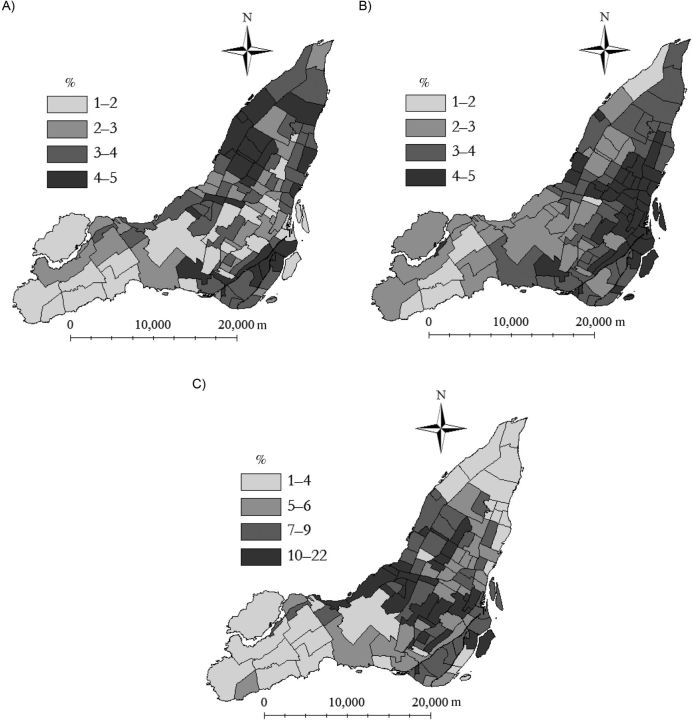
Neighborhood-level analyses of influenza vaccination can identify the characteristics of vulnerable neighborhoods, which can inform public health strategy for future pandemics. In this study, the authors analyzed rates of 2009 pandemic A/H1N1 influenza vaccination in Montreal, Quebec, Canada, using individual-level vaccination records from a vaccination registry with census, survey, and administrative data to estimate the population at risk. The neighborhood socioeconomic and demographic determinants of vaccination were identified using Bayesian ecologic logistic regression, with random effects to account for spatial autocorrelation. A total of 918,773 (49.9%) Montreal residents were vaccinated against pandemic A/H1N1 influenza from October 22, 2009, through April 8, 2010. Coverage was greatest among females, children under age 5 years, and health-care workers. Neighborhood vaccine coverage ranged from 33.6% to 71.0%. Neighborhoods with high percentages of immigrants (per 5% increase, odds ratio = 0.90, 95% credible interval: 0.86, 0.95) and material deprivation (per 1-unit increase in deprivation score, odds ratio = 0.93, 95% credible interval: 0.88, 0.98) had lower vaccine coverage. Half of the Montreal population was vaccinated; however, considerable heterogeneity in coverage was observed between neighborhoods and subgroups. In future vaccination campaigns, neighborhoods that are materially deprived or have high percentages of immigrants may benefit from focused interventions.
Figures
References
-
- Communicable Diseases Department. Chronology of Influenza A (H1N1) New Delhi, India: World Health Organization Regional Office for South-East Asia; 2009. World Health Organization Regional Office for South-East Asia. (www.searo.who.int/.../Influenza_A(H1N1)_Chronology_of_Influenza_A(H1N1).pdf. ). (Accessed November 26, 2011)
-
- World Health Organization. World Now at the Start of 2009 Influenza Pandemic. Geneva, Switzerland: World Health Organization; 2009. (http://www.who.int/mediacentre/news/statements/2009/h1n1_pandemic_phase6.... ). (Accessed July 4, 2011)
-
- Canadian Broadcasting Corporation. 1 Confirmed Case of Swine Flu in Quebec. Montreal. Quebec, Canada: Canadian Broadcasting Corporation; 2009. (http://www.cbc.ca/canada/montreal/story/2009/04/30/montreal-swine-quebec.... ). (Accessed July 4, 2011)
-
- Pandémie Québec, Gouvernement du Québec. Statistiques descriptives de la grippe pandémique A(H1N1). Québec, Québec. Canada: Pandémie Québec; 2009. (http://www.msss.gouv.qc.ca/extranet/pandemie/etat_situation/ ). (Accessed July 4, 2011)
-
- Bone A, Guthmann JP, Nicolau J, et al. Population and risk group uptake of H1N1 influenza vaccine in mainland France 2009–2010: results of a national vaccination campaign. Vaccine. 2010;28(51):8157–8161. - PubMed
Publication types
MeSH terms
Substances
Grants and funding
LinkOut - more resources
Full Text Sources
Medical
Miscellaneous
