Phylodynamics and dispersal of HRSV entails its permanence in the general population in between yearly outbreaks in children
- PMID: 23077477
- PMCID: PMC3471929
- DOI: 10.1371/journal.pone.0041953
Phylodynamics and dispersal of HRSV entails its permanence in the general population in between yearly outbreaks in children
Abstract
Background: Human respiratory syncytial virus (HRSV) is one of the major etiologic agents of respiratory tract infections among children worldwide.
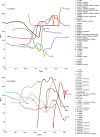
Methodology/principal findings: Here through a comprehensive analysis of the two major HRSV groups A and B (n=1983) which comprise of several genotypes, we present a complex pattern of population dynamics of HRSV over a time period of 50 years (1956-2006). Circulation pattern of HRSV revealed a series of expansions and fluctuations of co-circulating lineages with a predominance of HRSVA. Positively selected amino acid substitutions of the G glycoprotein occurred upon population growth of GB3 with a 60-nucleotide insertion (GB3 Insert), while other genotypes acquired substitutions upon both population growth and decrease, thus possibly reflecting a role for immune selected epitopes in linkage to the traced substitution sites that may have important relevance for vaccine design. Analysis evidenced the co-circulation and predominance of distinct HRSV genotypes in Brazil and suggested a year-round presence of the virus. In Brazil, GA2 and GA5 were the main culprits of HRSV outbreaks until recently, when the GB3 Insert became highly prevalent. Using Bayesian methods, we determined the dispersal patterns of genotypes through several inferred migratory routes.
Conclusions/significance: Genotypes spread across continents and between neighboring areas. Crucially, genotypes also remained at any given region for extended periods, independent of seasonal outbreaks possibly maintained by re-infecting the general population.
Conflict of interest statement
Figures


References
-
- Dowell SF, Anderson LJ, Gary HE Jr, Erdman DD, Plouffe JF, et al. (1996) Respiratory syncytial virus is an important cause of community-acquired lower respiratory infection among hospitalized adults. The Journal of infectious diseases 174: 456–462. - PubMed
-
- Falsey AR (2005) Respiratory syncytial virus infection in elderly and high-risk adults. Experimental lung research 31 Suppl 1: 77. - PubMed
-
- Raboni SM, Nogueira MB, Tsuchiya LR, Takahashi GA, Pereira LA, et al. (2003) Respiratory tract viral infections in bone marrow transplant patients. Transplantation 76: 142–146. - PubMed
-
- Stensballe LG, Devasundaram JK, Simoes EA (2003) Respiratory syncytial virus epidemics: the ups and downs of a seasonal virus. The Pediatric infectious disease journal 22: S21–32. - PubMed
Publication types
MeSH terms
LinkOut - more resources
Full Text Sources
Medical

