

DCM-related tropomyosin mutants E40K/E54K over-inhibit the actomyosin interaction and lead to a decrease in the number of cycling cross-bridges
- PMID: 23077624
- PMCID: PMC3471818
- DOI: 10.1371/journal.pone.0047471
DCM-related tropomyosin mutants E40K/E54K over-inhibit the actomyosin interaction and lead to a decrease in the number of cycling cross-bridges
Abstract
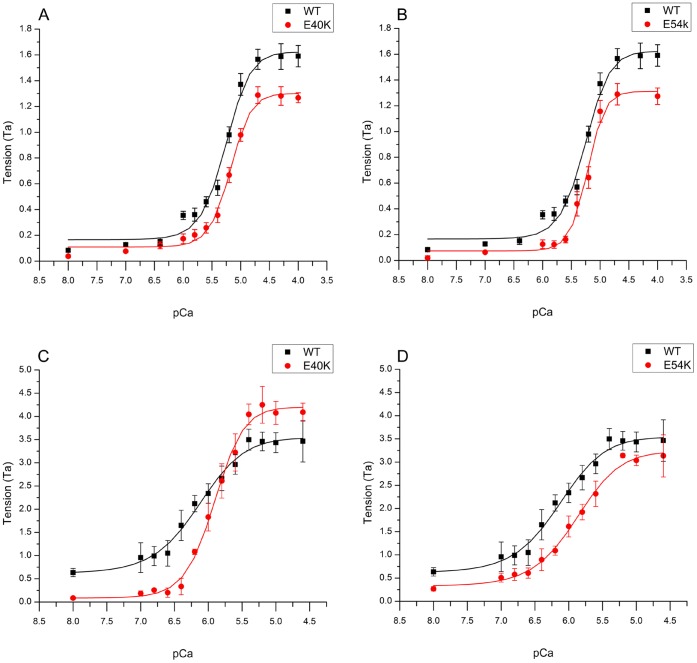
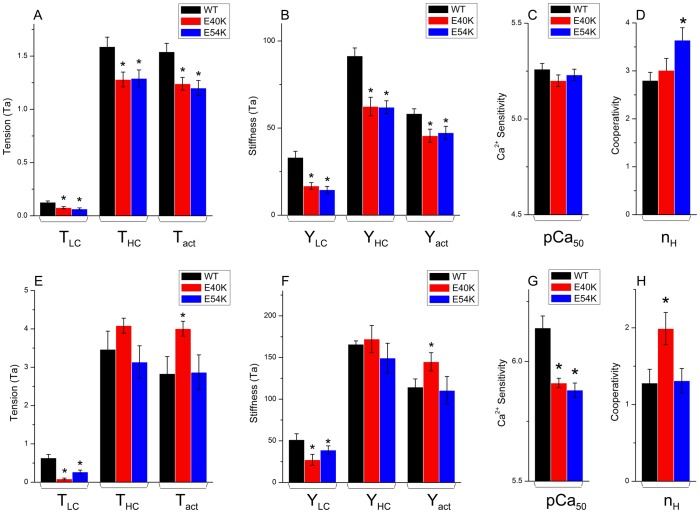
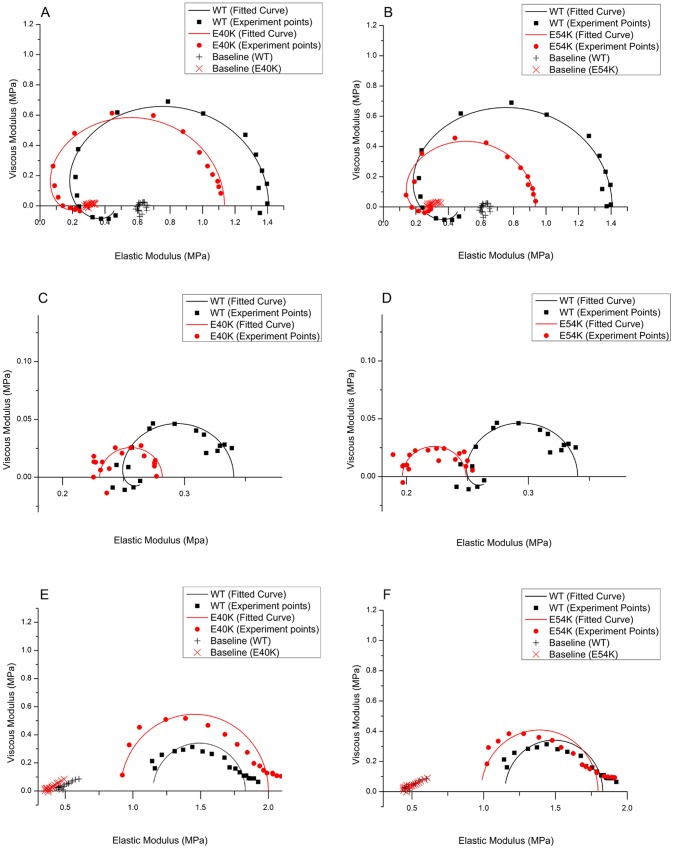
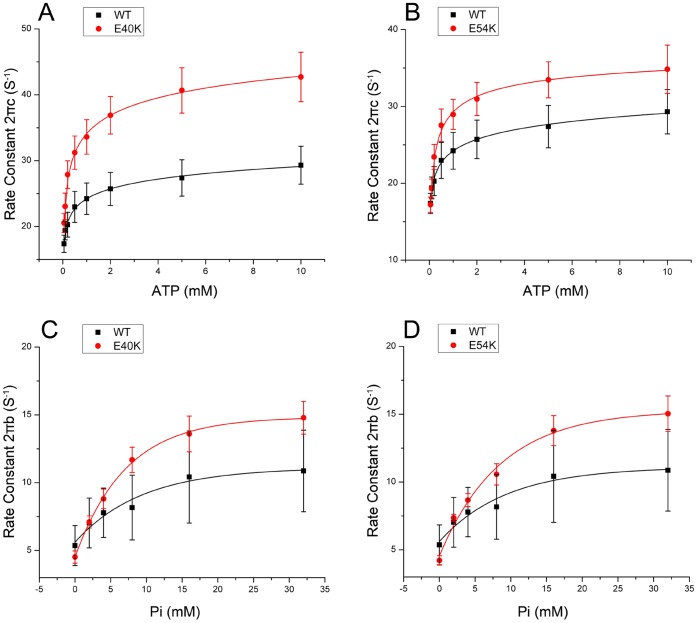
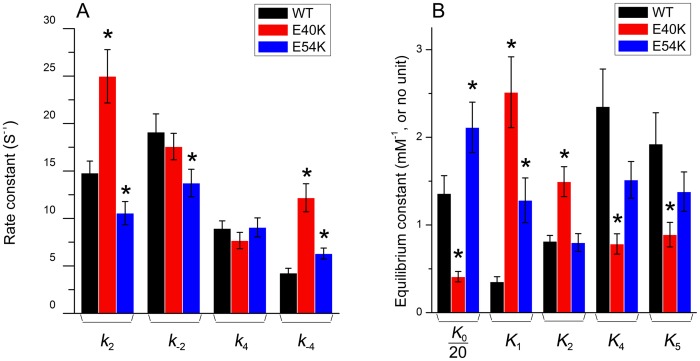
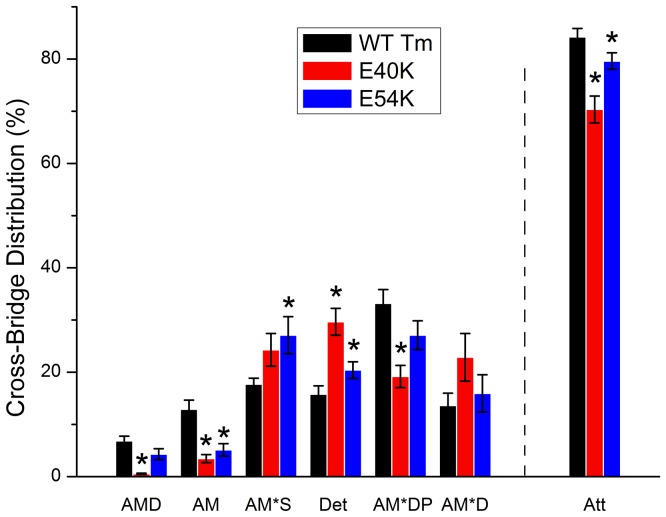
Two DCM mutants (E40K and E54K) of tropomyosin (Tm) were examined using the thin-filament extraction/reconstitu-tion technique. The effects of the Ca²⁺, ATP, phos-phate (Pi), and ADP concentrations on isometric tension and its transients were studied at 25°C, and the results were com-pared to those for the WT protein. Our results indicate that both E40K and E54K have a significantly lower T(HC) (high Ca²⁺ ten-sion at pCa 4.66) (E40K: 1.21±0.06 T(a), ±SEM, N = 34; E54K: 1.24±0.07 T(a), N = 28), a significantly lower T(LC) (low- Ca²⁺ tension at pCa 7.0) (E40K: 0.07±0.02 T(a), N = 34; E54K: 0.06±0.02 T(a), N = 28), and a significantly lower T(act) (Ca²⁺ activatable tension) (T(act) = T(HC)-T(LC,) E40K: 1.15±0.08 T(a), N = 34; E54K: 1.18±0.06 T(a), N = 28) than WT (T(HC) = 1.53±0.07 T(a), T(LC) = 0.12±0.01 T(a), T(act) = 1.40±0.07 T(a), N = 25). All tensions were normalized to T(a) ( = 13.9±0.8 kPa, N = 57), the ten-sion of actin-filament reconstituted cardiac fibers (myocardium) under the standard activating conditions. The Ca²⁺ sensitivity (pCa₅₀) of E40K (5.23±0.02, N = 34) and E54K (5.24±0.03, N = 28) was similar to that of the WT protein (5.26±0.03, N = 25). The cooper-a-tivity increased significantly in E54K (3.73±0.25, N = 28) compared to WT (2.80±0.17, N = 25). Seven kinetic constants were deduced using sinusoidal analysis at pCa 4.66. These results enabled us to calculate the cross-bridge distribution in the strongly attached states, and thereby deduce the force/cross-bridge. The results indicate that the force/cross-bridge is ∼15% less in E54K than WT, but remains similar to that of the WT protein in the case of E40K. We conclude that over-inhibition of the actomyosin interaction by E40K and E54K Tm mutants leads to a decreased force-generating ability at systole, which is the main mechanism underlying the early pathogenesis of DCM.
Conflict of interest statement
Figures

References
-
- Fuster V, Gersh BJ, Giuliani ER, Tajik AJ, Brandenburg RO, et al. (1981) The natural history of idiopathic dilated cardiomyopathy. Am J Cardiol 47: 525–531. - PubMed
-
- Codd MB, Sugrue DD, Gersh BJ, Melton LJ (1989) Epidemiology of idiopathic dilated and hypertrophic cardiomyopathy: a population-based study in Olmsted County, Minnesota, 1975–1984. Circulation 80: 564–572. - PubMed
-
- Gillum RF (1986) Idiopathic cardiomyopathy in the United States, 1970–1982. Am Heart J 111: 752–755. - PubMed
-
- Meyer M, Schillinger W, Pieske B, Holubarsch C, Heilmann C, et al. (1995) Alterations of sarcoplasmic reticulum proteins in failing human dilated cardiomyopathy. Circulation 92: 778–784. - PubMed
-
- Michels VV, Moll PP, Miller FA, Tajik AJ, Chu JS, et al. (1992) The frequency of familial dilated cardiomyopathy in a series of patients with idiopathic dilated cardiomyopathy. N Engl J Med 326: 77–82. - PubMed
Publication types
MeSH terms
Substances
Grants and funding
LinkOut - more resources
Full Text Sources
Molecular Biology Databases
Research Materials
Miscellaneous
