

Sensitive troponins--which suits better for hemodialysis patients? Associated factors and prediction of mortality
- PMID: 23077650
- PMCID: PMC3471860
- DOI: 10.1371/journal.pone.0047610
Sensitive troponins--which suits better for hemodialysis patients? Associated factors and prediction of mortality
Abstract
Background: In hemodialysis patients, elevated plasma troponin concentrations are a common finding that has even increased with the advent of newly developed sensitive assays. However, the interpretation and relevance of this is still under debate.
Methods: In this cross-sectional study, we analyzed plasma concentrations of sensitive troponin I (TnI) and troponin T (TnT) in stable ambulatory hemodialysis patients (n = 239) and investigated their associations with clinical factors and mortality.
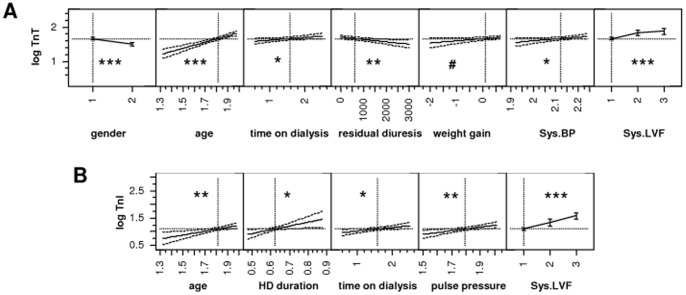
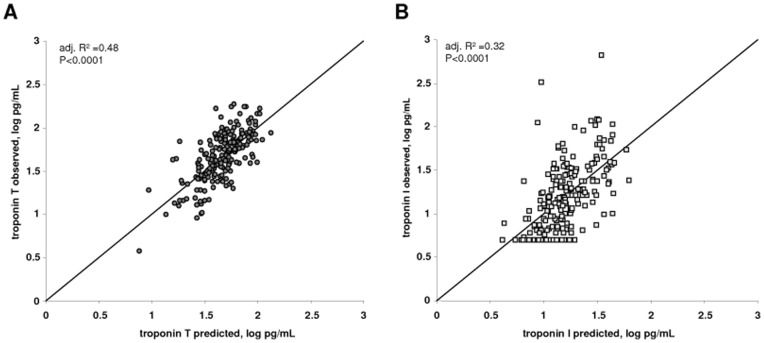
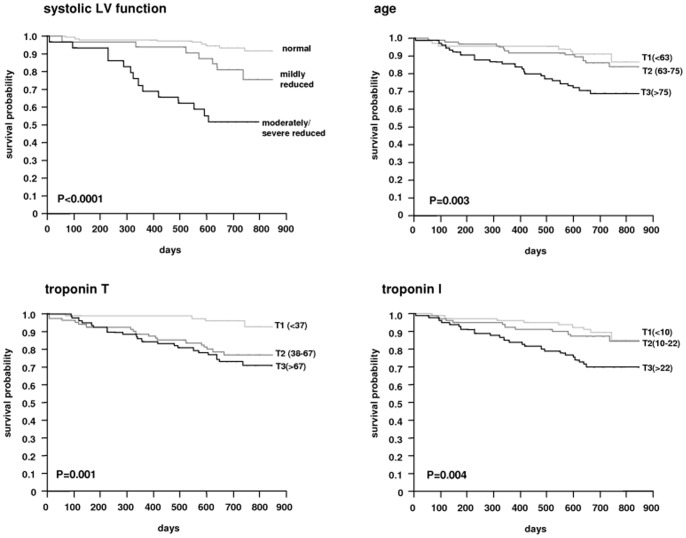
Results: In all of the enrolled patients, plasma TnI or TnT was detectable at a median concentration of 14 pg/ml (interquartile range: 7-29) using the Siemens TnI ultra assay and 49 pg/ml (31-74) using the Roche Elecsys high sensitive TnT assay. Markedly more patients exceeded the 99th percentile for TnT than for TnI (95% vs. 14%, p<0.0001). In a multivariate linear regression model, TnT was independently associated with age, gender, systolic dysfunction, time on dialysis, residual diuresis and systolic blood pressure, whereas TnI was independently associated with age, systolic dysfunction, pulse pressure, time on dialysis and duration of a HD session. During a follow-up period of nearly two years, TnT concentration above 38 pg/mL was associated with a 5-fold risk of death, whereas elevation of TnI had a gradual association to mortality.
Conclusion: In hemodialysis patients, elevations of plasma troponin concentrations are explained by cardiac function and dialysis-related parameters, which contribute to cardiac strain. Both are highly predictive of increased risk of death.
Conflict of interest statement
Figures


References
-
- Wu AH, Ford L (1999) Release of cardiac troponin in acute coronary syndromes: ischemia or necrosis? Clin Chim Acta 284: 161–174. - PubMed
-
- Thygesen K, Alpert JS, White HD (2007) Universal definition of myocardial infarction. Eur Heart J 28: 2525–2538. - PubMed
-
- Freda BJ, Tang WH, Van Lente F, Peacock WF, Francis GS (2002) Cardiac troponins in renal insufficiency: review and clinical implications. J Am Coll Cardiol 40: 2065–2071. - PubMed
-
- Artunc F, Haap M, Heyne N, Weyrich P, Wolf S (2010) [Interpretation of elevated serum troponin levels in end stage renal disease – case 2/2010]. Dtsch Med Wochenschr 135: 240. - PubMed
-
- Katus HA, Haller C, Muller-Bardorff M, Scheffold T, Remppis A (1995) Cardiac troponin T in end-stage renal disease patients undergoing chronic maintenance hemodialysis. Clin Chem 41: 1201–1203. - PubMed
Publication types
MeSH terms
Substances
LinkOut - more resources
Full Text Sources
Medical
