. 2012 Dec;86(6):1318-33.
doi: 10.1111/mmi.12071.

Variation of the folding and dynamics of the Escherichia coli chromosome with growth conditions

Affiliations

Variation of the folding and dynamics of the Escherichia coli chromosome with growth conditions

Nastaran Hadizadeh Yazdi et al. Mol Microbiol. 2012 Dec.

Abstract

We examine whether the Escherichia coli chromosome is folded into a self-adherent nucleoprotein complex, or alternately is a confined but otherwise unconstrained self-avoiding polymer. We address this through in vivo visualization, using an inducible GFP fusion to the nucleoid-associated protein Fis to non-specifically decorate the entire chromosome. For a range of different growth conditions, the chromosome is a compact structure that does not fill the volume of the cell, and which moves from the new pole to the cell centre. During rapid growth, chromosome segregation occurs well before cell division, with daughter chromosomes coupled by a thin inter-daughter filament before complete segregation, whereas during slow growth chromosomes stay adjacent until cell division occurs. Image correlation analysis indicates that sub-nucleoid structure is stable on a 1 min timescale, comparable to the timescale for redistribution time measured for GFP-Fis after photobleaching. Optical deconvolution and writhe calculation analysis indicate that the nucleoid has a large-scale coiled organization rather than being an amorphous mass. Our observations are consistent with the chromosome having a self-adherent filament organization.


Figures

Fig. 1
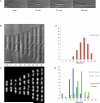
Fig. 1. Rapid growth of E. coli in LB
(A) Bright field images and (B) DIC images of cells growing and dividing in grooves under LB-agarose pad dividing approximately every 30 minutes at 30 °C. (C) Fluorescence images of chromosomes in cells expressing GFP-Fis during rapid growth showing the morphological changes of the nucleoids as they become bi-lobed and segregated. (D) Histogram of doubling times (N=50) for a typical induction level (0.5mM IPTG). (E) Histogram of septum and gap formation times (N=50) indicating the time difference between the two events. Bar is 2 μm.
Fig. 2
Fig. 2. Dynamics of chromosome geometry
(A) Sequence of images of a segregating nucleoid in a cell expressing GFP-Fis and growing under an LB-agarose pad, showing the overall geometry of the nucleoid persists over a few minute time scale (10 sec between images, 0.5 sec exposure time). Bar is 1 μm. (B) The average autocorrelation function with a characteristic time of approximately 70 seconds, calculated for a time series of images similar to the ones in panel A.
Fig. 3
Fig. 3. Slow growth of E. coli cells
(A) DIC images of cells expressing GFP-Fis growing in grooves under M9 glycerol-agarose pad, dividing approximately every 80 minutes at 30°C. (B) Fluorescence images of chromosomes in cells showing that chromosomes maintain a linear organization, taking the form of a filament during slow growth in M9. As the cell cycle proceeds, the chromosome filament gradually becomes longer and finally splits at septation (75 min and 85 min frame). (C) Histogram of doubling times (N=40) for a typical induction level (0.5 mM IPTG). (D) Histogram of septum and gap formation times (N=40) indicating that on average there is no discernible time difference between the two events. (E) DIC images of cells growing under AB glucose-acetate agarose pad, dividing approximately every 110 minutes at 30°C. (F) Fluorescence images of chromosomes in cells expressing GFP-Fis during slow growth in AB, showing the segregation does not occur until cell division. (G) Histogram of doubling times (N=50) for a typical induction level (0.5 mM IPTG). (H) Histogram of septum and gap formation times (N=50) indicating that gaps between the daughter nucleoids do not appear until septum formation or after that. Bar is 2 μm.
Fig. 4
Fig. 4. FRAP analysis of GFP-Fis dynamics during rapid growth in LB
(A) Fluorescence image of nucleoids before bleaching. (B) Time-lapse images after bleaching showing the recovery of the bleached portion of the half-bleached cell. Bar is 1 μm. (C) Fluorescence intensity profiles showing that the nucleoid in a partially bleached cell reaches an intermediate intensity level with an average characteristic time of 40±10 s (N=7 cells analyzed). Fluorescence intensity profiles of the unbleached and evenly bleached nucleoids show relatively constant intensity levels.
Fig. 5
Fig. 5. Time-lapse measurements of nucleoid positioning
(A) Dynamic positioning of the nucleoid for rapid growth in LB with doubling time of ~ 35 minutes and (B) slow growth in AB minimal medium with doubling time of ~130 minutes (~20% increase in doubling times for both cases, due to more exposure for visualization of the membrane). Time indicates time since previous cell division; red curves indicate distance between chromosome edge and old (external) cell poles; blue curves indicate distance between chromosome edges and newly created (internal) cell poles. A strong asymmetry is seen between the positioning of chromosomes relative to old and new poles immediately following cell division. The chromosomes are subsequently translated from the new pole regions of the cell, to near the center of the cell. Plots show average of the measurements for N=20 cells in each case. (C) Membrane and the nucleoid visualized in cells (expressing GFP-Fis) growing in LB, showing nucleoids becoming symmetrically positioned in the first 5 minutes of the cell cycle and remain at mid-cell for the rest of cell cycle. Bar is 2 μm. (D) A schematic drawing of an E coli cell dividing and the measurements of the gaps. (E) Membrane and the nucleoid visualized in cells growing slowly in AB showing nucleoid becoming symmetrically positioned later in the cell cycle.
Fig. 6
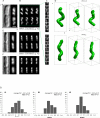
Fig. 6. Optical deconvolution and writhe calculation analysis of GFP-Fis-labeled nucleoid images
(A) DIC and florescence images of two E coli cells (expressing GFP-Fis) in early stage of cell division cycle, grown in LB. Bar is 1 μm. (B) XY view of deconvolved z-stacked images of the cells showing a coiled pattern for the nucleoids. (C) Re-slicing the z-stack perpendicular to the long cell axis shows XZ cross sections of the cells (not all slices shown here). Local maxima in each slice are highlighted in red. (D) XY and XYZ views (stereo pairs) of the smoothed center of mass trajectories with calculated writhe of the nucleoids. Dimension of the XYZ box are 1.2 × 1.2 × 3 μm and the thickness of the trajectories are approximately 0.3 μm. (E) DIC and florescence images, and deconvolved z-stacked fluorescence images of cells (expressing GFP-Fis) grown in M9 glycerol and (F) AB glucose-acetate media showing a coiled pattern for the nucleoids. (G) Writhe distributions for three different growth conditions (N=30).

Comment in

References

    1. Ali BM, Amit R, Braslavsky I, Oppenheim AB, Gileadi O, Stavans J. Compaction of single DNA molecules induced by binding of integration host factor (IHF). Proceedings of the National Academy of Sciences of the United States of America. 2001;98:10658–10663. - PMC - PubMed
    1. Ball CA, Johnson RC. Efficient excision of phage lambda from the Escherichia coli chromosome requires the Fis protein. J Bacteriol. 1991;173:4027–4031. - PMC - PubMed
    1. Bates D, Kleckner N. Chromosome and replisome dynamics in E. coli: loss of sister cohesion triggers global chromosome movement and mediates chromosome segregation. Cell. 2005;121:899–911. - PMC - PubMed
    1. Berlatzky IA, Rouvinski A, Ben-Yehuda S. Spatial organization of a replicating bacterial chromosome. Proceedings of the National Academy of Sciences of the United States of America. 2008;105:14136–14140. - PMC - PubMed
    1. Boeneman K, Fossum S, Yang Y, Fingland N, Skarstad K, Crooke E. Escherichia coli DnaA forms helical structures along the longitudinal cell axis distinct from MreB filaments. Molecular microbiology. 2009;72:645–657. - PMC - PubMed

Publication types

MeSH terms