

A vision for better health: mass spectrometry imaging for clinical diagnostics
- PMID: 23078851
- PMCID: PMC3574966
- DOI: 10.1016/j.cca.2012.10.018
A vision for better health: mass spectrometry imaging for clinical diagnostics
Abstract
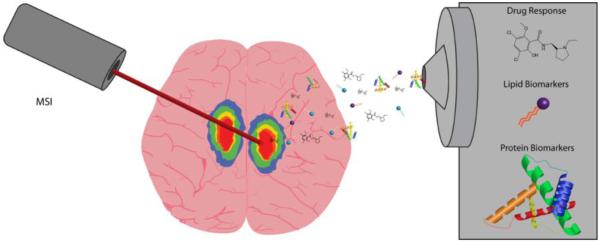
Background: Mass spectrometry imaging (MSI) is a powerful tool that grants the ability to investigate a broad mass range of molecules from small molecules to large proteins by creating detailed distribution maps of selected compounds. Its usefulness in biomarker discovery towards clinical applications has obtained success by correlating the molecular expression of tissues acquired from MSI with well-established histology.
Results: To date, MSI has demonstrated its versatility in clinical applications, such as biomarker diagnostics of different diseases, prognostics of disease severities and metabolic response to drug treatment, etc. These studies have provided significant insight in clinical studies over the years and current technical advances are further facilitating the improvement of this field. Although the underlying concept is simple, factors such as choice of ionization method, sample preparation, instrumentation and data analysis must be taken into account for successful applications of MSI. Herein, we briefly reviewed these key elements yet focused on the clinical applications of MSI that cannot be addressed by other means.
Conclusions: Challenges and future perspectives in this field are also discussed to conclude that the ever-growing applications with continuous development of this powerful analytical tool will lead to a better understanding of the biology of diseases and improvements in clinical diagnostics.
Copyright © 2012 Elsevier B.V. All rights reserved.
Figures
Similar articles
-
Challenges and recent advances in mass spectrometric imaging of neurotransmitters.Bioanalysis. 2014 Feb;6(4):525-40. doi: 10.4155/bio.13.341. Bioanalysis. 2014. PMID: 24568355 Free PMC article. Review.
-
From pixel to voxel: a deeper view of biological tissue by 3D mass spectral imaging.Bioanalysis. 2011 Feb;3(3):313-32. doi: 10.4155/bio.10.201. Bioanalysis. 2011. PMID: 21320052 Free PMC article. Review.
-
Applications of Mass Spectrometry Imaging for Safety Evaluation.Methods Mol Biol. 2017;1641:129-140. doi: 10.1007/978-1-4939-7172-5_6. Methods Mol Biol. 2017. PMID: 28748461
-
Applications of mass spectrometry imaging in virus research.Adv Virus Res. 2021;109:31-62. doi: 10.1016/bs.aivir.2020.10.002. Epub 2020 Nov 9. Adv Virus Res. 2021. PMID: 33934829 Review.
-
In situ metabolomic mass spectrometry imaging: recent advances and difficulties.J Proteomics. 2012 Aug 30;75(16):5052-5060. doi: 10.1016/j.jprot.2012.02.011. Epub 2012 Feb 16. J Proteomics. 2012. PMID: 22366554 Review.
Cited by
-
Mass Spectrometry Imaging for Spatial Chemical Profiling of Vegetative Parts of Plants.Plants (Basel). 2022 May 2;11(9):1234. doi: 10.3390/plants11091234. Plants (Basel). 2022. PMID: 35567235 Free PMC article. Review.
-
Challenges and recent advances in mass spectrometric imaging of neurotransmitters.Bioanalysis. 2014 Feb;6(4):525-40. doi: 10.4155/bio.13.341. Bioanalysis. 2014. PMID: 24568355 Free PMC article. Review.
-
A Microscale Planar Linear Ion Trap Mass Spectrometer.J Am Soc Mass Spectrom. 2019 Mar;30(3):482-488. doi: 10.1007/s13361-018-2104-x. Epub 2018 Dec 12. J Am Soc Mass Spectrom. 2019. PMID: 30542974
-
Application of Matrix-Assisted Laser Desorption/Ionization Time-of-Flight Imaging Mass Spectrometry (MALDI-TOF IMS) for Premalignant Gastrointestinal Lesions.Clin Endosc. 2013 Nov;46(6):611-9. doi: 10.5946/ce.2013.46.6.611. Epub 2013 Nov 19. Clin Endosc. 2013. PMID: 24340253 Free PMC article. Review.
-
Analysis of trace fibers by IR-MALDESI imaging coupled with high resolving power MS.Anal Bioanal Chem. 2015 Jan;407(3):813-20. doi: 10.1007/s00216-014-8042-y. Epub 2014 Aug 1. Anal Bioanal Chem. 2015. PMID: 25081013 Free PMC article.
References
-
- Teng PN, Hood BL, Sun M, Dhir R, Conrads TP. Differential proteomic analysis of renal cell carcinoma tissue interstitial fluid. J Proteome Res. 2011;10:1333–1342. - PubMed
-
- Lowenthal MS, Mehta AI, Frogale K, et al. Analysis of albumin-associated peptides and proteins from ovarian cancer patients. Clin Chem. 2005;51:1933–1945. - PubMed
-
- Flint MS, Hood BL, Sun M, Stewart NA, Jones-Laughner J, Conrads TP. Proteomic analysis of the murine liver in response to a combined exposure to psychological stress and 7,12-Dimethylbenz(a)anthracene. J Proteome Res. 2010;9:509–520. - PubMed
Publication types
MeSH terms
Substances
Grants and funding
LinkOut - more resources
Full Text Sources
Other Literature Sources
Medical
