

doi: 10.1016/j.ymeth.2012.10.004.
Epub 2012 Oct 16.
Methods for qPCR gene expression profiling applied to 1440 lymphoblastoid single cells
Affiliations
- PMID: 23079396
- PMCID: PMC3562442
- DOI: 10.1016/j.ymeth.2012.10.004
Item in Clipboard
Methods for qPCR gene expression profiling applied to 1440 lymphoblastoid single cells
Methods.
2013 Jan.
Abstract
The stochastic nature of generating eukaryotic transcripts challenges conventional methods for obtaining and analyzing single-cell gene expression data. In order to address the inherent noise, detailed methods are described on how to collect data on multiple genes in a large number of single cells using microfluidic arrays. As part of a study exploring the effect of genotype on Wnt pathway activation, data were collected for 96 qPCR assays on 1440 lymphoblastoid cells. The description of methods includes preliminary data processing steps. The methods used in the collection and analysis of single-cell qPCR data are contrasted with those used in conventional qPCR.
Copyright © 2012 Elsevier Inc. All rights reserved.
Figures
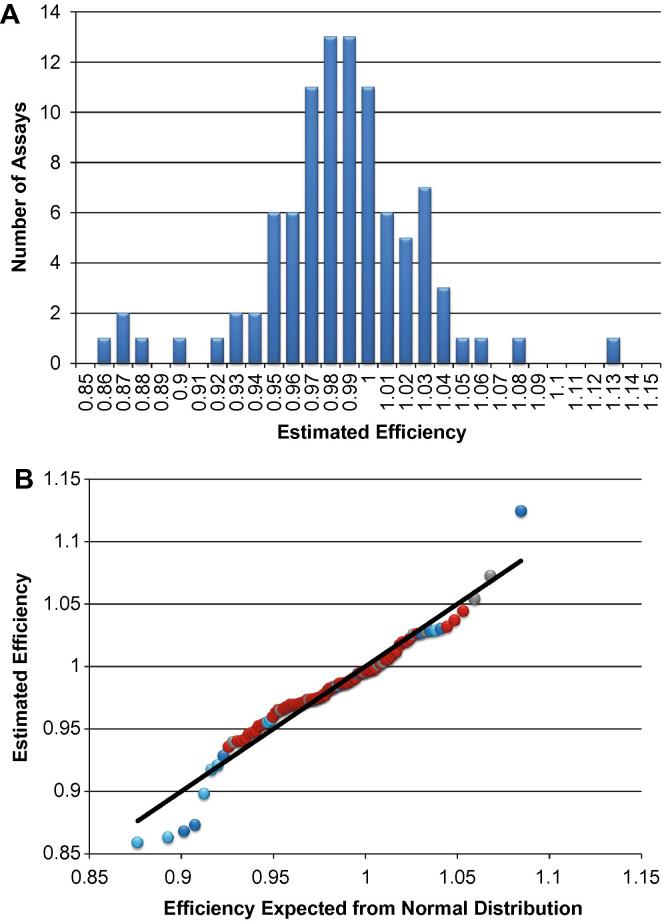
Distribution of estimated efficiencies for 95 qPCR assays detecting human transcripts. Panel A is a histogram displaying the efficiencies estimated from the slopes of standard curve plots. The average efficiency of this distribution is 0.98 with a standard deviation of 0.042. Panel B is a Q–Q plot with the experimental estimated efficiencies plotted on the y-axis and the values expected for a normal distribution with mean efficiency = 0.98 and standard deviation = 0.042 plotted on the x-axis. The black line indicates the values expected for a normal distribution (y = x). For the 85 efficiency values determined using GM12802 RNA, the data points are depicted as light blue (derived from plots with 3 points in the standard curve), dark blue (4 points in the standard curve), or red (⩾5 points in the standard curve). The 10 efficiency values determined using Universal Human cDNA are depicted in gray and all of these values are derived from standard curves with at least 5 points. It can be seen that the points that deviate the most from a normal distribution are all derived from standard curves with only 3 or 4 points. Such determinations are probably more prone to error than those derived from standard curves with 5 or more points.
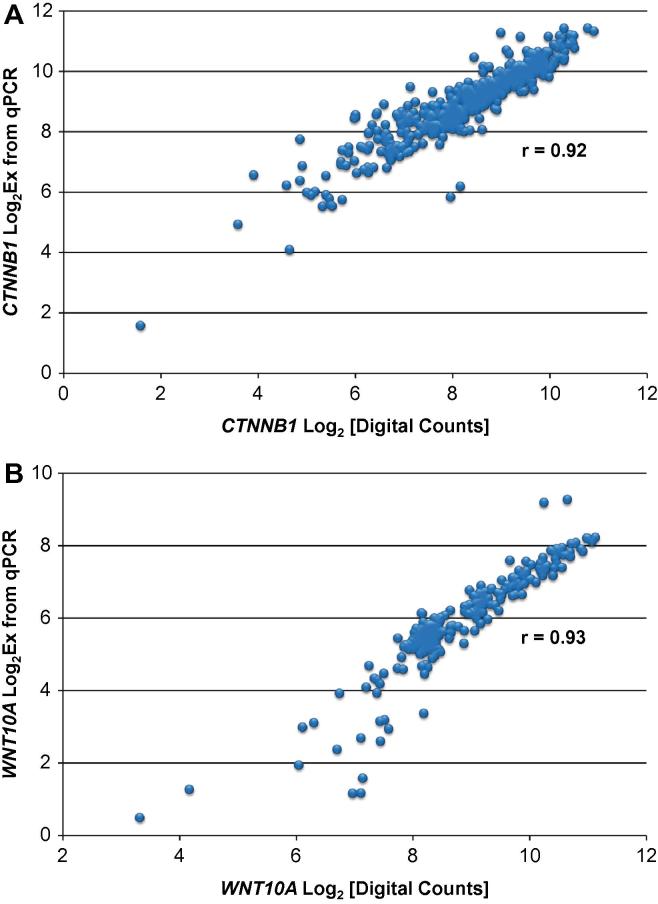
Correlation of qPCR and digital PCR single-cell results for transcripts from two genes. Plots show qPCR results plotted on the y-axis and digital PCR results plotted on the x-axis for CTNNB1 (A) and WNT10A (B). The results are for individual cells from 9 of the cell lines (GM07029, GM07019, GM12239, GM12864, GM12865, GM12752, GM12753, GM06991, GM11881). The qPCR values are Log2Ex values determined as described in Section 2.8.3. The digital PCR values are the log base 2 values of the number of target molecules estimated to be present in each panel of the 48.770 IFCs.
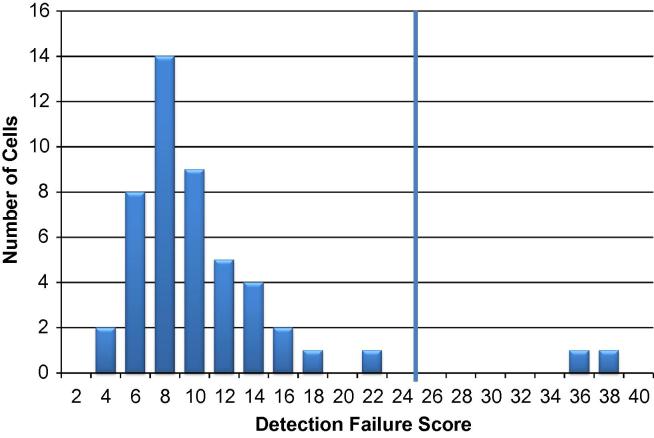
Distribution of Detection Failure Scores for one group of 48 cells. Detection Failure Scores were calculated for the 48 GM11881 baseline cells as described in Section 2.8.1. The vertical line at Detection Failure Score = 24 is the 3× median threshold used to cull low expressing cells from the data set.
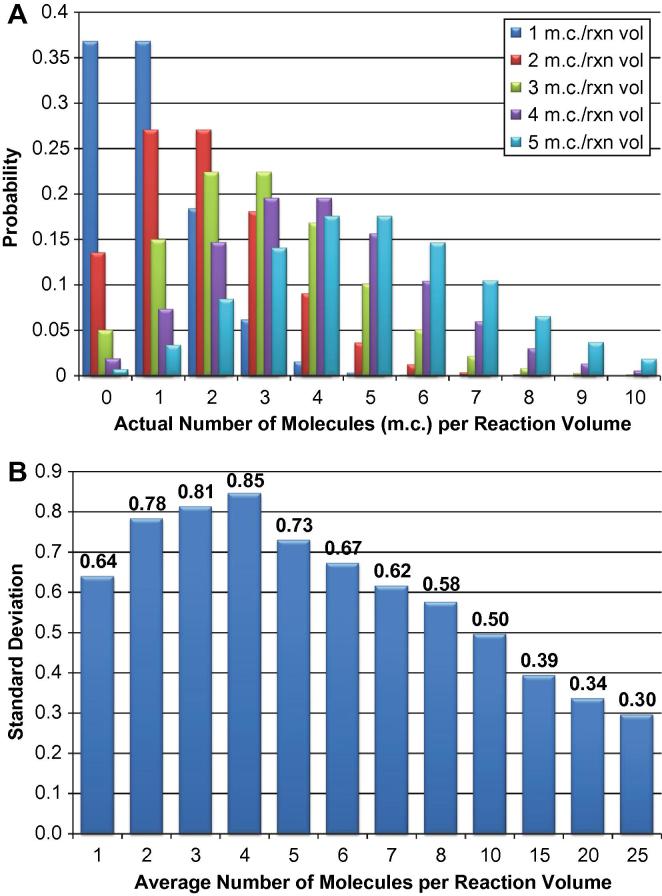
Effect of sampling error on qPCR results. Panel A depicts Poisson distributions at low concentrations of target molecules per qPCR reaction volume, ranging from 1 to 5 molecules per reaction volume. Panel B shows the calculated effect (see Section 2.8.2) of the Poisson distribution on Cq standard deviation values at various low concentrations of target molecules per qPCR reaction volume.
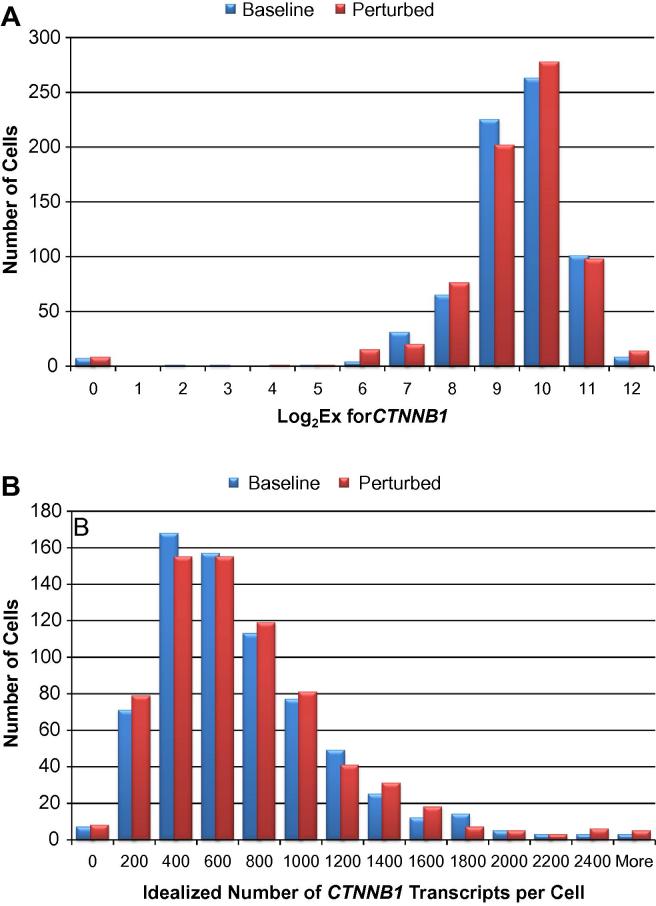
Histograms showing CTNNB1 transcript levels in lymphoblastoid cells in logarithmic (A) and linear (B) scale. Conversion of Cq values to Log2Ex values and conversion from logarithmic to linear scale are described in Section 2.8.3. For these distributions, the data for baseline (blue) and perturbed (red) cells for all 15 cell lines were pooled. The zero bins show the number of cells in which CTNNB1 transcript was not detected.
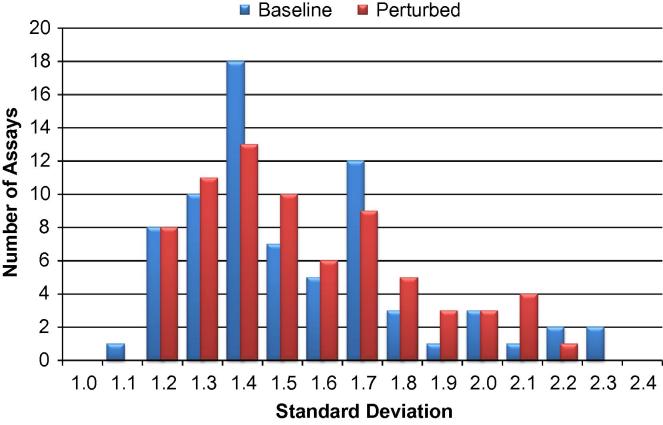
Distributions of standard deviations for the 73 assays expressed in at least 10% of the cells. Results are shown separately for pooled baseline (blue) and perturbed (red) cells.
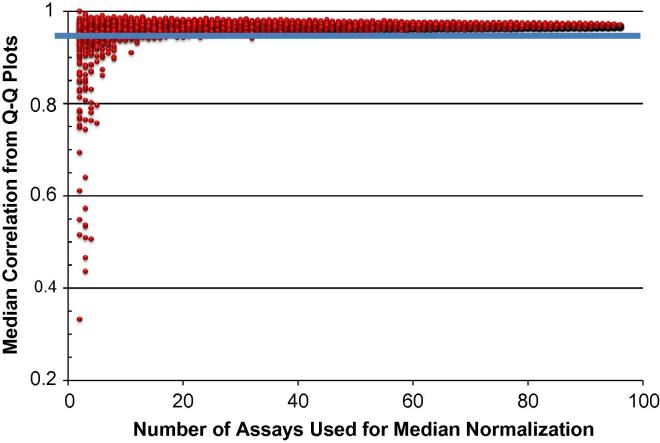
Results of a simulation testing the robustness of using data from 96 assays to estimate the median expression level per cell. The details of the simulation are described in Section 2.8.4. The x-axis plots the number of randomly selected assays (out of 96 assays) that were used to determine a median Log2Ex value for each cell. These median Log2Ex values were used to normalize the results for two batches of 96 single cells. The y-axis is a measure of how well the results from the two batches of cells correlate after normalization. The blue horizontal line is at a Pearson correlation value of 0.95.
References
Publication types
MeSH terms
Grants and funding
LinkOut - more resources
Full Text Sources
Other Literature Sources
Research Materials
