. 2013 Feb;20(2):333-42.
doi: 10.1038/cdd.2012.131. Epub 2012 Oct 19.

The C-terminal helix of Bcl-x(L) mediates Bax retrotranslocation from the mitochondria

Affiliations

The C-terminal helix of Bcl-x(L) mediates Bax retrotranslocation from the mitochondria

F Todt et al. Cell Death Differ. 2013 Feb.

Abstract

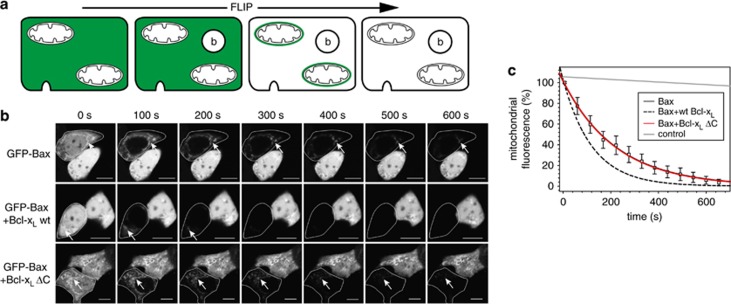
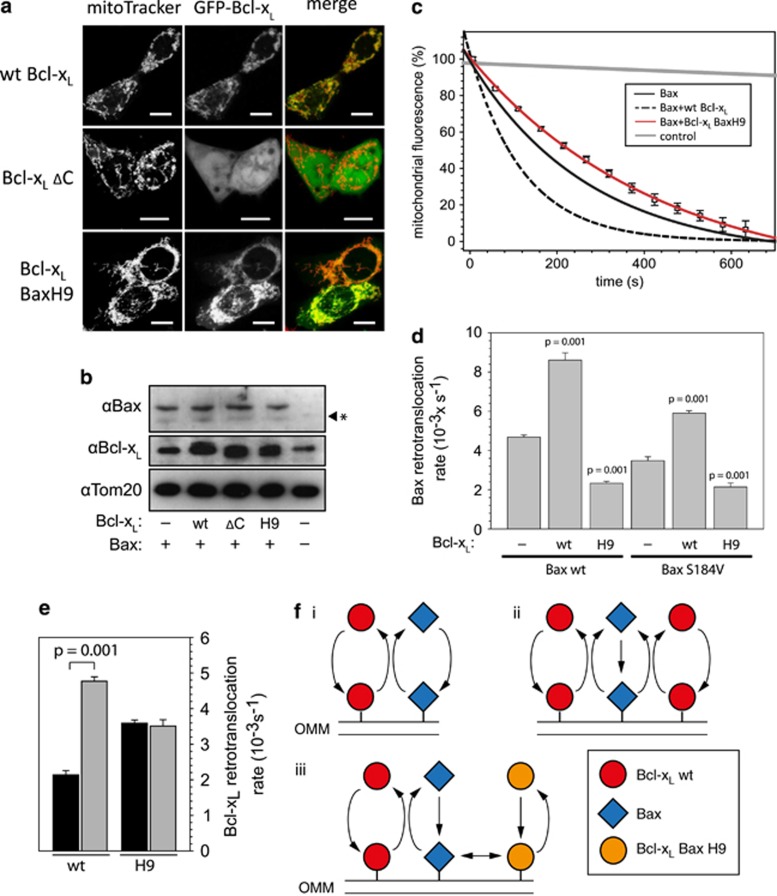
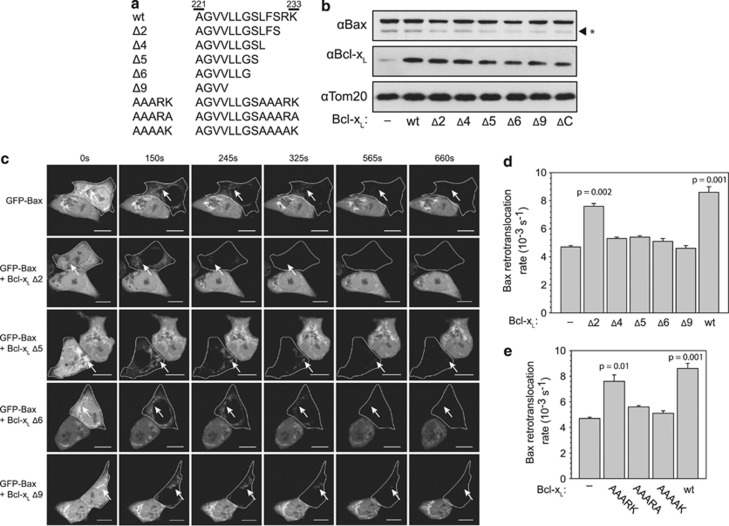
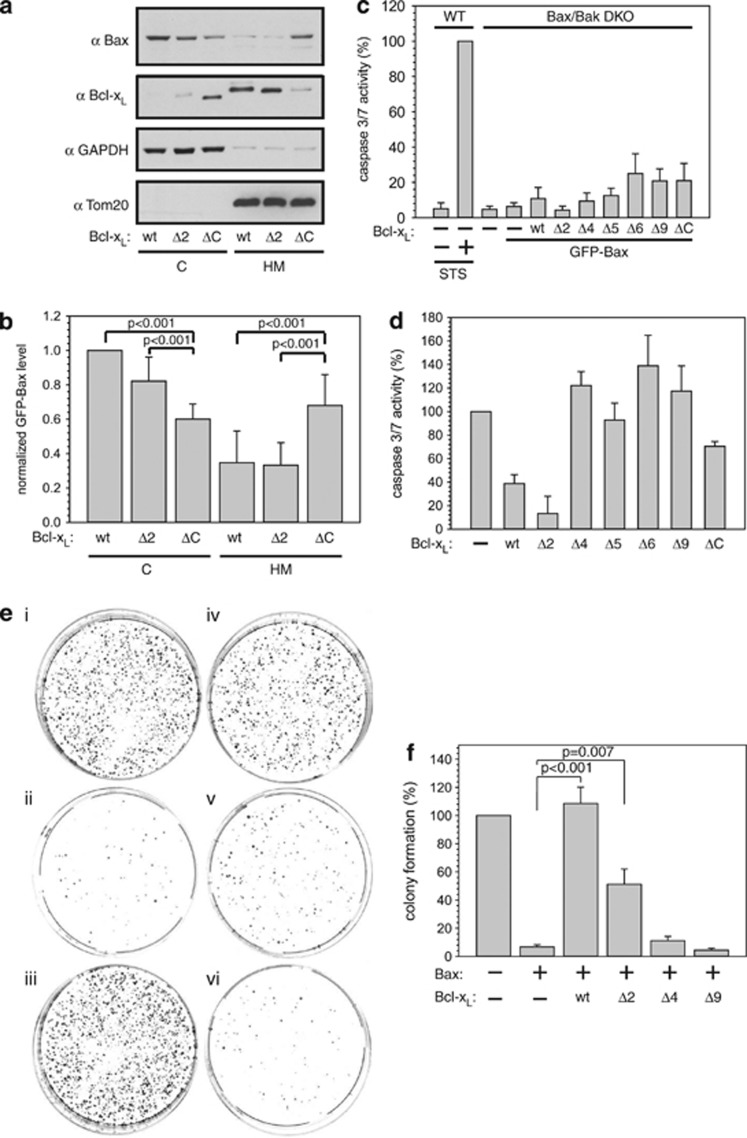
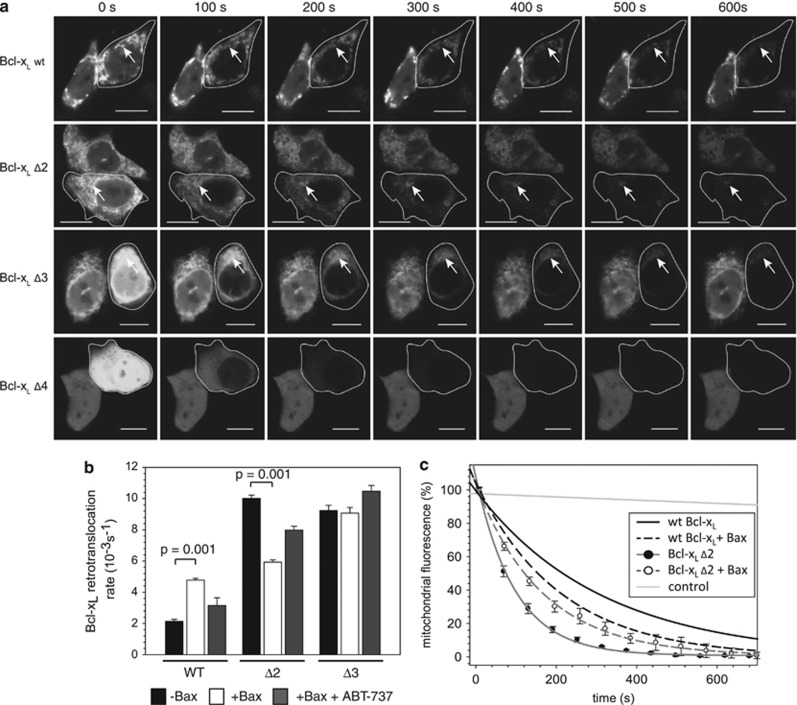
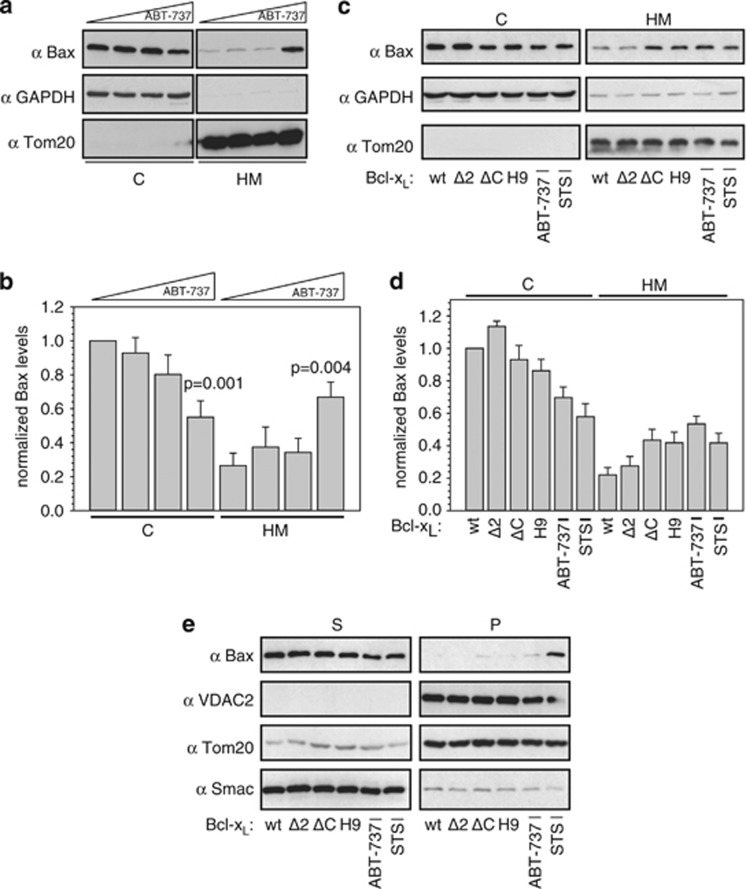
The proapoptotic Bcl-2 protein Bax can commit a cell to apoptosis by translocation from the cytosol to the mitochondria and permeabilization of the outer mitochondrial membrane. Prosurvival Bcl-2 family members, such as Bcl-x(L), control Bax activity. Bcl-x(L) recognizes Bax after a conformational change in the N-terminal segment of Bax on the mitochondria and retrotranslocates it back into the cytoplasm, stabilizing the inactive form of Bax. Here we show that Bax retrotranslocation depends on the C-terminal helix of Bcl-x(L). Deletion or substitution of this segment reduces Bax retrotranslocation and correlates with the accumulation of GFP-tagged or endogenous Bax on the mitochondria of non-apoptotic cells. Unexpectedly, the substitution of the Bcl-x(L) membrane anchor by the corresponding Bax segment reverses the Bax retrotranslocation activity of Bcl-x(L), but not that of Bcl-x(L) shuttling. Bax retrotranslocation depends on interaction to the Bcl-x(L) membrane anchor and interaction between the Bax BH3 domain and the Bcl-x(L) hydrophobic cleft. Interference with either interaction increases mitochondrial levels of endogenous Bax. In healthy cells, mitochondrial Bax does not permeabilize the outer mitochondrial membrane, but increases cell death after apoptosis induction.


Figures

Figure 1
Figure 1
Bcl-xL ΔC has no Bax retrotranslocation activity. (a) Bax retrotranslocation monitored by fluorescence loss in photobleaching (FLIP) measurements. Before FLIP, a targeted cell has fluorescent green fluorescent protein (GFP)-Bax molecules in the cytosol and on the mitochondria (left). FLIP measurements monitor the target cell during repeated bleaching (b) in the cytosol (second from left). After the first cycles of bleaching, the cytosolic Bax fluorescence is diminished and mitochondrial Bax becomes readily apparent (third from left). During FLIP measurements, the reduction of mitochondrial GFP-Bax fluorescence is monitored until mitochondrial and cytosolic GFP-Bax molecules are bleached (right). (b) Bcl-xL ΔC does not increase Bax retrotranslocation. FLIP of GFP-Bax in the absence (top) and presence of overexpressed wild-type Bcl-xL (center) and Bcl-xL ΔC (bottom) diminishes GFP-Bax fluorescence in the cytoplasm of the targeted cells (circled) completely after 100 s and GFP fluorescence is detected only on the mitochondria (arrows). The mitochondrial GFP-Bax fluorescence in the presence of overexpressed wild-type (wt) Bcl-xL is decreased faster than in the absence of wt Bcl-xL or presence of Bcl-xL ΔC overexpression. Time points in seconds are displayed on top. A scale of 10 μm is shown by the white bar in every image. (c) Bax retrotranslocation is not influenced by Bcl-xL ΔC. FLIP of mitochondrial GFP-Bax in the absence (solid black line) and presence of overexpressed Bcl-xL ΔC (red line, square) reveals identical rates for both conditions resulting in complete overlap of both data fits, while overexpression of wt Bcl-xL (broken black line) accelerates Bax retrotranslocation. Fluorescence of the neighboring cell is shown as control (gray line). Data represent normalized averages±S.E.M. from 20 region of interest (ROI) measurements per condition
Figure 2
Figure 2
Bax retrotranslocation is inhibited in the presence of Bcl-xL BaxH9. (a) Confocal images of HCT116 Bax/Bak DKO cells transfected with wild-type (wt) green fluorescent protein (GFP)-Bcl-xL (top), GFP-Bcl-xL ΔC (center) or GFP-Bcl-xL BaxH9 (bottom), displaying GFP-Bcl-xL fluorescence in the center panels and in green in the merge on the right. Mitochondria are stained with Mito Tracker-far red (left, red in the merge). Colocalization between Bcl-xL variants and the mitochondria is shown as yellow in the merge (right). The white line in the low right corner of every image is the scale of 10 μm. (b) Western blot analysis of GFP-Bax expression in the presence of different Bcl-xL variants in HCT116 Bax/Bak DKO cells. Equal loading of the samples was controlled using anti-Tom20 antibodies. An unspecific protein band is detected by the anti-Bax antibody (*). (c) Fluorescence loss in photobleaching (FLIP) measurements of mitochondrial GFP-Bax without (solid black line) and with overexpressed wt Bcl-xL (broken black line) or Bcl-xL BaxH9 (red line, square). Fluorescence of the neighboring cell is shown as control (gray line). Data represent averages±S.E.M. from 20 region of interest (ROI) measurements per condition. (d) Retrotranslocation rates measured for wt Bax and Bax S184V in the absence and presence of wt Bcl-xL and Bcl-xL BaxH9. Data represent averages±S.D. P-values according to a Mann–Whitney test between data in the absence and presence of the Bcl-xL variants are displayed. (e) Retrotranslocation rates measured for wt Bcl-xL and Bcl-xL BaxH9 in the absence (black) and presence of Bax (gray). Data represent averages±S.D. (f) Schematic depiction of Bax and Bcl-xL shuttling on and off the outer mitochondrial membrane (OMM) in healthy cells overexpressing wt Bcl-xL and Bcl-xL BaxH9. In the absence of Bcl-xL overexpression, Bax (blue square) and endogenous wt Bcl-xL (red circle) co-retrotranslocate from the mitochondria and translocate independently back to the OMM (i). Overexpressed wt Bcl-xL (red circle), like endogenous Bcl-xL, co-retrotranslocates with Bax increasing the rate of Bax retrotranslocation (ii). In the presence of Bcl-xL BaxH9 (orange circle), the retrotranslocation rate of Bax is reduced. Bcl-xL BaxH9 does not co-retrotranslocate with Bax, although both proteins may interact (iii)
Figure 3
Figure 3
The Bcl-xL C terminus is required for Bax retrotranslocation. (a) Comparison of the sequence of the C termini of different Bcl-xL variants beginning with residue A221. (b) Western blot analysis of green fluorescent protein (GFP)-Bax expression in the presence of different Bcl-xL variants in HCT116 Bax/Bak DKO cells. Equal loading of the samples was controlled using anti-Tom20 antibodies. An unspecific protein band detected by the anti-Bax antibody is marked on the right (*). (c) Fluorescence loss in photobleaching (FLIP) of GFP-Bax in the absence (top) and presence of overexpressed C-terminal deletion variants of Bcl-xL. GFP-Bax fluorescence is diminished in the cytoplasm of the targeted cells (circled) after 150 s and GFP fluorescence is detected only on the mitochondria (arrows). Time points in seconds are displayed above the images. A scale of 10 μm is displayed by the white bar in every image. (d) Retrotranslocation rates measured for Bax in the absence and presence of wild-type (wt) Bcl-xL and C-terminal deletion variants of Bcl-xL. Data represent averages±S.D. (e) Bax retrotranslocation measured in the absence and presence of wt Bcl-xL and Bcl-xL variants containing alanine substitutions in the C-terminal segment. Data represent averages±S.D.
Figure 4
Figure 4
Bax accumulates on mitochondria at low retrotranslocation rates. (a) Western blot analysis of Bax localization in the presence of different Bcl-xL variants. Cytosol (C) and heavy membrane fraction (HM) of HCT116 cells expressing green fluorescent protein (GFP)-Bax and different variants of Bcl-xL. Glyceraldehyde 3-phosphate dehydrogenase (GAPDH) and Tom20 serve as fractionation controls. (b) Quantification of GFP-Bax levels in the C and in the HM is dependent on the presence of different Bcl-xL variants revealed by western blot. P-values according to a one-way analysis of variance (ANOVA) test are depicted (n=4). (c) Apoptosis signaling based on caspase-3/7 activity measured in HCT116 Bax/Bak DKO cells overexpressing GFP-Bax and either wt Bcl-xL or C-terminal deletion variants of Bcl-xL. Measured caspase activities are displayed as normalized to untransfected cells and relative to the activity detected in HCT116 wt cells after apoptosis induction by staurosporine (STS, 1 μM) for 18 h. Untreated HCT116 cells and mock-transfected HCT116 Bax/Bak DKO cells served as controls. Data represent averages±S.E.M. (n≥3 × 3) wells. (d) STS (1 μM)-induced apoptosis activity of GFP-Bax in the presence of different Bcl-xL variants based on caspase-3/7 activity measured in HCT116 Bax/Bak DKO cells relative to the activity obtained in the absence of Bcl-xL overexpression and normalized to mock-transfected cells. Data represent averages±S.E.M. (n≥3 × 3 wells). (e) HCT116 Bax/Bak DKO cells were transfected with pcDNA (i), GFP-Bax+pcDNA (ii), GFP-Bax+wt Bcl-xL (iii), GFP-Bax+Bcl-xL Δ2 (iv), GFP-Bax+Bcl-xL Δ4 (v) and GFP-Bax+Bcl-xL Δ9 (vi), 1 μM STS was added for 24 h, cells were replated and colonies were stained with methylene blue 14 days after treatment. (f) Quantification of colony formation depicted in (e) relative to colony formation of pcDNA-transfected HCT116 Bax/Bak cells. Data are presented±S.E.M. (n=8). P-values according to Student's t-test are shown
Figure 5
Figure 5
Bcl-xL localization and retrotranslocation is influenced by the C terminus. (a) Fluorescence loss in photobleaching (FLIP) measurements of wild-type (wt) green fluorescent protein (GFP)-Bcl-xL (top) or C-terminal deletion variants of Bcl-xL in the absence of Bax. Cytosolic GFP fluorescence of the targeted cells (circled) is reduced after 100 s and Bcl-xL is detected only on the mitochondria (arrows). Time points in seconds are displayed above the images. A scale of 10 μm is shown by the white bar in every image. (b) Retrotranslocation rates measured for wt Bcl-xL and C-terminal deletion variants of Bcl-xL in the absence (black) and presence of Bax (white) or in the presence of Bax and 1 μM ABT-737 (gray). Data represent averages±S.D. P-values according to a one-way analysis of variance (ANOVA) test are displayed. (c) FLIP measurements of mitochondrial wt GFP-Bcl-xL without (solid black line) and with overexpressed Bax (broken black line) and measurements for mitochondrial GFP-Bcl-xL Δ2 in the absence (solid dark gray line, full circle) and presence of overexpressed Bax (broken dark gray line, open circles) are displayed. Fluorescence of the neighboring cell is shown as control (light gray line). Data represent averages±S.E.M. from 20 region of interest (ROI) measurements per condition
Figure 6
Figure 6
Endogenous Bax accumulates on the mitochondria in the absence of retrotranslocation. (a) Western blot analysis of endogenous Bax localization in Mcl-1 knockout (KO) mouse embryonic fibroblasts (MEFs) after 6 h treatment with 0, 0.01, 0.1 and 1 μM ABT-737 (from left to right, respectively). Cytosol (C) and heavy membrane fraction (HM) of Mcl-1 KO cells are displayed. Glyceraldehyde 3-phosphate dehydrogenase (GAPDH) and Tom20 serve as controls for the fractionation. (b) Quantification of endogenous Bax levels in the C and in the HM is dependent on the application of different ABT-737 concentrations revealed by western blot. P-values according to a one-way analysis of variance (ANOVA) test are depicted (n=7). (c) Analysis of endogenous Bax localization in HCT116 wt cells either overexpressing different Bcl-xL variants or after 6 h treatment with 1 μM ABT-737 by western blot. Apoptosis induction by 1 μM staurosporine (STS) serves as control. C and HM of HCT116 wt cells are displayed. GAPDH and Tom20 serve as control for equal protein loading. (d) Quantification of endogenous Bax levels in the C and in the HM of HCT116 cells either overexpressing different Bcl-xL variants or after treatment with 1 μM ABT-737 or 1 μM STS as analyzed by western blot (n=3). (e) Western blot analysis of carbonate extraction of membrane-associated endogenous Bax in HCT116 wt cells either overexpressing different Bcl-xL variants or after administration of 1 μM ABT-737 or 1 μM STS. Displayed are supernatant (S) and pellet (P) of the carbonate extraction. VDAC2, Tom20 and Smac served as controls

References

    1. Green DR, Kroemer G. The pathophysiology of mitochondrial cell death. Science. 2004;305:626–629. - PubMed
    1. Martinou J-C, Youle RJ. Mitochondria in apoptosis: Bcl-2 family members and mitochondrial dynamics. Dev Cell. 2011;21:92–101. - PMC - PubMed
    1. Adams JM, Cory S. Bcl-2-regulated apoptosis: mechanism and therapeutic potential. Curr Opin Immunol. 2007;19:488–496. - PMC - PubMed
    1. Llambi F, Moldoveanu T, Tait SW, Bouchier-Hayes L, Temirov J, McCormick LL, et al. A unified model of mammalian BCL-2 protein family interactions at the mitochondria. Mol Cell. 2011;44:517–531. - PMC - PubMed
    1. Hsu YT, Wolter KG, Youle RJ. Cytosol-to-membrane redistribution of Bax and Bcl-X(L) during apoptosis. Proc Natl Acad Sci USA. 1997;94:3668–3672. - PMC - PubMed

Publication types

MeSH terms