. 2012 Oct 16;22(4):506-523.
doi: 10.1016/j.ccr.2012.09.003.

Coordinated silencing of MYC-mediated miR-29 by HDAC3 and EZH2 as a therapeutic target of histone modification in aggressive B-Cell lymphomas

Affiliations

Coordinated silencing of MYC-mediated miR-29 by HDAC3 and EZH2 as a therapeutic target of histone modification in aggressive B-Cell lymphomas

Xinwei Zhang et al. Cancer Cell. .

Retraction in

Abstract

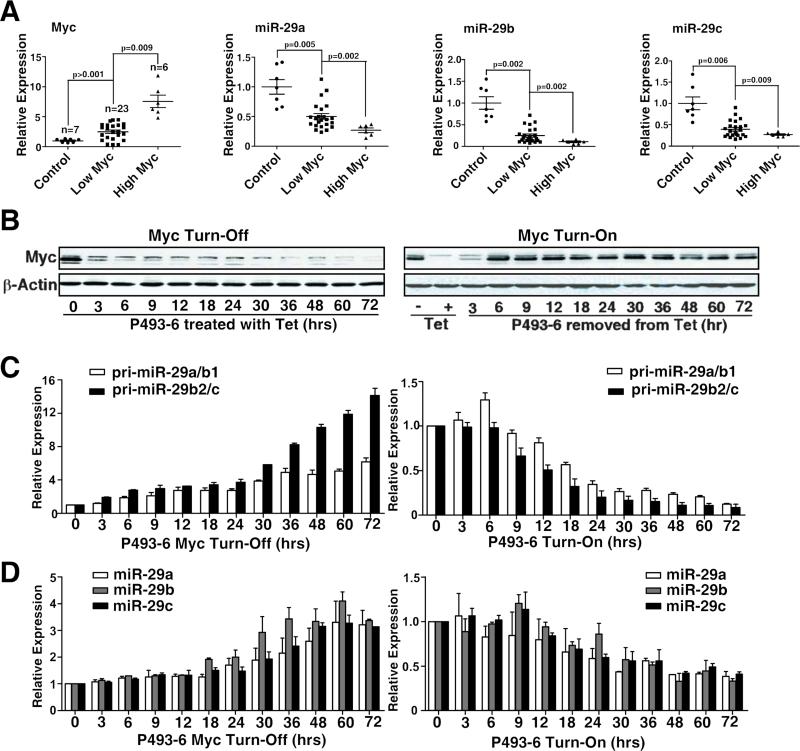
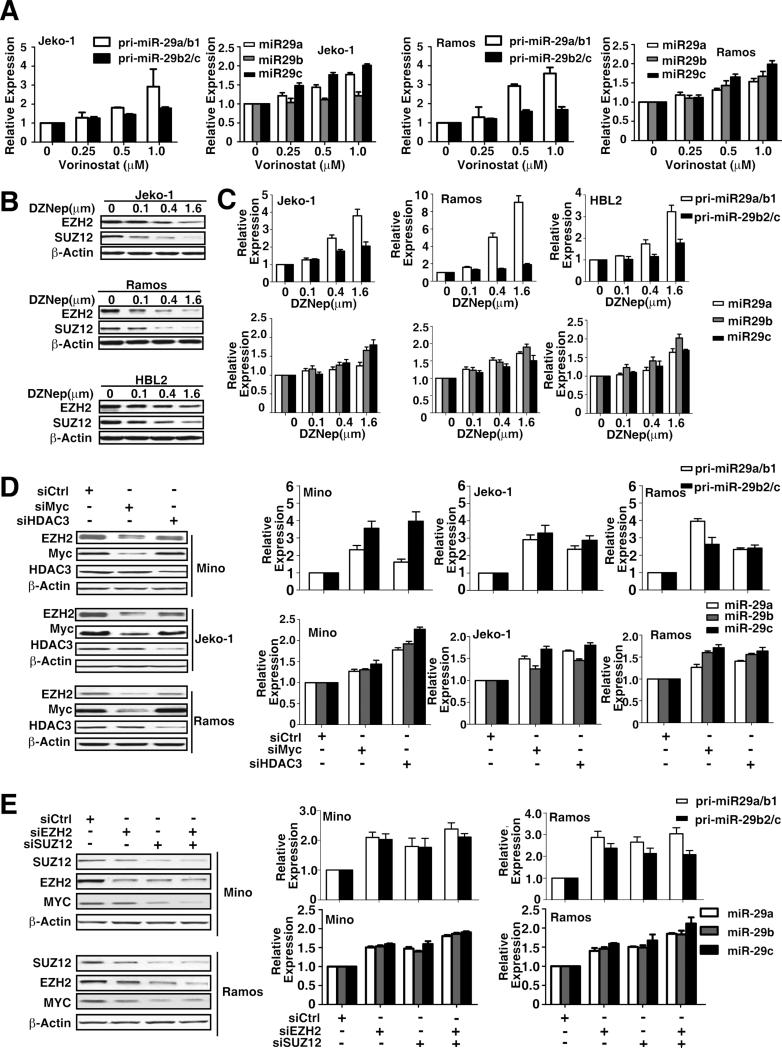
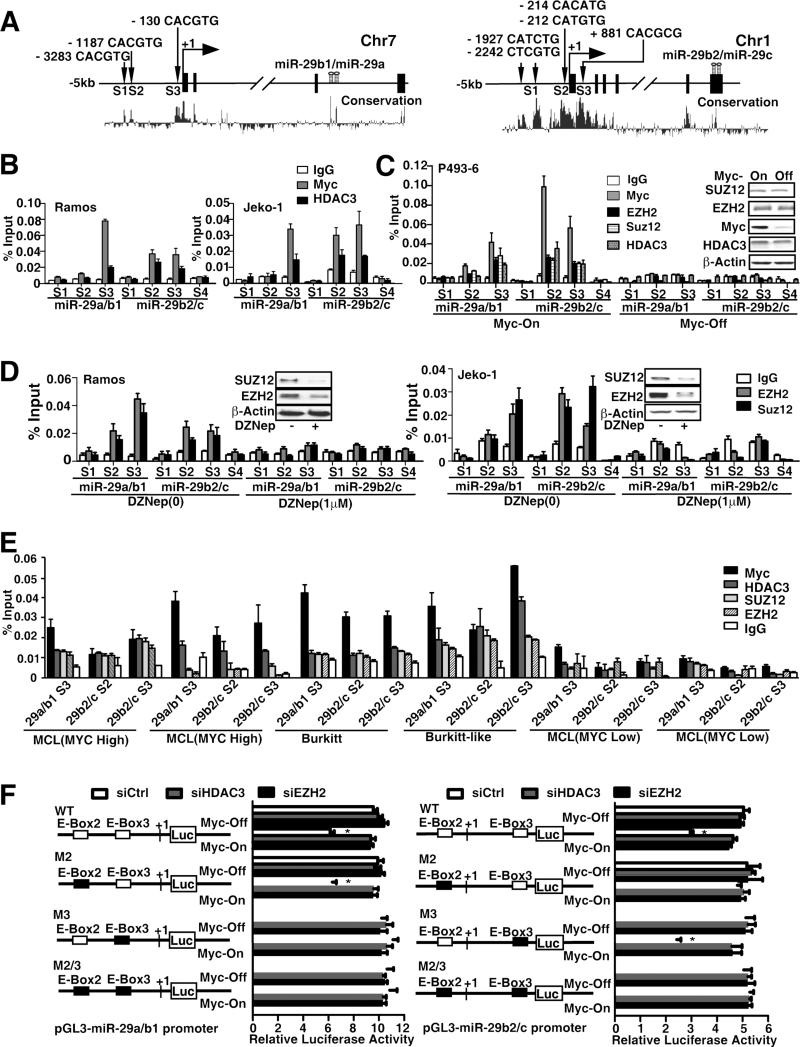
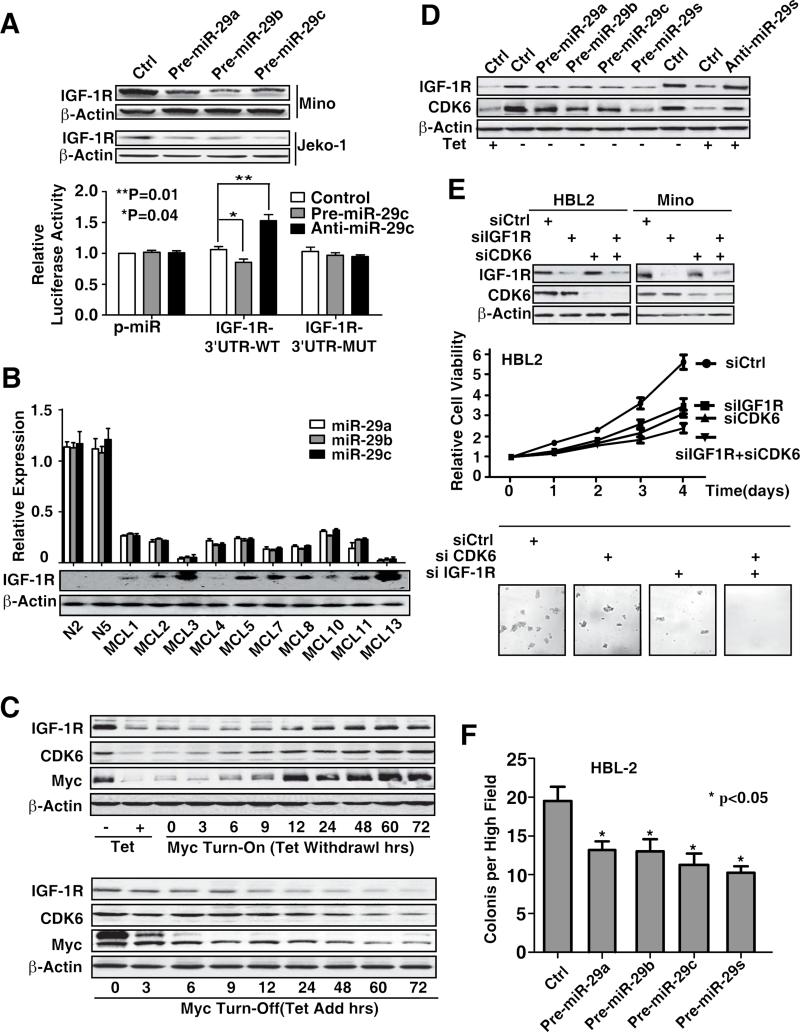
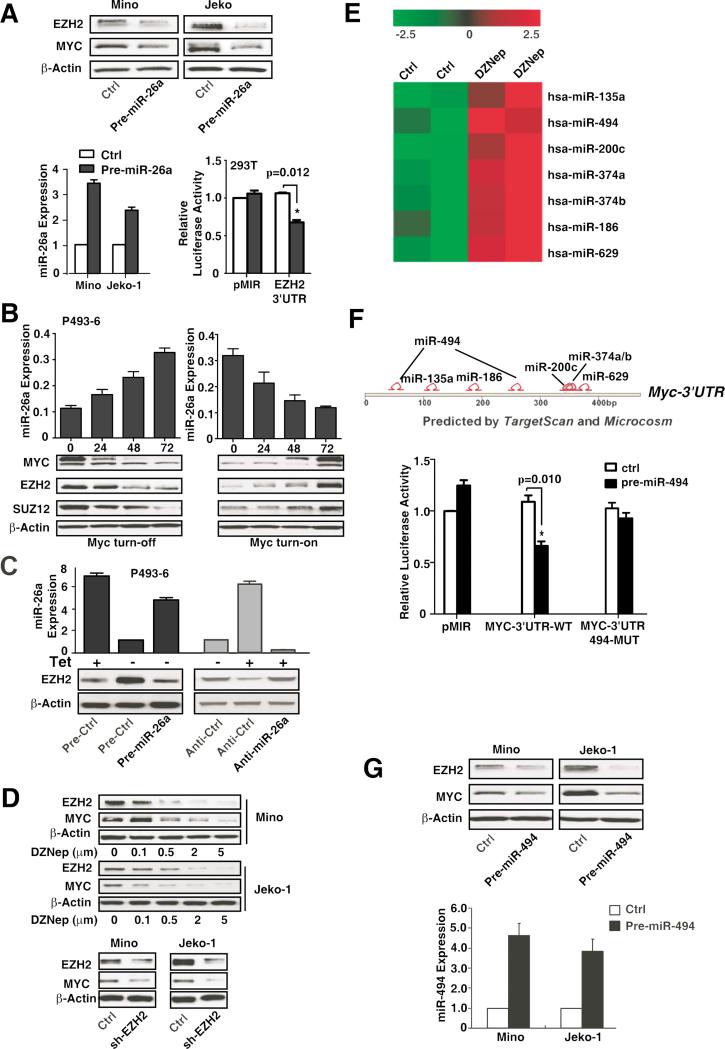
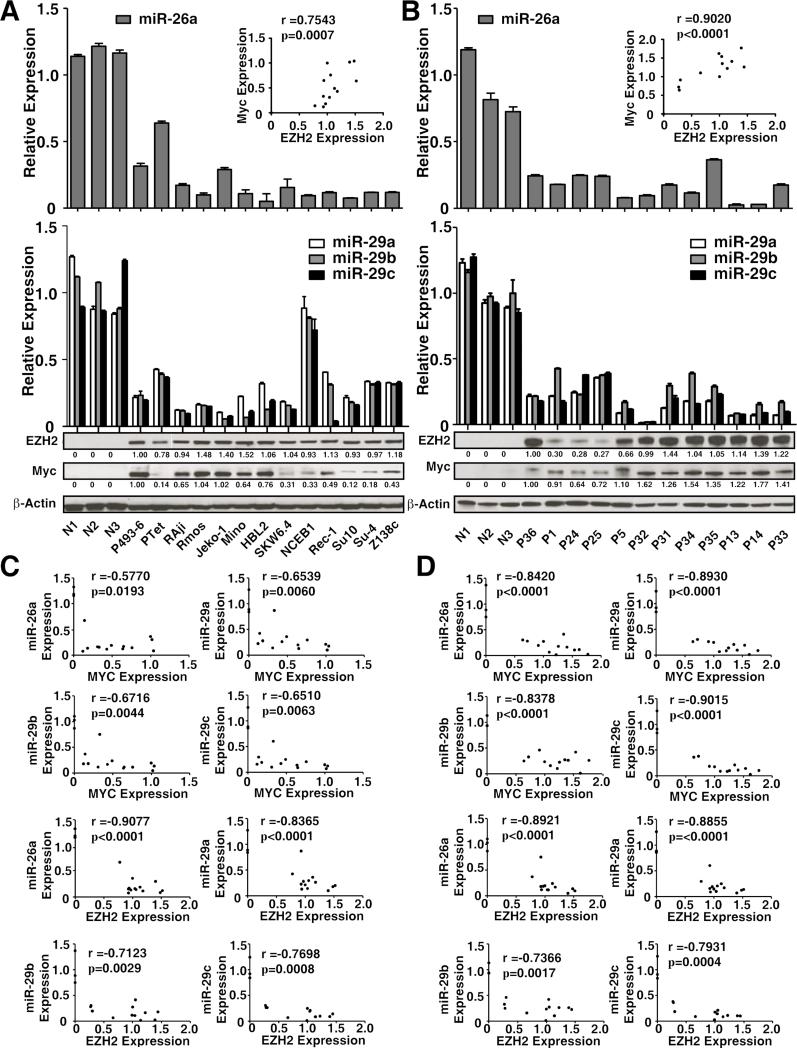
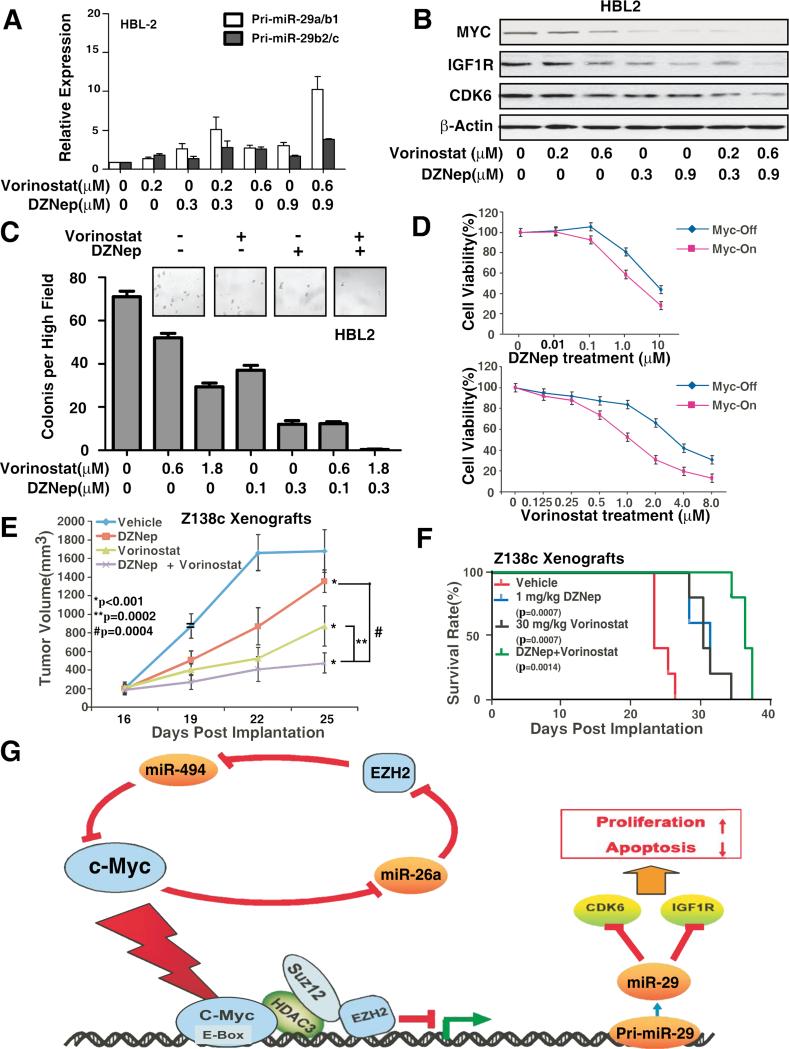
We investigated the transcriptional and epigenetic repression of miR-29 by MYC, HDAC3, and EZH2 in mantle cell lymphoma and other MYC-associated lymphomas. We demonstrate that miR-29 is repressed by MYC through a corepressor complex with HDAC3 and EZH2. MYC contributes to EZH2 upregulation via repression of the EZH2 targeting miR-26a, and EZH2 induces MYC via inhibition of the MYC targeting miR-494 to create positive feedback. Combined inhibition of HDAC3 and EZH2 cooperatively disrupted the MYC-EZH2-miR-29 axis, resulting in restoration of miR-29 expression, downregulation of miR-29-targeted genes, and lymphoma growth suppression in vitro and in vivo. These findings define a MYC-mediated miRNA repression mechanism, shed light on MYC lymphomagenesis mechanisms, and reveal promising therapeutic targets for aggressive B-cell malignancies.


Figures

Figure 1
Figure 1. Myc is overexpressed in aggressive MCLs and is inversely correlated with expression of miR-29
(A) miR-29a-c expression inversely correlated with Myc expression in primary MCL cells. Expression levels of miR-29a-c and Myc in normal B lymphocytes and primary MCL samples were measured by qRT-PCR. The High Myc group is defined as those samples in the upper quartile (25%) of Myc expression while all others are placed in the Low Myc group for the patient samples. (B-D) Expression of Myc and miR29a-c in tetracycline (Tet)-treated (Myc turn-off or Myc-off) and untreated (Myc turn-on or Myc-on) P493-6 cells. B, Western Blot shows Myc expression levels in Myc-off P493-6 cells treated with Tet and in Mycon P493-6 cells after removal of Tet for indicated times. C, Pri-miR-29 expression levels in Mycoff P493-6 cells treated with Tet and in Myc-on P493-6 cells after removal of Tet for indicated times. D, Mature miR-29 and Myc expression levels in Myc-off P493-6 cells treated with Tet and in Myc-on P493-6 cells after removal of Tet for indicated times. Pri-miR-29 level was normalized to GAPDH, and mature miR-29 expression was normalized to RNU44. Results in B are representative of 3 independent experiments. Results in C and D are means ± SD from at least 3 biological replicates. (See also Figure S1)
Figgure 2
Figgure 2. MiR-29 family is co-regulated by HDAC3 and PRC2
(A) Vorinostat treatment for 48 hours dose-dependently increased primary and mature miR-29 expression levels in Jeko-1 and Ramos cells. (B) DZNep treatment for 48 hours downregulated EZH2 and SUZ12 in Jeko-1, Ramos and HBL2 Cells. (C) DZNep treatment for 48 hours dose-dependently increased primary and mature miR-29 expression in Jeko-1, Ramos and HBL2 Cells. (D) Knockdown of Myc or HDAC3 by siRNAs increased pri- and mature miR-29 expression levels in Mino, Jeko-1 and Ramos cells. mRNA and miRNA expression levels of cells treated with siCtrl were arbitrarily set as 1. (E) Knockdown of EZH2 and SUZ12 by their siRNAs increased miR-29a-c gene expression in Mino and Ramos cells. Results in A-E are means ± SD from at least 3 biological replicates. (See also Figure S2)
Figure 3
Figure 3. Myc recruits HDAC3 and PRC2 to miR-29 promoters to repress the miR-29 transcription through histone deacetylation and trimethylation
(A) Schematic diagram showing location of Myc-binding sites of pri-miR-29a/b1 and pri-miR-29b2/c regulatory region. S1, S2, and S3 represent Myc-binding site, which has E-box sequence. S4 was used as negative control and is located in the intron 4 of pri-miR-29b2/c and without E-box in this region. Both pri-miR-29s are highly conserved in their putative promoter region and in the pre-miR-29 stem sequences, encoded in the last intron (pre-miR-29a/b1) on chr.7q32.3 and the last exon (pre-miR-29b2/c) on chr.1q32.2 respectively. (B) ChIP assay showing Myc and HDAC3 enrichment on pri-miR-29a/b1 and pri-miR-29b2/c promoters. ChIP assay was performed using Myc or HDAC3 antibody to detect binding on pri-miR-29a/b1 and pri-miR-29b2/c promoters, S1-S3 regions and S4 was used as a negative control. % Input was calculated with 2(Ct [1% of input]-Ct[ChIP]). (C) ChIP assay showing Myc, HDAC3, EZH2 and SUZ12 enrichment on pri-miR-29a/b1 and pri-miR-29b2/c promoters and dependence of HDAC3, EZH2/SUZ12 binding on Myc in P493-6 cells with or without 24 hours Tet treatment, Inserts, Western blots showing protein level of Myc, HDAC3 and EZH2/SUZ12 in Myc-on and Myc-off (24 hours Tet treatment) P493-6 cells. (D) ChIP assay showing EZH2 and SUZ12 enrichment on pri-miR-29a/b1 and pri-miR-29b2/c with or without DZNep treatment. (E) ChIP assay showing Myc, HDAC3, EZH2 and SUZ12 enrichment on pri-miR-29a/b1 and pri-miR-29b2/c promoters in primary lymphoma samples with high Myc expression (blastic MCLs, Burkitt or Burkitt like lymphomas) and no enrichment in primary samples with low myc expression (indolent MCLs). (F) Schematic diagram of pri-miR-29a/b1 and pri-miR-29b2/c promoter luciferase reporter. Solid boxes represent point mutation of E-Box. P493-6 cells were transfected with either wild-type or mutants (M) of pri-miR-29a/b1 or pri-miR-29b2/c promoter luciferase reporter, together with siHDAC3, siEZH2, or non-targeting siRNA. The luciferase activity is normalized to β-galactosidase. Results are means ± SD from 3 biological replicates. For ChIP assays, IgG was used as negative control. In B-F, results are means ± SD from at least 3 biological replicates. Inserts, Western blots showing protein level. (See also Figure S3)
Figure 4
Figure 4. HDAC3 bridges the interaction between Myc and PRC2 to form a co-repressor complex
(A) 293T cells were transfected with Myc plasmid or FLAG-HDAC3 plasmid or cotransfected with Myc plasmid and FLAG-HDAC3 plasmid. The whole cell lysates were immunoprecipitated using an antibody against Myc, HDAC3, and control IgG, followed by Western blot with an antibody against Myc, FLAG, SUZ12, and EZH2. (B) Reciprocal Co-IP showing endogenous Co-IP of HDAC3 and SUZ12. Whole cell extracts of Jeko-1 cells were subjected to IP with anti-HDAC3 antibody followed by Western blotting for SUZ12, and similar whole cells extracts were subjected to IP with anti-SUZ12, followed by Western blotting with anti-HDAC3. (C) Co-IP of Myc, HDAC3, and SUZ12/EZH2 in Myc-on and Myc-off P493-6 cells. Cell lysates of P493-6 with and without Tet treatment were immunoprecipitated with Myc, HDAC3, SUZ12, EZH2, and control IgG, respectively, followed by Western blotting with an antibody against Myc, HDAC3, SUZ12, and EZH2. (D) HDAC3-mediated interaction between Myc and SUZ12/EZH2. P493-6 (Myc-on) cells were transfected with HDAC3 siRNA or non-targeting siRNA to knock down HDAC3, and Co-IP experiments were performed to evaluate interaction between Myc and SUZ12/EZH2. A-D, Input is equivalent to 10% of the lysate used for the Co-IP. Results are representative of 3 independent experiments.
Figure 5
Figure 5. miR-29 is required for Myc-mediated oncogenic activity by targeting IGF-1R and CDK6 pathways
(A) IGF-1R is a direct target of miR-29. Overexpression of miR-29a-c downregulates IGF-1R expression and reduces luciferase activity of wild-type IGF-1R 3′ UTR reporter (IGF-1R-WT) but not mutated IGF-1R 3′UTR reporter (IGF-1R-M). (B) miR-29 level is reversely correlated with IGF-1R protein expression of MCL patient samples. (C) IGF-1R and CDK6 expression in Myc-on and Myc-off P493-6 cells. (D) 48hrs after pre-miR-29a-c transfection abolished Myc-induced CDK6 and IGF-1R expression and knockdown of miR-29 by anti-miR-29 blocked “Myc-off”-induced CDK6 and IGF-1R repression, and anti-miR-29s (pool of anti-miR-29a-c) is used to knockdown miR-29 expression. (E) Knockdown of IGF1R and CDK6 by their siRNAs inhibits lymphoma cell survival measured by MTT and colony formation assay in HBL2 cells after transfection with siIGF-1R and siCDK6 or control siRNA. Micrographs show the appearance of colonies in methycellulose gels at low power. (F) Over-expression of miR-29 decreases the colony formation. The numbers of tumor colonies were enumerated microscopically after an incubation of 2 weeks. Results are representative of 3 independent experiments or means ± SD from at least 3 biological replicates. (See also Figure S4)
Figure 6
Figure 6. Myc-miR-26a-EZH2-miR-494 positive feedback loop sustains Myc activity and miR-29 repression
(A) EZH2 is a direct target of miR-26a. Overexpression of miR-26a downregulates EZH2 and Myc expression and suppresses EZH2 3’-UTR luciferase activity in 293T cells. (B) miR-26a expression is regulated by Myc. miR-26a, EZH2, SUZ12, and c-Myc protein expression levels in Myc turn-on and Myc turn-off P493-6 cells. (C) Overexpression of miR-26a by Pre-miR-26a suppresses Myc-induced EZH2 expression in Myc-on P493-6 cells, while suppression of miR-26a by Anti-miR-26a increases EZH2 expression in Myc-off P493-6 cells. (D) Inhibition of EZH2 with DZNep or shRNA decreases Myc protein expression. (E) Putative Myc 3’-UTR targeting miRNAs are upregulated by EZH2 inhibition. (F) TargetScan and microCosm depicting potential binding sites for the DZNep upregulated miRNAs in Myc-3’-UTR and Myc is a direct target of miR-494. 293T cells are co-transfected with luciferase reporters, which contain the wild-type or mutant of Myc 3’-UTR, and overexpression of miR-494 inhibits Myc-3’-UTR but not mutant 3’-UTR luciferase activities. (G) Overexpression of miR-494 suppresses Myc and EZH2 expression. Results are representative of 3 independent experiments or means ± SD from at least 3 biological replicates. (See also Figure S5)
Figure 7
Figure 7. miR-26a and miR-29 downregulation are reversely correlated with upregulation of Myc and EZH2 in MCL and other aggressive Myc-expressing lymphomas
(A) miR-26a and miR-29 expression levels and Myc and EZH2 protein levels in MCL and other aggressive B-cell lymphoma cell lines. Cell lines were as follows: Jeko-1, Mino, HBL-2, NCEB-1, REC-1, Z138c (MCL); Raji and Ramos (Burkitt lymphoma)’ SUDHL-4 (Su-4), SUDHL-10 (Su10) (transformed large B-cell lymphoma); and SKW6.2 (EBV-associated lymphoma). (B) miR-26a and miR-29 expression levels and Myc and EZH2 protein levels in primary MCL samples and other aggressive B-cell lymphoma samples. Samples were as follows: P1 and P5 (aggressive MCL); P31-35 and P13 (Burkitt lymphoma); P36, P14, and P24-P25 (high grade transformed diffuse large B-cell lymphomas). N1-N3, CD19 sorted normal B lymphocytes. miR-29 and miR-26a expression levels were measured by qRT-PCR and normalized to RNU44. Myc and EZH2 expression levels were evaluated by Western blot, A-B, the relative level of Myc and EZH2 protein was measured by quantitative densitometry and is indicated below each lane. Insert, correlation between Myc and EZH2 protein. r, correlation coefficient.(C) Correlation between Myc/EZH2 protein expressions with miR-26a/miR-29a-c level in MCL and other aggressive B-cell lymphoma cell lines. r, correlation coefficient. (D) Correlation between Myc/EZH2 protein expressions with miR-26a/miR-29a-c level in primary MCL and other aggressive B-cell lymphoma samples. r, correlation coefficient. Results are representative of 3 independent experiments or means ± SD from at least 3 biological replicates
Figure 8
Figure 8. Combined inhibition of HDAC and PRC2 cooperatively reactivates miR-29 level and suppresses tumor cell growth in vitro and in vivo
(A) Combined treatment with vorinostat and DZNep induces higher expression of primary miR-29a/b1, primary miR-29b2/c, and mature miR-29a-c than each agent alone in HBL-2 cells. (B-C) Combined treatment with vorinostat and DZNep induced higher downregulation of IGF-1R and CDK6 protein (B) and inhibition of clonogenic growth (C) than each agent alone in HBL-2 cells. (D) Cell proliferation assay (CCK8) showing that Myc-on P493-6 cells are more sensitive than Myc-off P496-3 cells to DZNep and vorinostat treatment. (E-F) Co-treatment with DZNep and vorinostat inhibits tumor growth and significantly improves survival of NOD/SCID mice bearing MCL xenografts. Tumor growth was measured by calipers. Results are mean tumor volume ± SEM, (treatment vs. vehicle control, * p<0.001; combination vs. single agent, ** p=0.0002, # p=0.0004). Survival of mice in all groups is represented by a Kaplan-Meier plot and Log-rank test was used. (n = 6 mice per condition) (G) Model of feed-forward regulatory circuit in which Myc contributes to the upregulation of EZH2 via repressing EZH2-targeting miR-26a and that EZH2 in turn relieves Myc negative regulation via Myc-targeting miR-494, thereby generating a positive feedback loop to ensure persistently high protein levels of Myc and EZH2 and further repression of miR-29. Results are representative of 3 independent experiments or means ± SD from at least 3 biological replicates. (See also Figure S6)

References

    1. Chang TC, Yu D, Lee YS, Wentzel EA, Arking DE, West KM, Dang CV, Thomas-Tikhonenko A, Mendell JT. Widespread microRNA repression by Myc contributes to tumorigenesis. Nat Genet. 2008;40:43–50. - PMC - PubMed
    1. Chen H, Tu SW, Hsieh JT. Down-regulation of human DAB2IP gene expression mediated by polycomb Ezh2 complex and histone deacetylase in prostate cancer. J Biol Chem. 2005;280:22437–22444. - PubMed
    1. Dave SS, Fu K, Wright GW, Lam LT, Kluin P, Boerma EJ, Greiner TC, Weisenburger DD, Rosenwald A, Ott G, et al. Molecular diagnosis of Burkitt's lymphoma. N Engl J Med. 2006;354:2431–2442. - PubMed
    1. Fabbri M, Croce CM. Role of microRNAs in lymphoid biology and disease. Curr Opin Hematol. 2011;18:266–272. - PMC - PubMed
    1. Fabbri M, Garzon R, Cimmino A, Liu Z, Zanesi N, Callegari E, Liu S, Alder H, Costinean S, Fernandez-Cymering C, et al. MicroRNA-29 family reverts aberrant methylation in lung cancer by targeting DNA methyltransferases 3A and 3B. Proc Natl Acad Sci U S A. 2007;104:15805–15810. - PMC - PubMed

Publication types

MeSH terms

Associated data