. 2012 Oct 16;22(4):547-60.
doi: 10.1016/j.ccr.2012.08.014.

Metabolic signatures uncover distinct targets in molecular subsets of diffuse large B cell lymphoma

Affiliations

Metabolic signatures uncover distinct targets in molecular subsets of diffuse large B cell lymphoma

Pilar Caro et al. Cancer Cell. .

Abstract

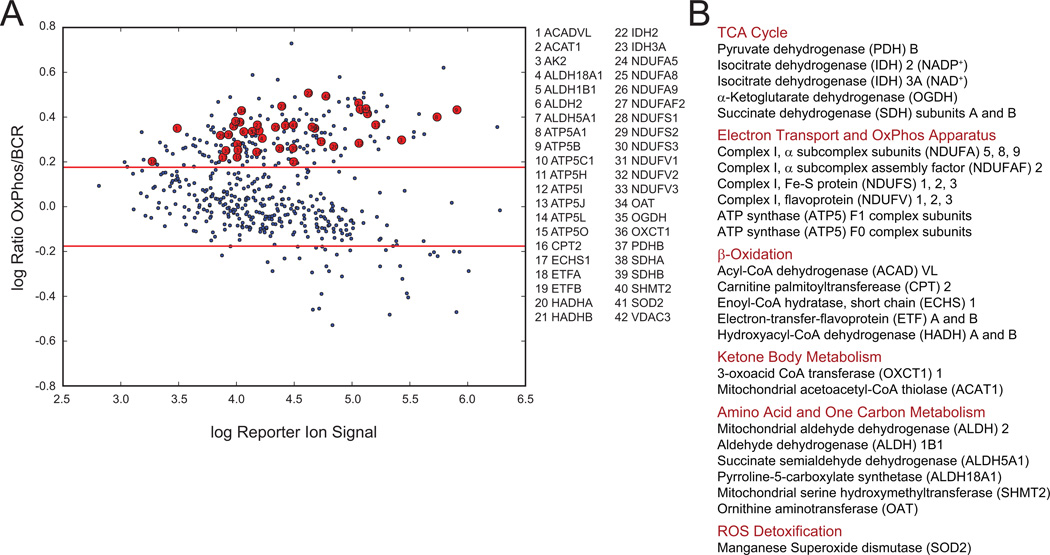
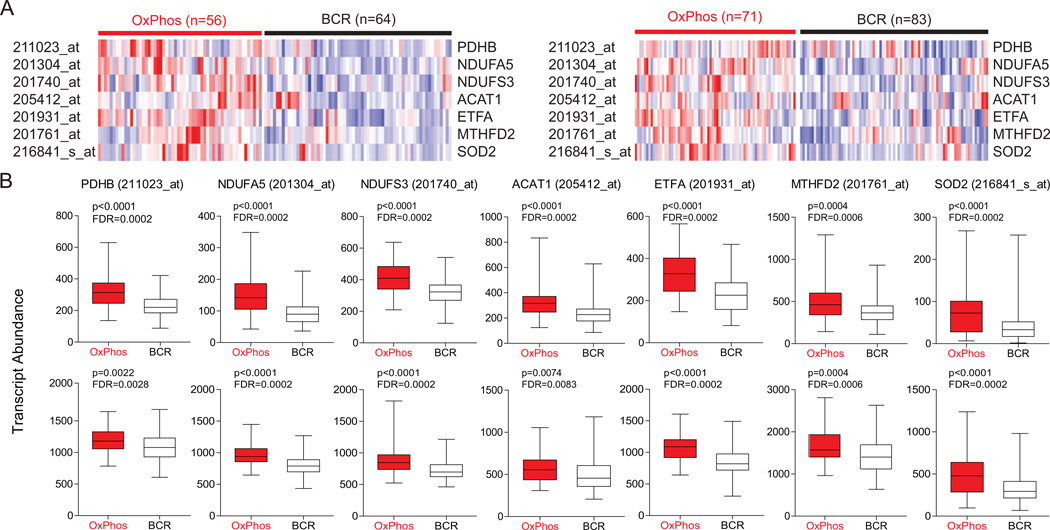
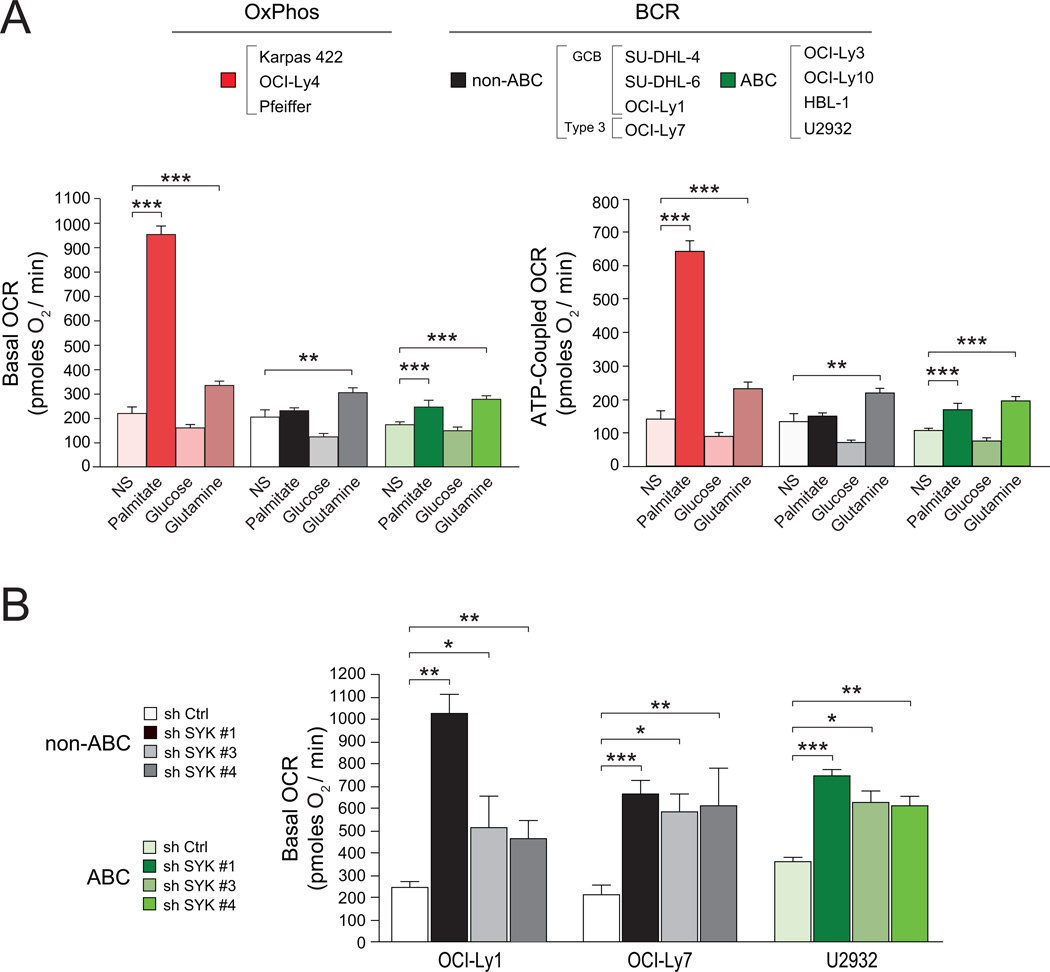
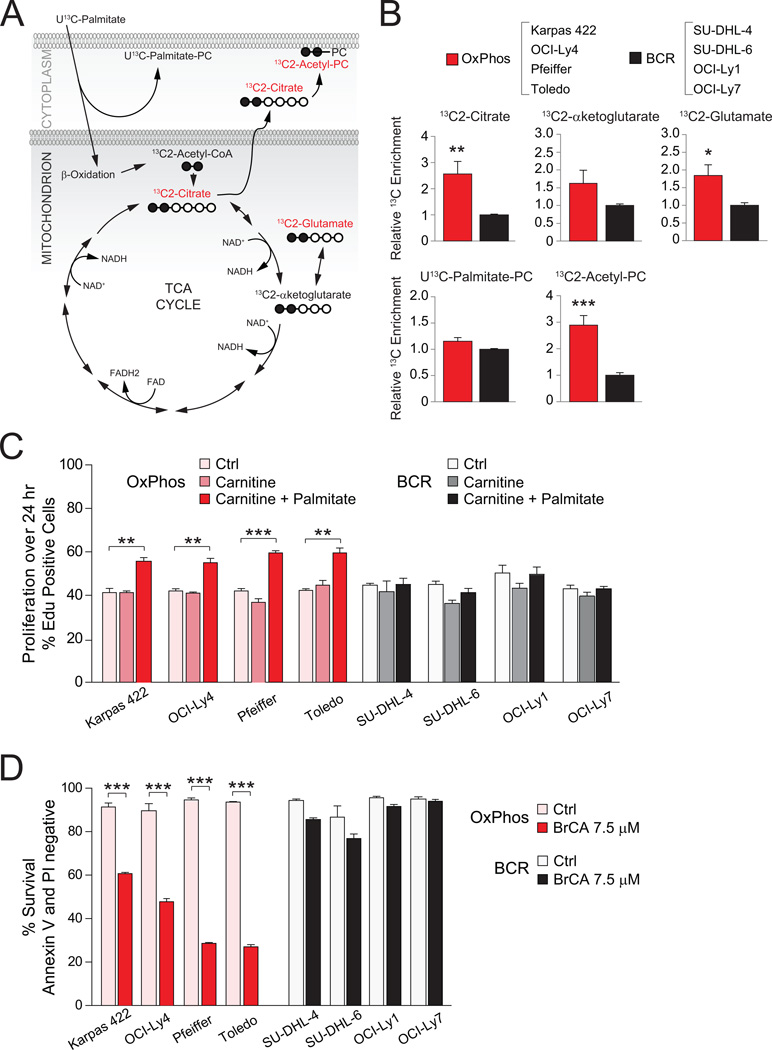
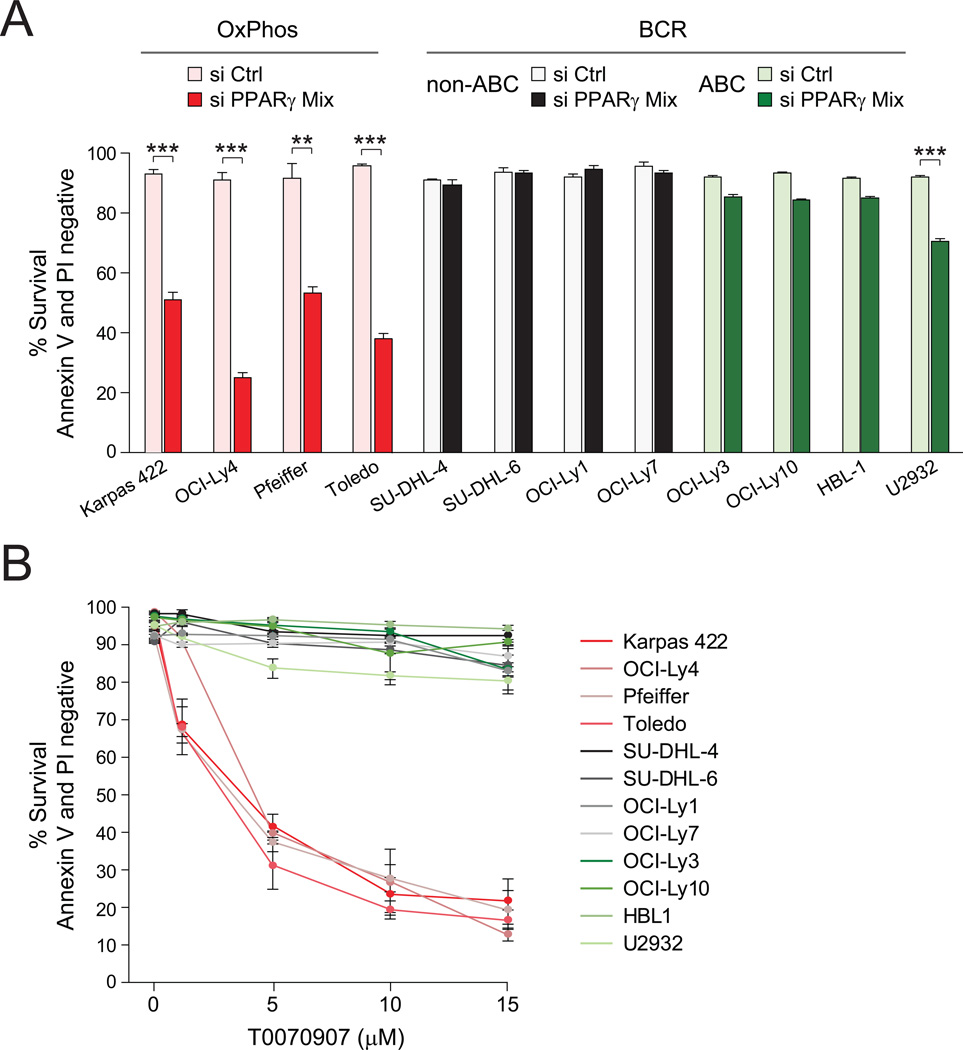
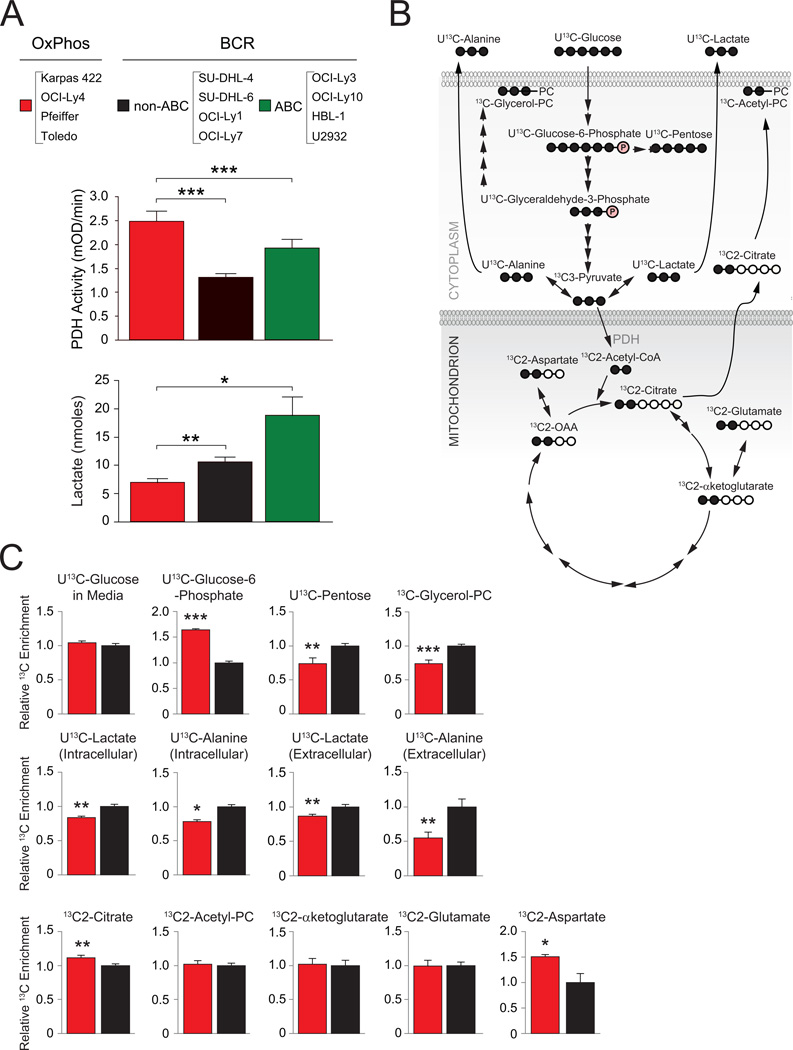
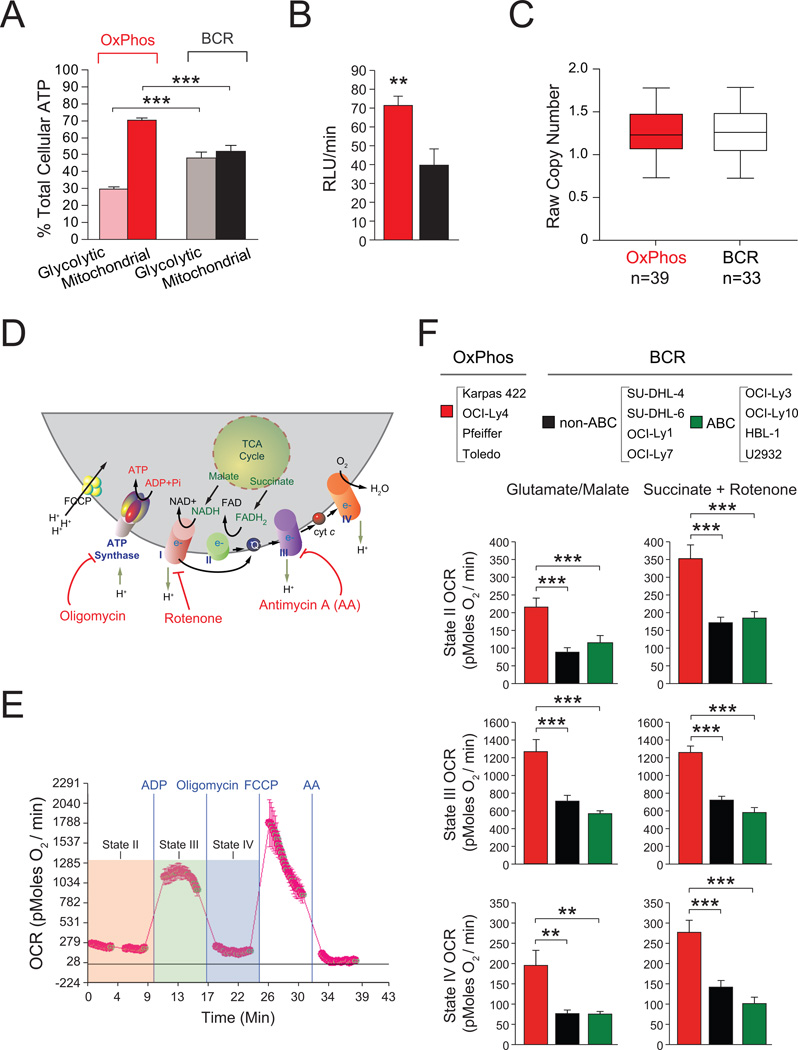
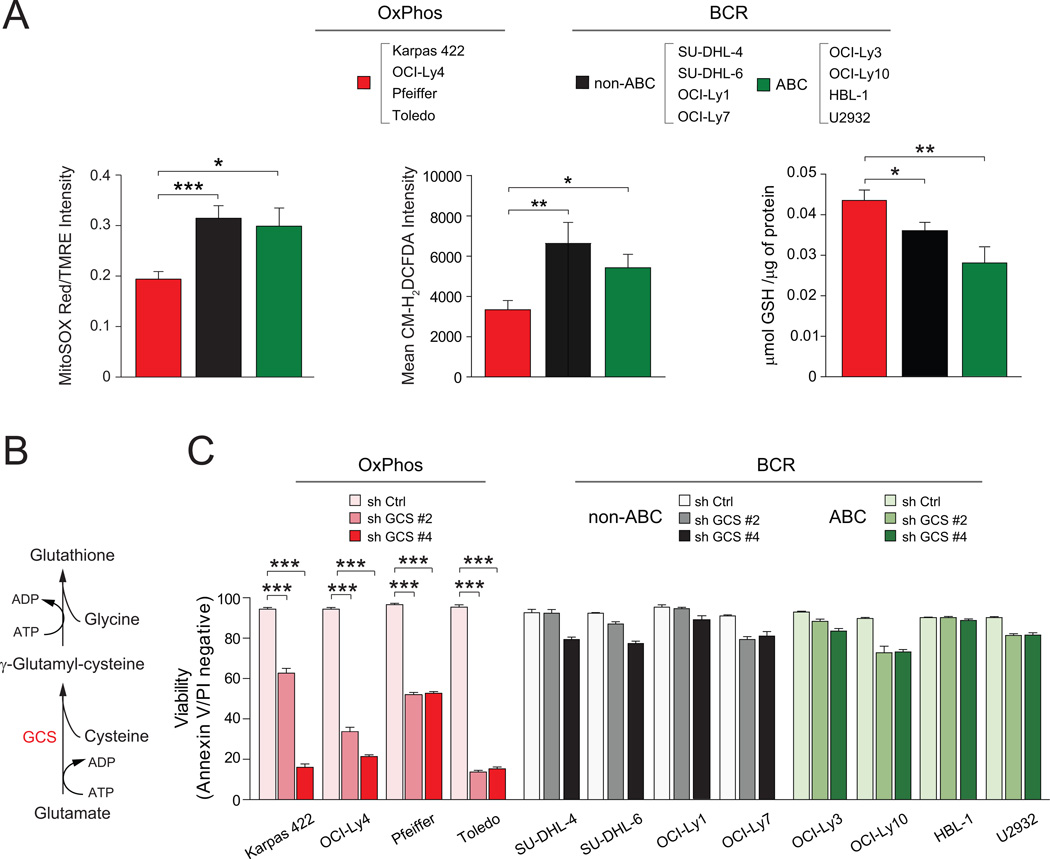
Molecular signatures have identified several subsets of diffuse large B cell lymphoma (DLBCL) and rational targets within the B cell receptor (BCR) signaling axis. The OxPhos-DLBCL subset, which harbors the signature of genes involved in mitochondrial metabolism, is insensitive to inhibition of BCR survival signaling but is functionally undefined. We show that, compared with BCR-DLBCLs, OxPhos-DLBCLs display enhanced mitochondrial energy transduction, greater incorporation of nutrient-derived carbons into the tricarboxylic acid cycle, and increased glutathione levels. Moreover, perturbation of the fatty acid oxidation program and glutathione synthesis proved selectively toxic to this tumor subset. Our analysis provides evidence for distinct metabolic fingerprints and associated survival mechanisms in DLBCL and may have therapeutic implications.


Figures

Figure 1
Figure 1. Comparison of Mitochondrial Proteome in OxPhos- and BCR-DLBCLs
(A and B) Multiplex iTRAQ analysis of mitochondria derived from 3 OxPhos- (Karpas 422, Toledo, and Pfeiffer) and 3 BCR- (OCI-Ly1, SU-DHL-4, and SU-DHL-6) DLBCL cell lines. Log-log plots of reporter ions abundance ratios vs. reporter ion intensities for proteins detected in replicate nanoflow LC-MS/MS analyses are shown (A). Proteins within the mitochondrial signature that are enriched in OxPhos-DLBCLs are shown as red circles in (A) and grouped per metabolic pathway in (B). Red lines in A represent global thresholds based on a ±1.5-fold change between OxPhos and BCR subtypes. See also Figure S1 and Table S1.
Figure 2
Figure 2. Increased Abundance of Transcripts Encoding Mitochondrial Proteins in Primary DLBCL Tumor Biopsies
(A) Heat map representation of the relative mRNA levels of genes corresponding to the components of the mitochondrial proteome signature using the Monti et al. (left) and Lenz et al. (right) expression array data sets of primary DLBCL cases with OxPhos and BCR consensus cluster assignments. (B) Transcript abundance (probe intensity) of the indicated genes in primary OxPhos- and BCR-DLBCLs from the Monti et al. (top) and Lenz et al. (bottom) data sets. Differential expression was determined by a two-sided Mann Whitney test and p values were corrected for multiple hypothesis testing using the false discovery rate (FDR) procedure. Abbreviations: PDH, pyruvate dehydrogenase; NDUFA5, NADH dehydrogenase (ubiquinone) 1α subcomplex subunit 5; NDUFS3, NADH dehydrogenase (ubiquinone) Fe-S protein 3; ETF, electron-transfer-flavoprotein; ACAT, acetoacetyl-CoA thiolase; MTHFD2, methylenetetrahydrofolate dehydrogenase 2; SOD2, manganese superoxide dismutase. See also Tables S2 and S3.
Figure 3
Figure 3. Mitochondrial Carbon Substrate Oxidation in DLBCL Subsets and Its Regulation by BCR Signaling
(A) Basal (left) and ATP-coupled (right) OCR in DLBCL subsets. OCR values shown are average of all cell lines per DLBCL subtype indicated on top. For each cell line, 7–13 independent OCR measurements were taken. NS denotes no substrate added exogenously. (B) Palmitate-stimulated basal OCR in “non-OxPhos” DLBCL cell lines after acute knockdown of SYK. Error bars, ± SEM. *p < 0.05; **p < 0.01; ***p < 0.001; two-tailed Student’s t-test. See also Figure S2.
Figure 4
Figure 4. Palmitate Metabolism and Its Effect on DLBCL Proliferation and Survival
(A–B) 13C isotopomer analysis of uniformly labeled palmitate (U13C-Palmitate). (A) Schematics depicting the number of carbons labeled (filled circles) in a defined set of metabolites derived from palmitate. Metabolites marked in red are selectively elevated in OxPhos-DLBCL cell lines (B). (B) 13C enrichment in palmitate-derived metabolites. For each metabolite, cumulative data obtained from all 4 OxPhos-DLBCL cell lines are shown relative to the mean value of that metabolite in all 4 BCR-DLBCL cell lines listed on top. (C) Effect of palmitate supplementation on the proliferation of DLBCL cell lines. Control denotes serum-free media containing all amino acids except L-glutamine. (D) Survival of DLBCL subsets cultured in the absence or presence of BrCA for 24 hr. Error bars, ± SEM. *p < 0.05; **p < 0.01; ***p < 0.001; two-tailed Student’s t-test. See also Figure S3.
Figure 5
Figure 5. Programmatic Regulation of FAO and Its Relevance to DLBCL Survival
(A) Effect of siRNA-mediated depletion of PPARγ on the survival of DLBCL subsets. (B) Survival of the indicated DLBCL cell lines cultured in the absence or presence of increasing concentrations of T0070907 for 96 hr. Error bars, ± SEM. **p < 0.01; ***p < 0.001; two-tailed Student’s t-test. See also Figure S4.
Figure 6
Figure 6. Utilization of Glucose-Derived Carbons in DLBCL Subsets
(A) PDH enzyme activity (middle) and lactate production from glucose (bottom) in DLBCL subsets. Data are cumulative from independent DLBCL cell lines listed on top. (B–C) 13C isotopomer analysis of uniformly labeled glucose (U13C-glucose) (B) Schematics depicting the number of carbons labeled (filled circles) in intermediary metabolites of glucose metabolism. (C) 13C enrichment in glucose-derived metabolites. For each metabolite, cumulative data obtained from all 4 OxPhos-DLBCL cell lines (Karpas 422, OCI-Ly4, Pfeiffer and Toledo; red bars) are shown relative to the mean value of that metabolite in all 4 BCR-DLBCL cell lines (SU-DHL-4, SU-DHL-6, OCI-Ly1 and OCI-Ly7; black bars). Error bars, ± SEM. *p < 0.05; **p < 0.01, ***p < 0.001; two-tailed Student’s t-test.
Figure 7
Figure 7. Contribution of Mitochondrial Metabolism to Cellular ATP and Energy Transduction in DLBCL Subsets
(A) Percent contribution of glycolysis and mitochondrial metabolism to total cellular ATP. For each subtype, cumulative data from 4 OxPhos-DLBCL (Karpas 422, OCI-Ly4, Pfeiffer, and Toledo) and 4 BCR-DLBCL (SU-DHL-4, SU-DHL-6, OCI-Ly1, and OCI-Ly7) cell lines are shown. (B) Mitochondrial ATP synthesis rate. Cumulative data from 4 OxPhos-DLBCL (red bar) and 4 BCR-DLBCL (black bar) cell lines are shown as in (A). (C) Average copy number of 110 mitochondrial SNP probes for 39 OxPhos-DLBCL and 33 BCR-DLBCL cases. Differences were tested using a Man-Whitney U-test and found to be non-significant. (D–F) OCR in isolated mitochondria in different respiratory states. (D) Schematics of mitochondrial respiratory complexes and substrates as well as mitochondrial inhibitors used to measure their specific activities. (E) Representative OCR traces in mitochondria isolated from DLBCL cell lines indicating respiratory states examined as described in the Supplemental Experimental Procedures. (F) OCR in isolated mitochondria measured using complex I- or complex II-linked substrates. Data are derived from 4 cell lines per DLBCL subset listed on top. Error bars in A, B and F, ± SEM. **p < 0.01; ***p < 0.001; two-tailed Student’s t-test. See also Figure S5.
Figure 8
Figure 8. Differential Contribution of ROS Detoxification to Survival of DLBCL Subsets
(A) Mitochondrial superoxide (left), total cellular ROS (middle) and GSH (right) levels in DLBCL subtypes. Data are derived from 4 cell lines per DLBCL subset listed on top. (B–C) De novo GSH synthesis pathway (B) and the effect of GCS depletion on DLBCL survival. Cell viability was assessed 72 hr after knockdown. GCS, γ-glutamyl cysteine synthase. Error bars, ± SEM. *p < 0.05; **p < 0.01, ***p < 0.001; two-tailed Student’s t-test. See also Figure S6.

Comment in

References

    1. Abramson JS, Shipp MA. Advances in the biology and therapy of diffuse large B-cell lymphoma: moving toward a molecularly targeted approach. Blood. 2005;106:1164–1174. - PubMed
    1. Alizadeh AA, Eisen MB, Davis RE, Ma C, Lossos IS, Rosenwald A, Boldrick JC, Sabet H, Tran T, Yu X, et al. Distinct types of diffuse large B-cell lymphoma identified by gene expression profiling. Nature. 2000;403:503–511. - PubMed
    1. Barger JF, Plas DR. Balancing biosynthesis and bioenergetics: metabolic programs in oncogenesis. Endocr Relat Cancer. 2010;17:R287–R304. - PubMed
    1. Burton JD, Goldenberg DM, Blumenthal RD. Potential of peroxisome proliferator-activated receptor gamma antagonist compounds as therapeutic agents for a wide range of cancer types. PPAR Res. 2008;2008 494161. - PMC - PubMed
    1. Chen L, Monti S, Juszczynski P, Daley J, Chen W, Witzig TE, Habermann TM, Kutok JL, Shipp MA. SYK-dependent tonic B-cell receptor signaling is a rational treatment target in diffuse large B-cell lymphoma. Blood. 2008;111:2230–2237. - PMC - PubMed

Publication types

Associated data

LinkOut - more resources