

MATH, a novel measure of intratumor genetic heterogeneity, is high in poor-outcome classes of head and neck squamous cell carcinoma
- PMID: 23079694
- PMCID: PMC3570658
- DOI: 10.1016/j.oraloncology.2012.09.007
MATH, a novel measure of intratumor genetic heterogeneity, is high in poor-outcome classes of head and neck squamous cell carcinoma
Abstract
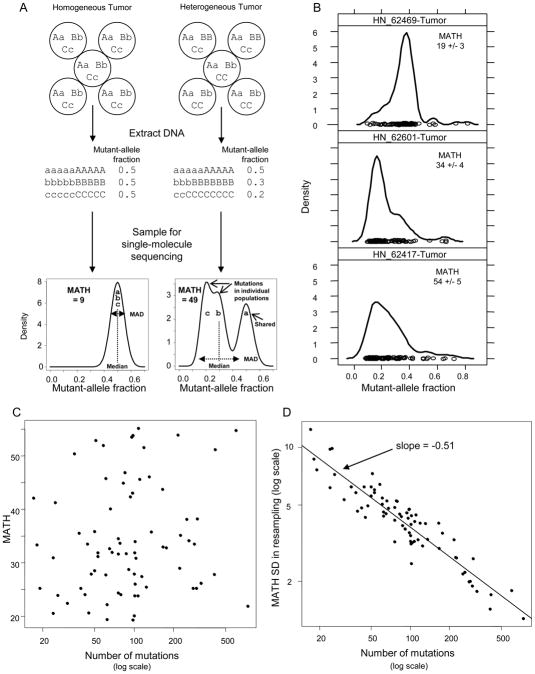
Objectives: Differences among cancer cells within a tumor are important in tumorigenesis and treatment resistance, yet no measure of intratumor heterogeneity is suitable for routine application. We developed a quantitative measure of intratumor genetic heterogeneity, based on differences among mutated loci in the mutant-allele fractions determined by next-generation sequencing (NGS) of tumor DNA. We then evaluated the application of this measure to head and neck squamous cell carcinoma (HNSCC).
Materials and methods: We analyzed published electronically available NGS results for 74 HNSCC. For each tumor we calculated mutant-allele tumor heterogeneity (MATH) as the ratio of the width to the center of its distribution of mutant-allele fractions among tumor-specific mutated loci.
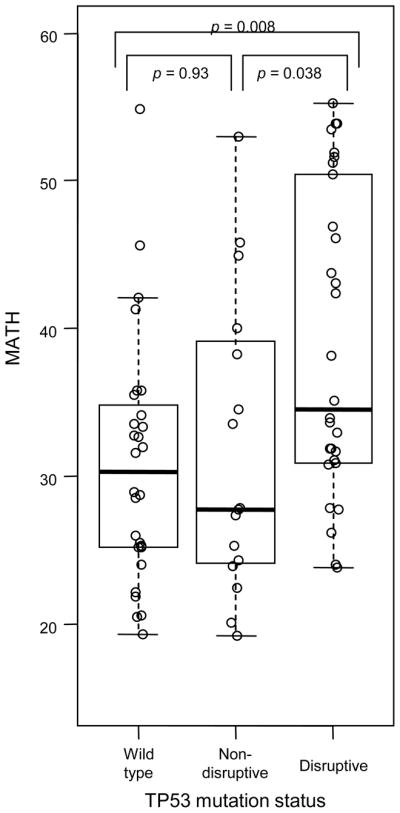
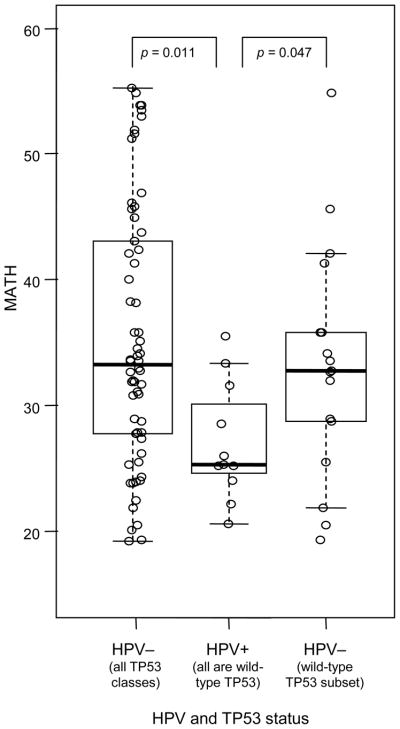
Results: Intratumor heterogeneity assessed by MATH was higher in three poor-outcome classes of HNSCC: tumors with disruptive mutations in the TP53 gene (versus wild-type TP53 or non-disruptive mutations), tumors negative versus positive for human papillomavirus (even when restricted to tumors having wild-type TP53), and HPV-negative tumors from smokers with more pack-years of cigarette exposure (with TP53 status taken into account).
Conclusion: The relation of this type of intratumor heterogeneity to HNSCC outcome classes supports its further evaluation as a prognostic biomarker. As NGS of tumor DNA becomes widespread in clinical research and practice, MATH should provide a simple, quantitative, and clinically practical biomarker to help evaluate relations of intratumor genetic heterogeneity to outcome in any type of cancer.
Copyright © 2012 Elsevier Ltd. All rights reserved.
Figures
References
-
- Marusyk A, Almendro V, Polyak K. Intra-tumour heterogeneity: a looking glass for cancer? Nat Rev Cancer. 2012;12(5):323–334. - PubMed
-
- Maley CC, Galipeau PC, Finley JC, Wongsurawat VJ, Li X, Sanchez CA, et al. Genetic clonal diversity predicts progression to esophageal adenocarcinoma. Nat Genet. 2006;38(4):468–473. - PubMed
-
- Jovanovic L, Delahunt B, McIver B, Eberhardt NL, Grebe SK. Most multifocal papillary thyroid carcinomas acquire genetic and morphotype diversity through subclonal evolution following the intra-glandular spread of the initial neoplastic clone. J Pathol. 2008;215(2):145–154. - PubMed
Publication types
MeSH terms
Substances
Grants and funding
LinkOut - more resources
Full Text Sources
Other Literature Sources
Medical
Molecular Biology Databases
Research Materials
Miscellaneous
