. 2013 Jan;83(1):141-9.
doi: 10.1002/cyto.a.22156. Epub 2012 Oct 18.

Flow cytometric determination of stem/progenitor content in epithelial tissues: an example from nonsmall lung cancer and normal lung

Affiliations

Flow cytometric determination of stem/progenitor content in epithelial tissues: an example from nonsmall lung cancer and normal lung

Vera S Donnenberg et al. Cytometry A. 2013 Jan.

Abstract

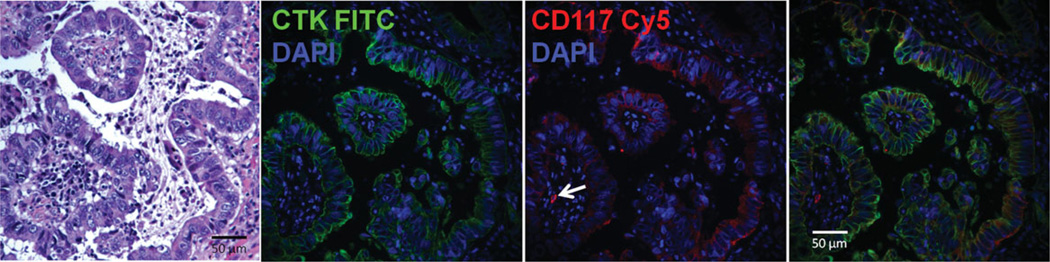
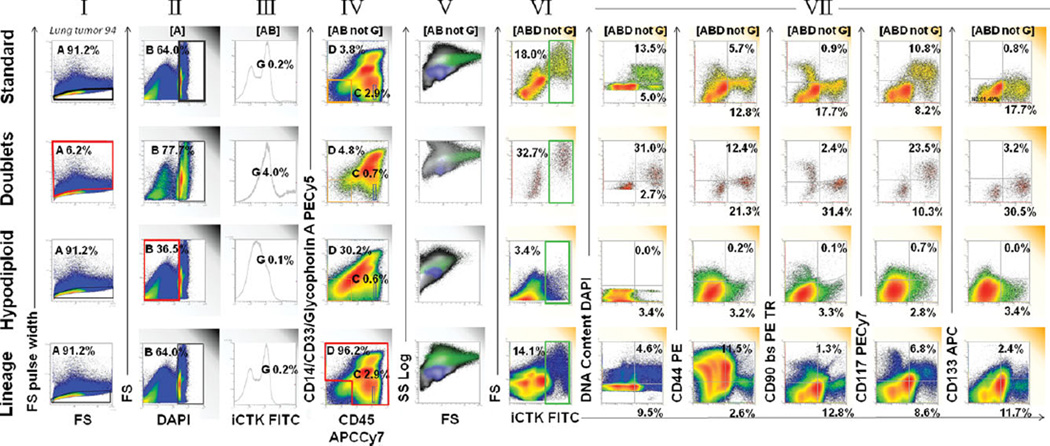
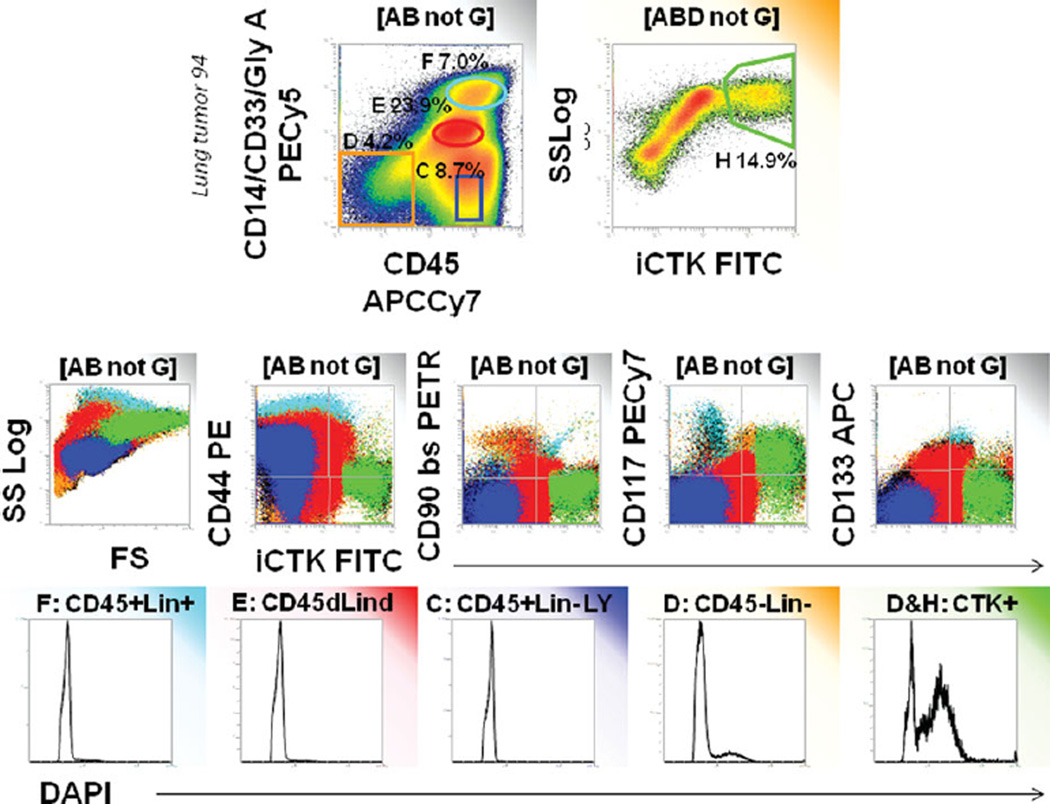
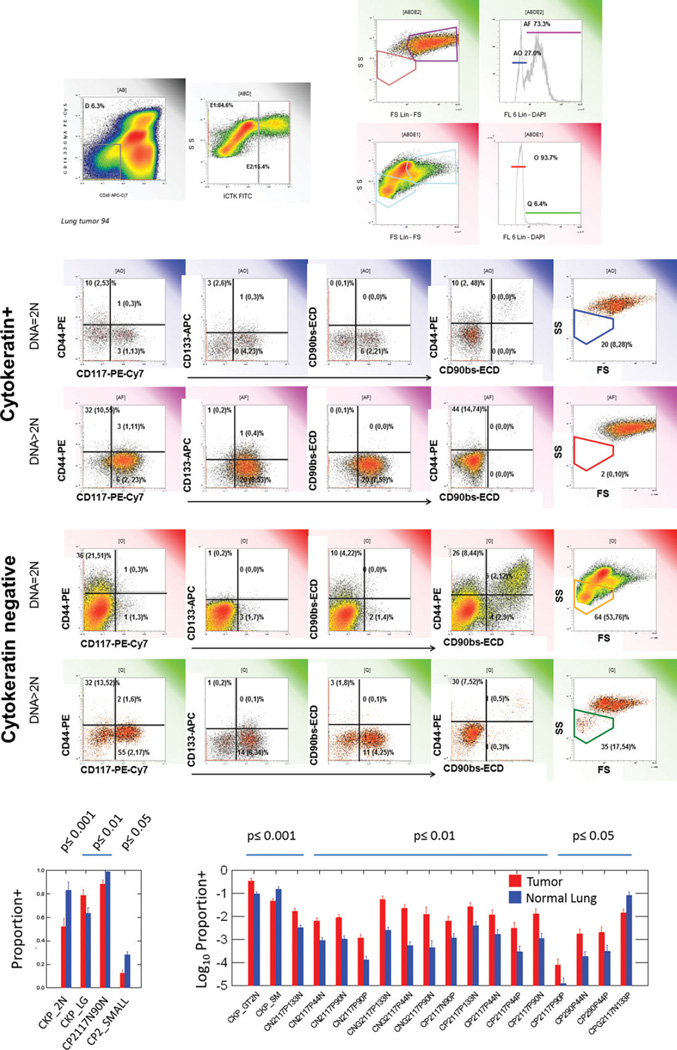
Single cell analysis and cell sorting has enabled the study of development, growth, differentiation, repair and maintenance of "liquid" tissues and their cancers. The application of these methods to solid tissues is equally promising, but several unique technical challenges must be addressed. This report illustrates the application of multidimensional flow cytometry to the identification of candidate stem/progenitor populations in non-small cell lung cancer and paired normal lung tissue. Seventeen paired tumor/normal lung samples were collected at the time of surgical excision and processed immediately. Tissues were mechanically and enzymatically dissociated into single cell suspension and stained with a panel of antibodies used for negative gating (CD45, CD14, CD33, glycophorin A), identification of epithelial cells (intracellular cytokeratin), and detection of stem/progenitor markers (CD44, CD90, CD117, CD133). DAPI was added to measure DNA content. Formalin fixed paraffin embedded tissue samples were stained with key markers (cytokeratin, CD117, DAPI) for immunofluorescent tissue localization of populations detected by flow cytometry. Disaggregated tumor and lung preparations contained a high proportion of events that would interfere with analysis, were they not eliminated by logical gating. We demonstrate how inclusion of doublets, events with hypodiploid DNA, and cytokeratin+ events also staining for hematopoietic markers reduces the ability to quantify epithelial cells and their precursors. Using the lung cancer/normal lung data set, we present an approach to multidimensional data analysis that consists of artifact removal, identification of classes of cells to be studied further (classifiers) and the measurement of outcome variables on these cell classes. The results of bivariate analysis show a striking similarity between the expression of stem/progenitor markers on lung tumor and adjacent tumor-free lung.


Figures

Figure 1
Figure 1
Immunofluorescent staining of non-small cell lung cancer. FFPE sections were stained with hematoxylin/eosin (left panel) or for cytokeratin (green), CD117 expression (red), or DNA content (blue). These key markers, which are also used in the flow cytometry panel, allow us to assess the quality of the tumor specimen and provide information about the histological location of marker+ cells. In this specimen the great majority of cytokeratin+ cells express CD117. This information helps us confirm that enzymatic digestion has not reduced the proportion of CD117 cells when the same tumor is prepared for flow cytometry. The arrow (center panel) shows a solitary cytokeratin negative CD117+ mast cell. The presence of mast cells serves as a CD117 positive control for both immunohistostaining and flow cytome-try in CD117 negative tumors.
Figure 2
Figure 2
Strategies for artifact removal in analysis of disaggregated solid tissue. The top row shows our standard protocol for artifact removal prior to detection of ploidy and four stem/progenitor markers measured on a primary nonsmall cell lung cancer sample. The first four panels (left to right) show the steps in artifact removal: (I) Eliminate doublets and cell clusters by forward scatter pulse analysis; (II) Eliminate events with hypodiploid DNA or no detectable DNA; (III) Eliminate saturating events (last 10 channels); (IV) Use a dump gate to eliminate cells that stain for markers not present on the population of interest. Next (V) forward versus side scatter is shown on ″cleaned″ events in a color precedence density plot [blue = CD45bright lymphocytes (IV), green = cytokeratin+(VI)]. The next five plots (VII) show individual features versus intracellular cytokeratin. This tumor had high forward scatter, a high proportion of aneuploid cytokeratin+ cells, scant population of CD44, CD90, and CD133+ cells and a prominent population of CD117+ cells. The second row shows the properties of event doublets and clusters (I red region, eliminated from the top analysis). Doublets expressed greater cytokeratin, were of higher light scatter and had greater DNA content than singlet cells, indicating that most were undigested tumor cell clusters. The third row shows the properties of hypodiploid events (II, red region). These bind antibody, but the proportions are very different from that of cells with 2N DNA. The bottom row shows the staining of all events outside the lineage negative gate (IV, red region). There is a population that appears to stain for cytokeratin, but the proportion of aneuploid cells is greatly reduced, making it unlikely that most are genuine tumor cells. These apparently cytokeratin+ events have populations that streak into the ″positive″ regions for many of the stem/progenitor regions.
Figure 3
Figure 3
Characteristics of populations eliminated by CD45/heme lineage dump gate. Color-eventing is used to trace four major populations observed in the CD45 by heme lineage histogram. All events are gated as described in Figure 1 The majority of aneuploid cells are contained within the nonhematopoietic gate used as a first step in analysis (D, orange). Aneuploid cells are further concentrated when events within D are further gated on cytokeratin+. Lymphocytes (C, blue) are predictably cytokeratin negative, diploid, CD44+ and negative for stem/progenitor markers. Monocytes (E, red) are diploid and appear to be cytokeratin dim to bright, but isotype controls reveal the dim population to be negative (not shown). Cytokeratin bright monocytes have cytokeratin+ cytoplasmic inclusions (Supporting Information Fig. S1). Granulocytes and mast cells (F, turquoise). Granulocytes are diploid, autofluorescent, and negative for cytokeratin and stem/ progenitor markers. Mast cells are CD117+ and CD44+.
Figure 4
Figure 4
Identification of classifiers and outcomes. The top panels show identification of cytokeratin+ (E2) and cytokeratin negative (E1) cells among nonhematopoietic (D) cells. These were further subdivided in diploid and aneuploid populations, creating four classes on which to measure outcomes (stem/progenitor markers, light scatter). The region percents listed are mean values, parentheses indicate lower and upper 95% confidence intervals. The same analysis was performed on normal lung samples (Supporting Information Fig. S3). Bottom panels: Bivariate comparison of tumor and normal lung. Eighty-six quantitative variables extracted from analysis were compared between tumor and normal lung samples. Log normally distributed variables were log transformed prior to analysis. Only statistically significant comparisons are shown (uncorrected P-values, Student′s 2-tailed test, pooled variance). Bars represent mean values, error bars = standard error of the mean.

Comment in

References

    1. Ehrlich P. Methodologische Beitra¨ge zur Physiologie und Pathologie der verschiedenen Formen der Leukocyten. Z Klin Med. 1879;1:5553–5560.
    1. Reinherz EL, Kung PC, Goldstein G, Schlossman SF. Further characterization of the human inducer T cell subset defined by monoclonal antibody. J Immunol. 1979;123:2894–2996. - PubMed
    1. Spangrude GJ, Heimfeld S, Weissman IL. Purification and characterization of mouse hematopoietic stem cells. Science. 1988;241:58–62. - PubMed
    1. Fulwyler MJ. Electronic separation of biological cells by volume. Science. 1965;150:910–911. - PubMed
    1. Hulett HR, Bonner WA, Barrett J, Herzenberg LA. Cell sorting: automated separation of mammalian cells as a function of intracellular fluorescence. Science. 1969;166:747–749. - PubMed

Publication types

MeSH terms