

Involvement of guanylin and GC-C in rat mesenteric macrophages in resistance to a high-fat diet
- PMID: 23081987
- PMCID: PMC3520543
- DOI: 10.1194/jlr.M029017
Involvement of guanylin and GC-C in rat mesenteric macrophages in resistance to a high-fat diet
Abstract
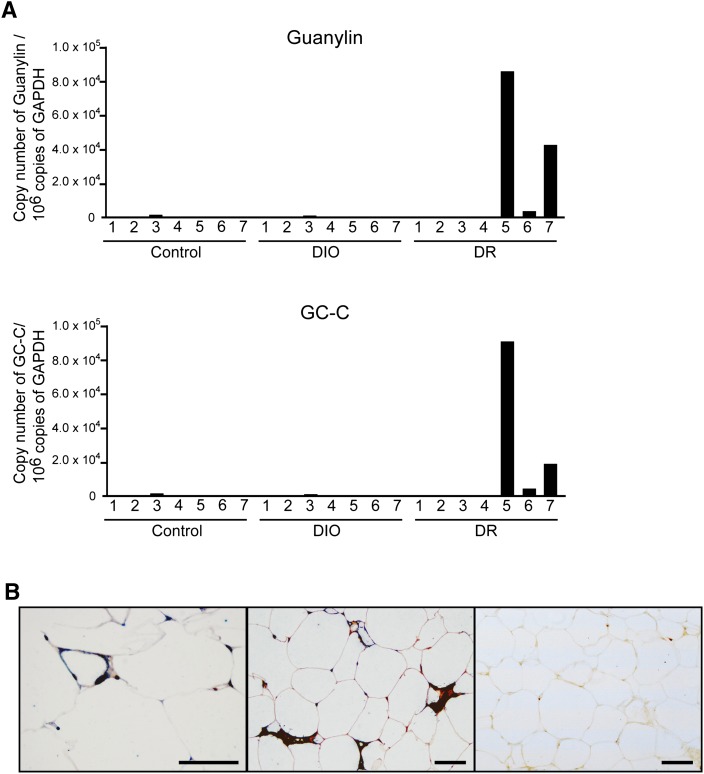
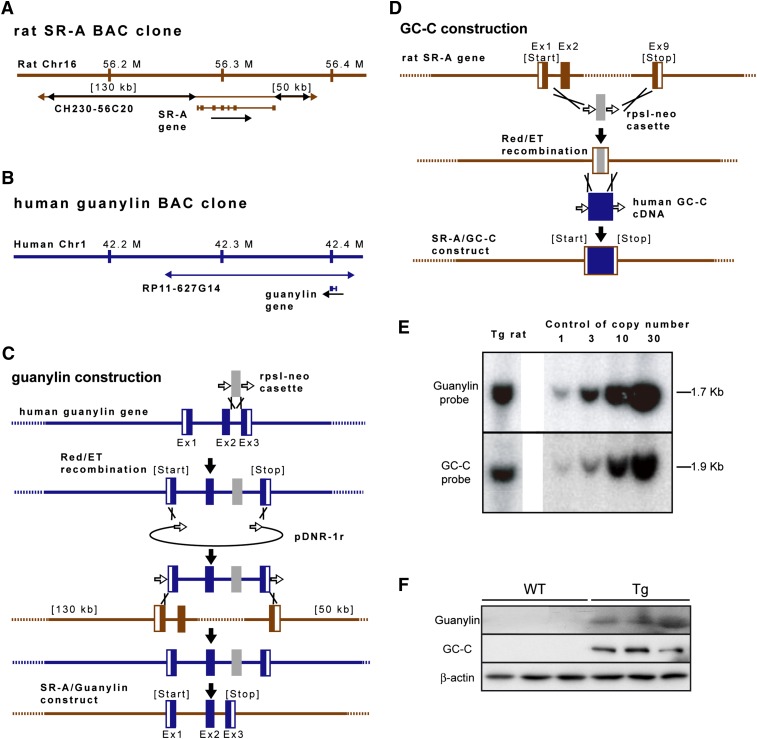
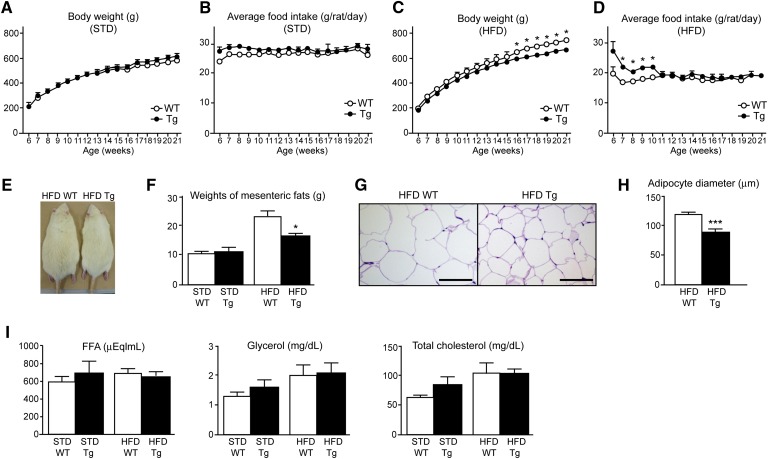
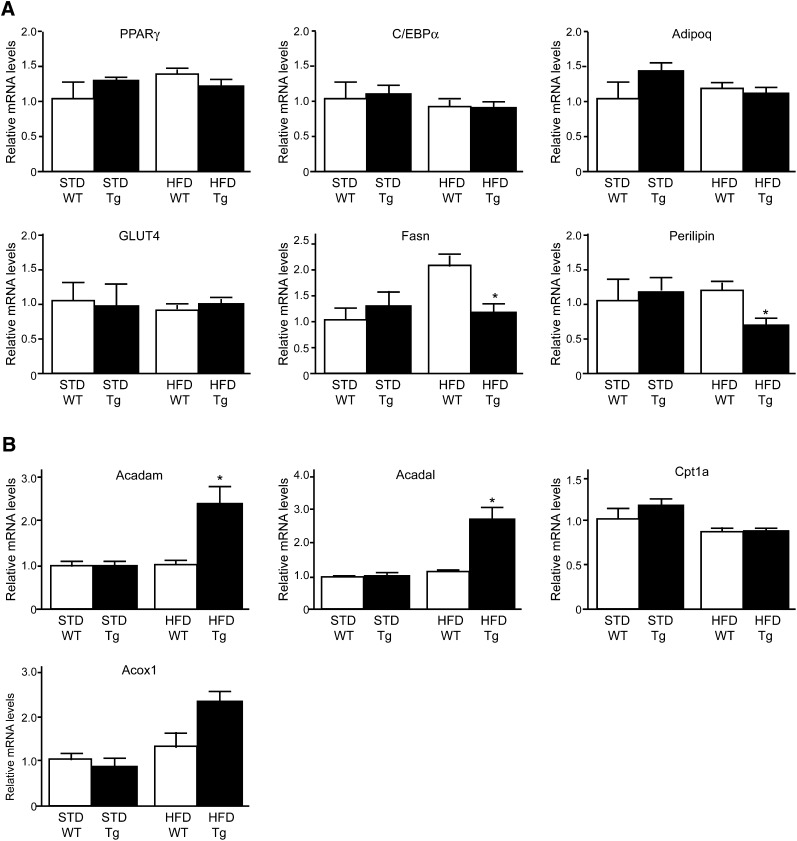
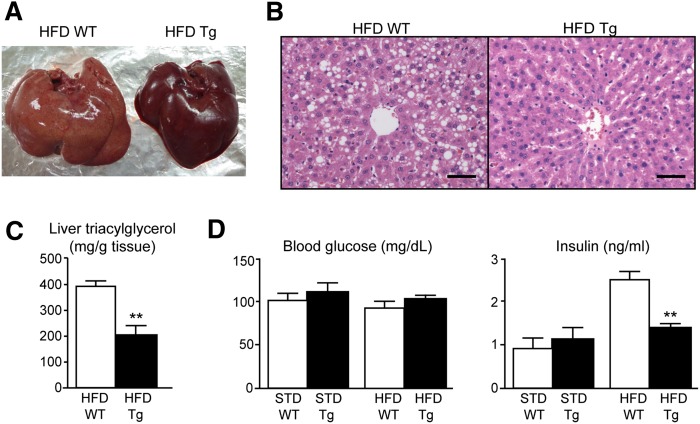
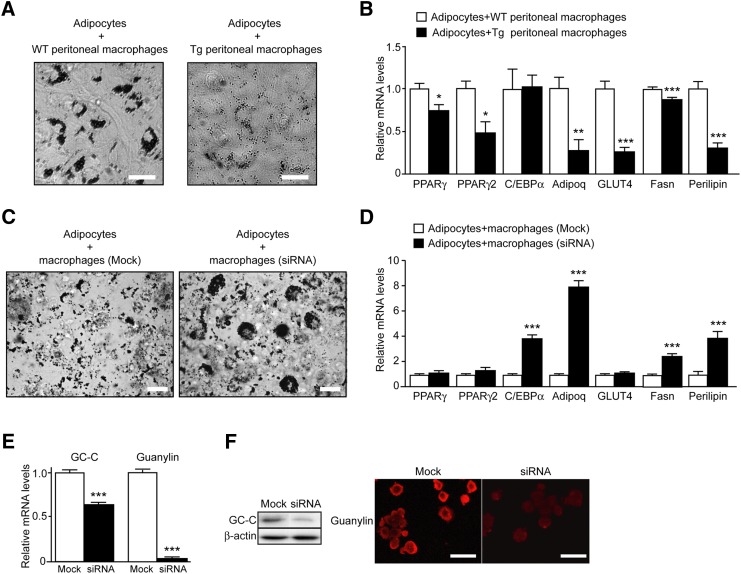
A high-fat diet (HFD) is a well-known contributing factor in the development of obesity. Most rats fed HFDs become obese. Those that avoid obesity when fed HFDs are considered diet resistant (DR). We performed a microarray screen to identify genes specific to the mesenteric fat of DR rats and revealed high expression of guanylin and guanylyl cyclase C (GC-C) in some subjects. Our histologic studies revealed that the cellular source of guanylin and GC-C is macrophages. Therefore, we developed double-transgenic (Tg) rats overexpressing guanylin and GC-C in macrophages and found that they were resistant to the effects of HFDs. In the mesenteric fat of HFD-fed Tg rats, Fas and perilipin mRNAs were downregulated, and those of genes involved in fatty acid oxidation were upregulated, compared with the levels in HFD-fed wild-type rats. In vitro studies demonstrated that lipid accumulation was markedly inhibited in adipocytes cocultured with macrophages expressing guanylin and GC-C and that this inhibition was reduced after treatment with guanylin- and GC-C-specific siRNAs. Our results suggest that the macrophagic guanylin-GC-C system contributes to the altered expression of genes involved in lipid metabolism, leading to resistance to obesity.
Figures
Similar articles
-
Guanylyl cyclase C and guanylin reduce fat droplet accumulation in cattle mesenteric adipose tissue.J Vet Sci. 2017 Sep 30;18(3):341-348. doi: 10.4142/jvs.2017.18.3.341. J Vet Sci. 2017. PMID: 27586464 Free PMC article.
-
Guanylin-Guanylyl cyclase-C signaling in macrophages regulates mesenteric fat inflammation induced by high-fat diet.Endocr J. 2015;62(10):939-47. doi: 10.1507/endocrj.EJ15-0193. Epub 2015 Aug 6. Endocr J. 2015. PMID: 26249840
-
Interleukin-15 derived from Guanylin-GC-C-expressing macrophages inhibits fatty acid synthase in adipocytes.Peptides. 2018 Jan;99:14-19. doi: 10.1016/j.peptides.2017.10.012. Epub 2017 Oct 31. Peptides. 2018. PMID: 29097254
-
GCC signaling in colorectal cancer: Is colorectal cancer a paracrine deficiency syndrome?Drug News Perspect. 2009 Jul-Aug;22(6):313-8. doi: 10.1358/dnp.2009.22.6.1395254. Drug News Perspect. 2009. PMID: 19771320 Free PMC article. Review.
-
[Guanylin family: new intestinal peptides regulating salt and water homeostasis].Nihon Rinsho. 1998 Sep;56(9):2427-32. Nihon Rinsho. 1998. PMID: 9780732 Review. Japanese.
Cited by
-
Receptor Guanylyl Cyclase C and Cyclic GMP in Health and Disease: Perspectives and Therapeutic Opportunities.Front Endocrinol (Lausanne). 2022 Jun 29;13:911459. doi: 10.3389/fendo.2022.911459. eCollection 2022. Front Endocrinol (Lausanne). 2022. PMID: 35846281 Free PMC article. Review.
-
Mutational landscape of receptor guanylyl cyclase C: Functional analysis and disease-related mutations.IUBMB Life. 2020 Jun;72(6):1145-1159. doi: 10.1002/iub.2283. Epub 2020 Apr 15. IUBMB Life. 2020. PMID: 32293781 Free PMC article. Review.
-
Guanylin and uroguanylin stimulate lipolysis in human visceral adipocytes.Int J Obes (Lond). 2016 Sep;40(9):1405-15. doi: 10.1038/ijo.2016.66. Epub 2016 Apr 25. Int J Obes (Lond). 2016. PMID: 27108812
-
Guanylyl cyclase C and guanylin reduce fat droplet accumulation in cattle mesenteric adipose tissue.J Vet Sci. 2017 Sep 30;18(3):341-348. doi: 10.4142/jvs.2017.18.3.341. J Vet Sci. 2017. PMID: 27586464 Free PMC article.
-
C-type natriuretic peptide ameliorates pulmonary fibrosis by acting on lung fibroblasts in mice.Respir Res. 2016 Feb 19;17:19. doi: 10.1186/s12931-016-0335-6. Respir Res. 2016. PMID: 26895702 Free PMC article.
References
-
- Hedley A. A., Ogden C. L., Johnson C. L., Carroll M. D., Curtin L. R., Flegal K. M. 2004. Prevalence of overweight and obesity among US children, adolescents, and adults, 1999–2002. JAMA. 291: 2847–2850 - PubMed
-
- Bray G. A., Bellanger T. 2006. Epidemiology, trends, and morbidities of obesity and the metabolic syndrome. Endocrine. 29: 109–117 - PubMed
-
- Jones P. H. 2010. Management of obesity in the prevention of cardiovascular disease. Methodist Debakey Cardiovasc J. 6: 33–36 - PubMed
-
- James W. P., Rigby N., Leach R. 2006. Obesity and the metabolic syndrome: the stress on society. Ann. N. Y. Acad. Sci. 1083: 1–10 - PubMed
Publication types
MeSH terms
Substances
LinkOut - more resources
Full Text Sources
Other Literature Sources
Molecular Biology Databases
Research Materials
Miscellaneous
