

Birth weight and long-term overweight risk: systematic review and a meta-analysis including 643,902 persons from 66 studies and 26 countries globally
- PMID: 23082214
- PMCID: PMC3474767
- DOI: 10.1371/journal.pone.0047776
Birth weight and long-term overweight risk: systematic review and a meta-analysis including 643,902 persons from 66 studies and 26 countries globally
Abstract
Background: Overweight is among the major challenging health risk factors. It has been claimed that birth weight, being a critical indicator of prenatal developmental conditions, is related to long-term overweight risk. In order to check this important assumption of developmental and preventive medicine, we performed a systematic review and comprehensive meta-analysis.
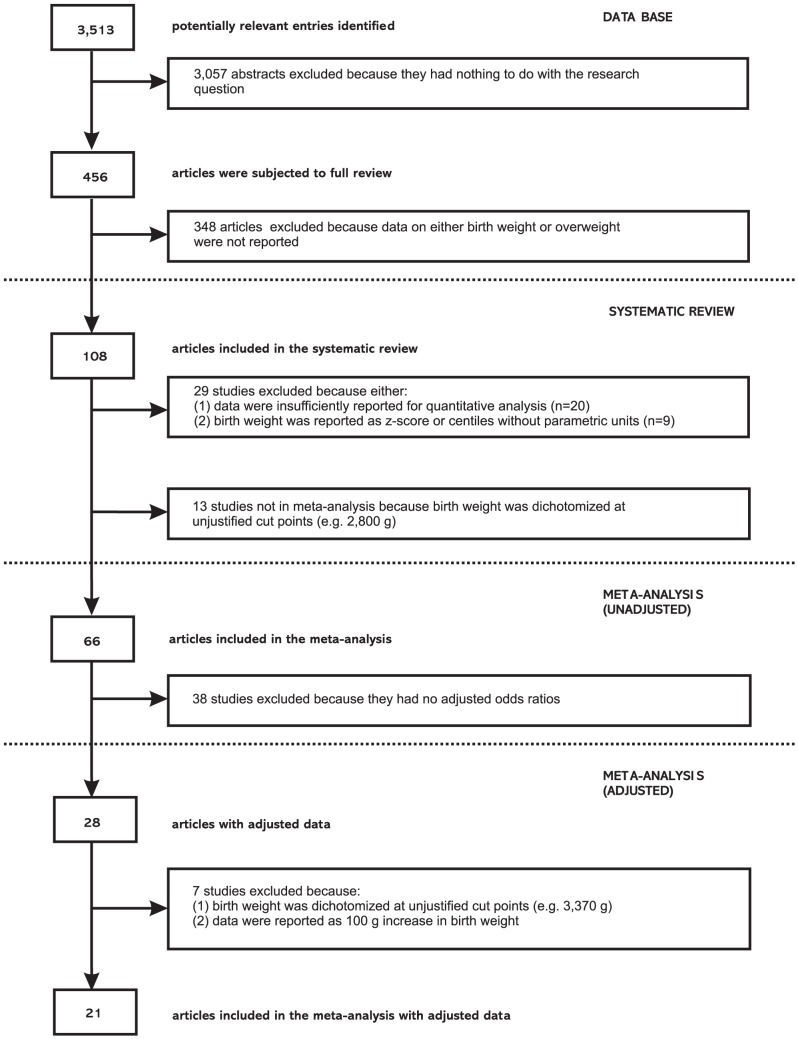
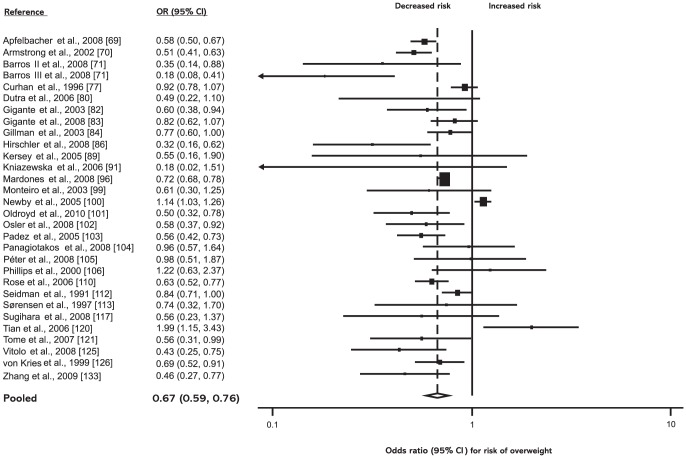
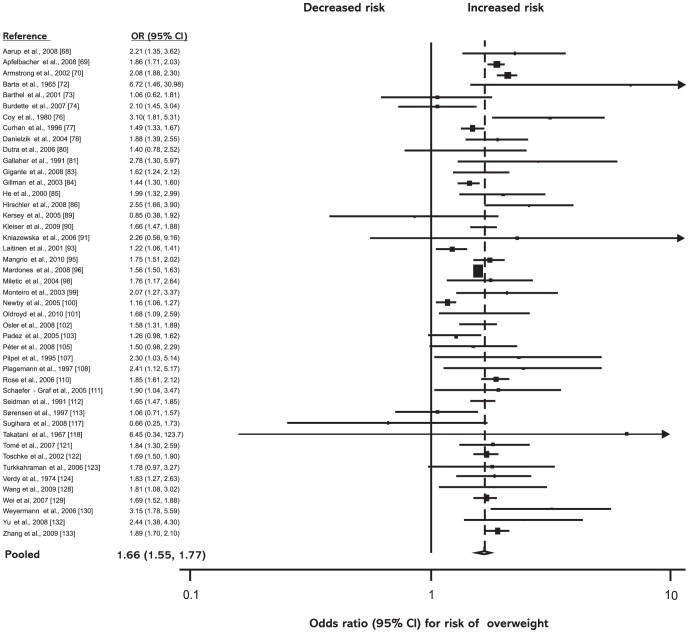
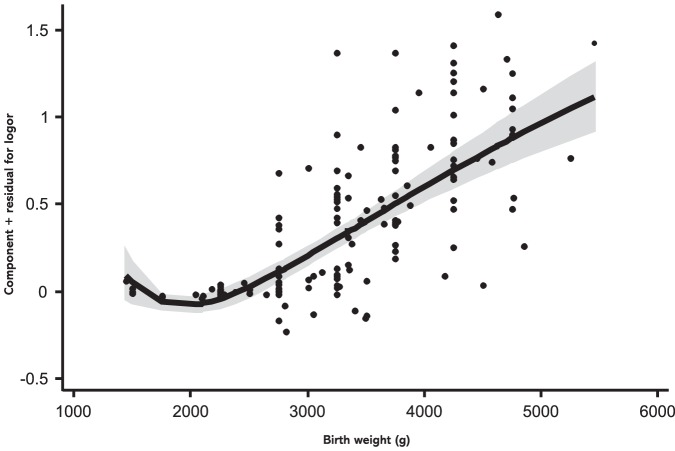
Methods and findings: Relevant studies published up to January 2011 that investigated the relation between birth weight and later risk of overweight were identified through literature searches using MEDLINE and EMBASE. For meta-analysis, 66 studies from 26 countries and five continents were identified to be eligible, including 643,902 persons aged 1 to 75 years. We constructed random-effects and fixed-effects models, performed subgroup-analyses, influence-analyses, assessed heterogeneity and publication bias, performed meta-regression analysis as well as analysis of confounder adjusted data. Meta-regression revealed a linear positive relationship between birth weight and later overweight risk (p<0.001). Low birth weight (<2,500 g) was found to be followed by a decreased risk of overweight (odds ratio (OR) =0.67; 95% confidence interval (CI) 0.59-0.76). High birth weight (>4,000 g) was associated with increased risk of overweight (OR=1.66; 95% CI 1.55-1.77). Results did not change significantly by using normal birth weight (2,500-4,000 g) as reference category (OR=0.73, 95% CI 0.63-0.84, and OR=1.60, 95% CI 1.45-1.77, respectively). Subgroup- and influence-analyses revealed no indication for bias/confounding. Adjusted estimates indicate a doubling of long-term overweight risk in high as compared to normal birth weight subjects (OR=1.96, 95% CI 1.43-2.67).
Conclusions: Findings demonstrate that low birth weight is followed by a decreased long-term risk of overweight, while high birth weight predisposes for later overweight. Preventing in-utero overnutrition, e.g., by avoiding maternal overnutrition, overweight and/or diabetes during pregnancy, might therefore be a promising strategy of genuine overweight prevention, globally.
Conflict of interest statement
Figures
References
-
- King D (2011) The future challenge of obesity. Lancet 378: 743–744. - PubMed
-
- Mokdad AH, Ford ES, Bowman BA, Dietz WH, Vinicor F, et al. (2003) Prevalence of obesity, diabetes, and obesity related health risk factors, 2001. JAMA 289: 76–79. - PubMed
-
- Ogden CL, Carroll MD, Curtin LR, Lamb MM, Flegal KM (2010) Prevalence of high body mass index in US children and adolescents, 2007–2008. JAMA 303: 242–249. - PubMed
Publication types
MeSH terms
LinkOut - more resources
Full Text Sources
Medical
